

I recently wrote a blog introducing the concept of monitoring Elasticsearch with LogicMonitor. With the growing popularity of Elasticsearch, particularly the full ELK stack (Elasticsearch, Logstash, Kibana), Amazon Web Services (AWS) released their Elasticsearch service in late 2015. For those wanting to focus more on their data and less on managing Elasticsearch clusters, Amazon’s Elasticsearch is a great alternative. However, the new service does have limitations with respect to node level access and API capabilities. Yet with LogicMonitor’s powerful Active Discovery process, it is easy to monitor Amazon’s Elasticsearch in spite of these limitations.
One of AWS’s key goals with their services is to shield the user from the many inner complexities that make up the specific offering (networking, nodes, operating systems) and provide the user with an endpoint that can be used to interface with their application.
In the case of AWS’s Elasticsearch, only the application level API is available via HTTP, and this comes with limitations. For example, many API endpoints are not available, particularly those that effect settings on the backend at a lower level, such as shard allocation. This is due to the fact that the service handles such details, allowing the user to focus on their data.
Another limitation of Elasticsearch is node level access. Direct network connectivity to individual nodes that make up an AWS Elasticsearch service cluster (domain) is nonexistent, which makes monitoring the cluster at the node level challenging. This is where the beauty of LogicMonitor’s Active Discovery steps in – if we use the /_cat/nodes API to view the nodes of a AWS cluster, we see the following:
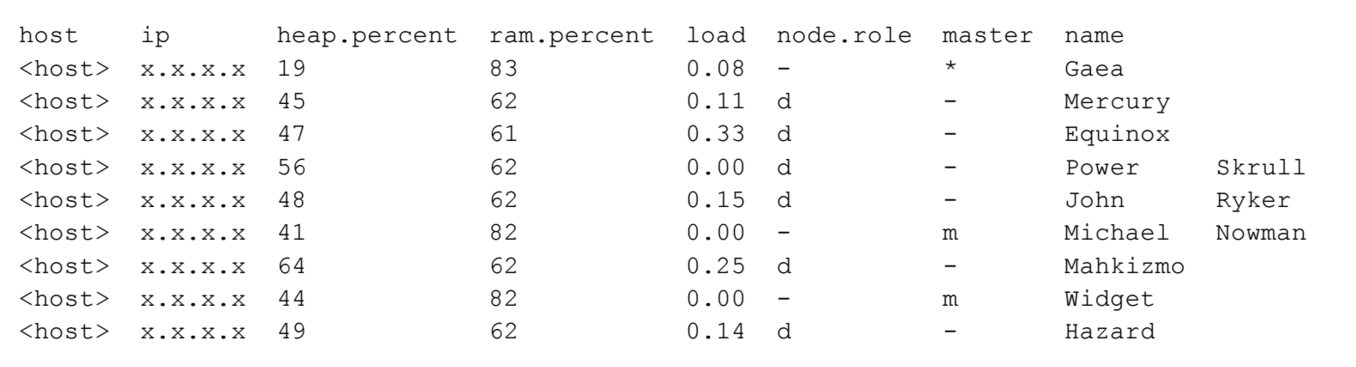
As you can see, hostnames and IP addresses are not exposed and even if they were, direct access would not be available. But by using Active Discovery, LogicMonitor can discover these individual nodes as instances within the cluster, similar to how we could discover individual disks or volumes on a server. And by using the cool Marvel comic names that Elasticsearch automatically assigns to nodes as the identifier, LogicMonitor can discover these instances and begin collecting metrics using the /_nodes API:
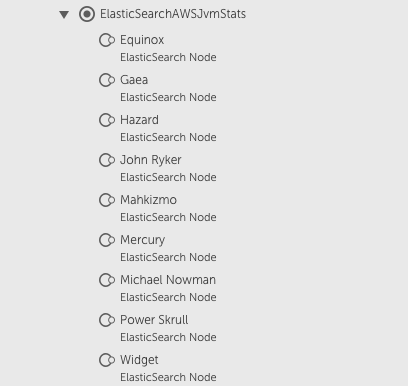
In addition to cluster-level statistics that are available via the /_cluster/stats API, we now have visibility at the node level to determine if one of our individual nodes is, for example, running out of heap space or spending too much time in garbage collection.
Another great feature of Amazon’s Elasticsearch is its ability to reconfigure a cluster on the fly. If a cluster that is already in production is running low on memory, it can be reconfigured to use larger instances without interruption in service. This reconfiguration is achieved by transparently spinning up new instances, adding them to the cluster, relocating all index shards to the new instances, and finally dropping the original instances from the cluster.
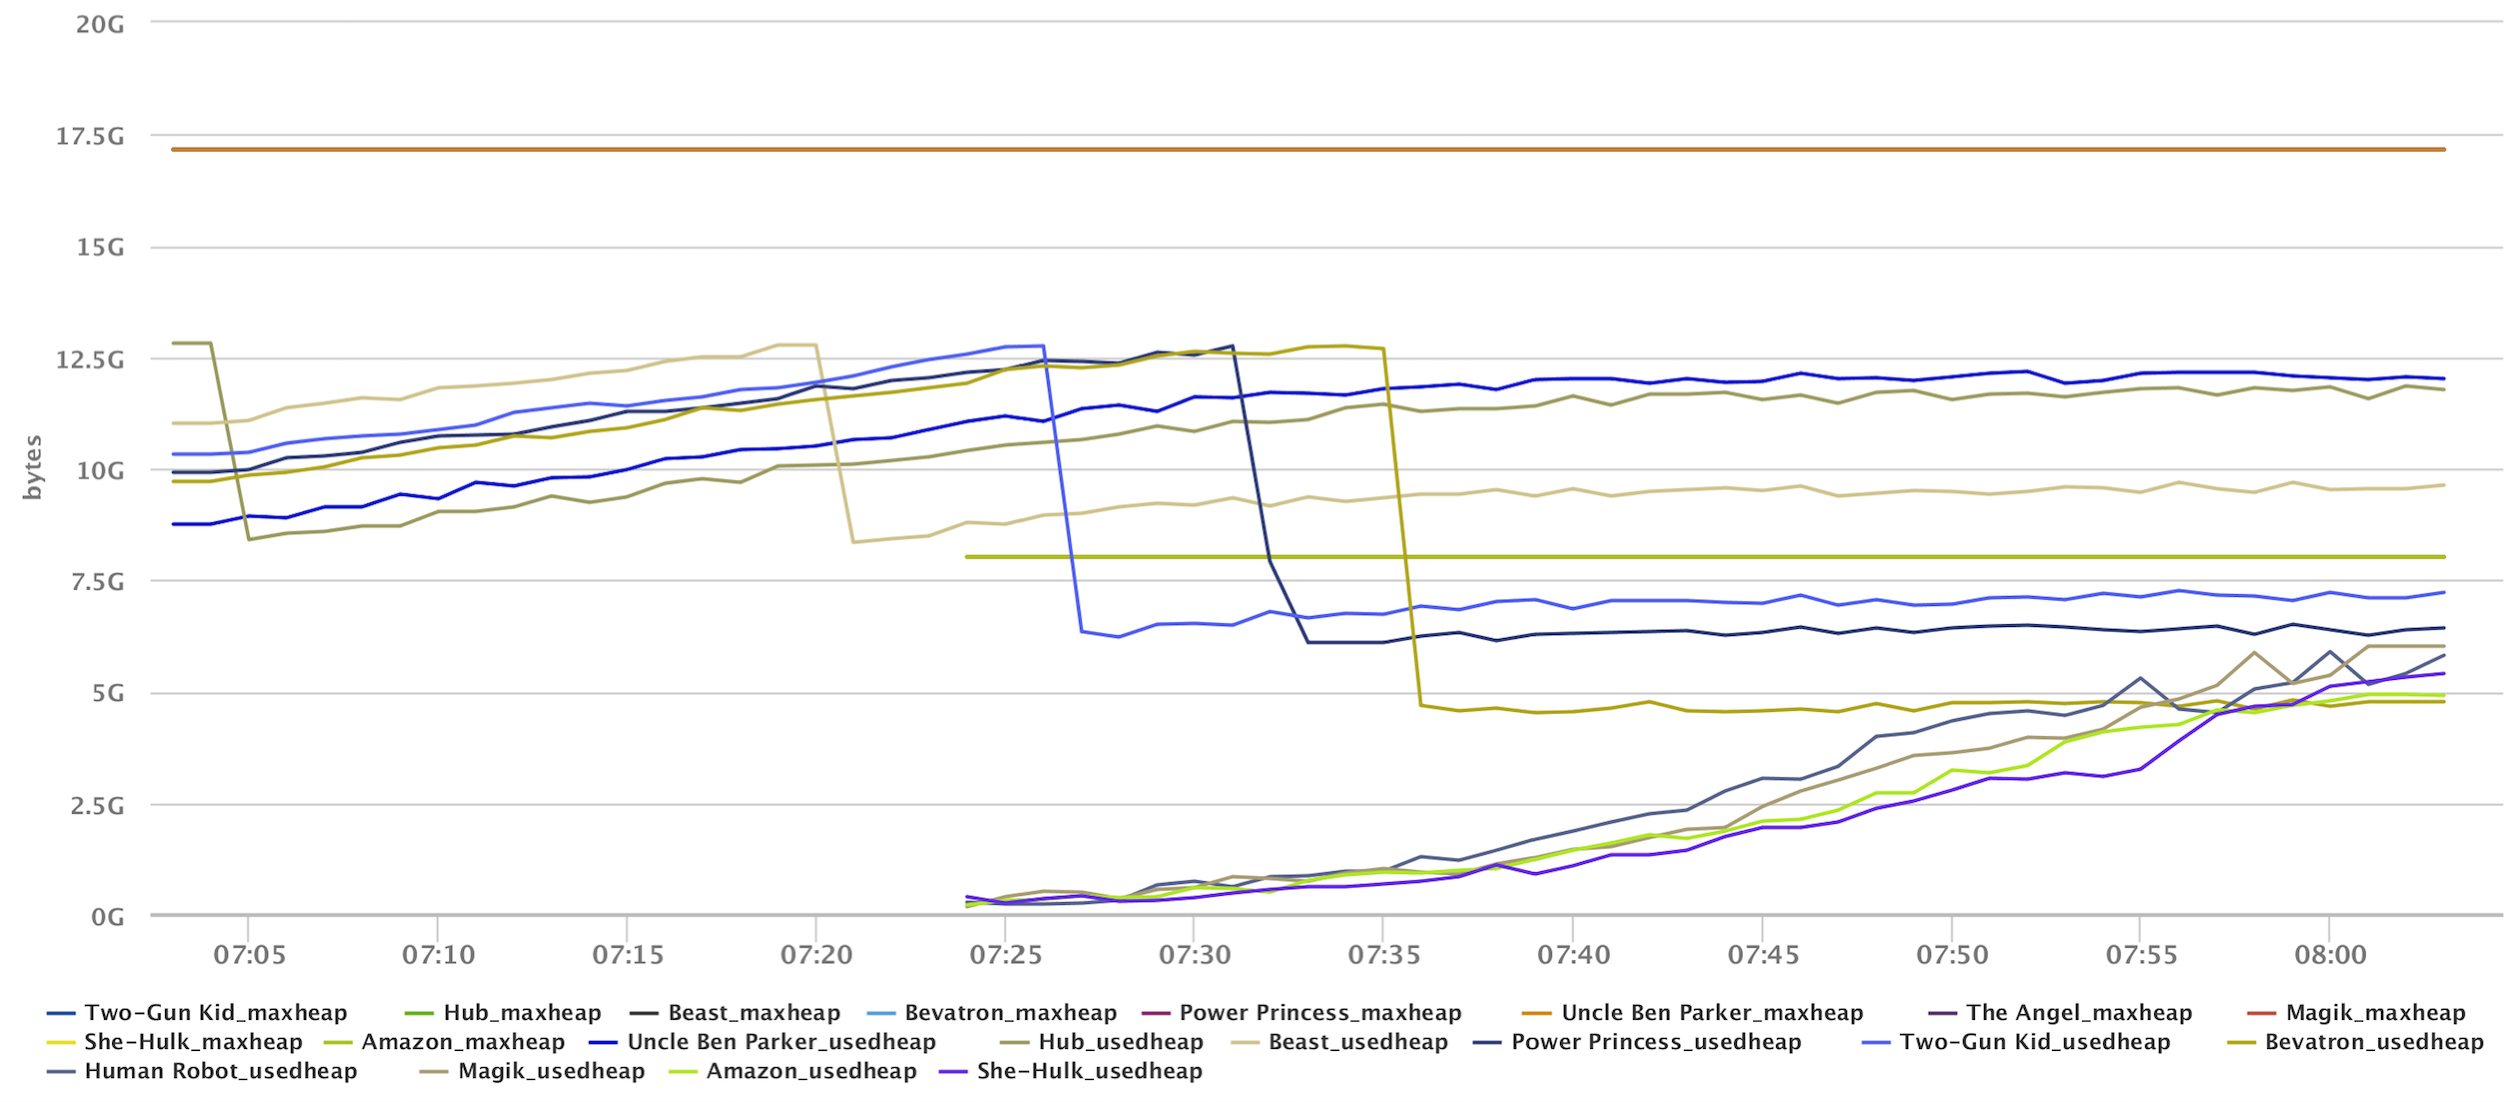
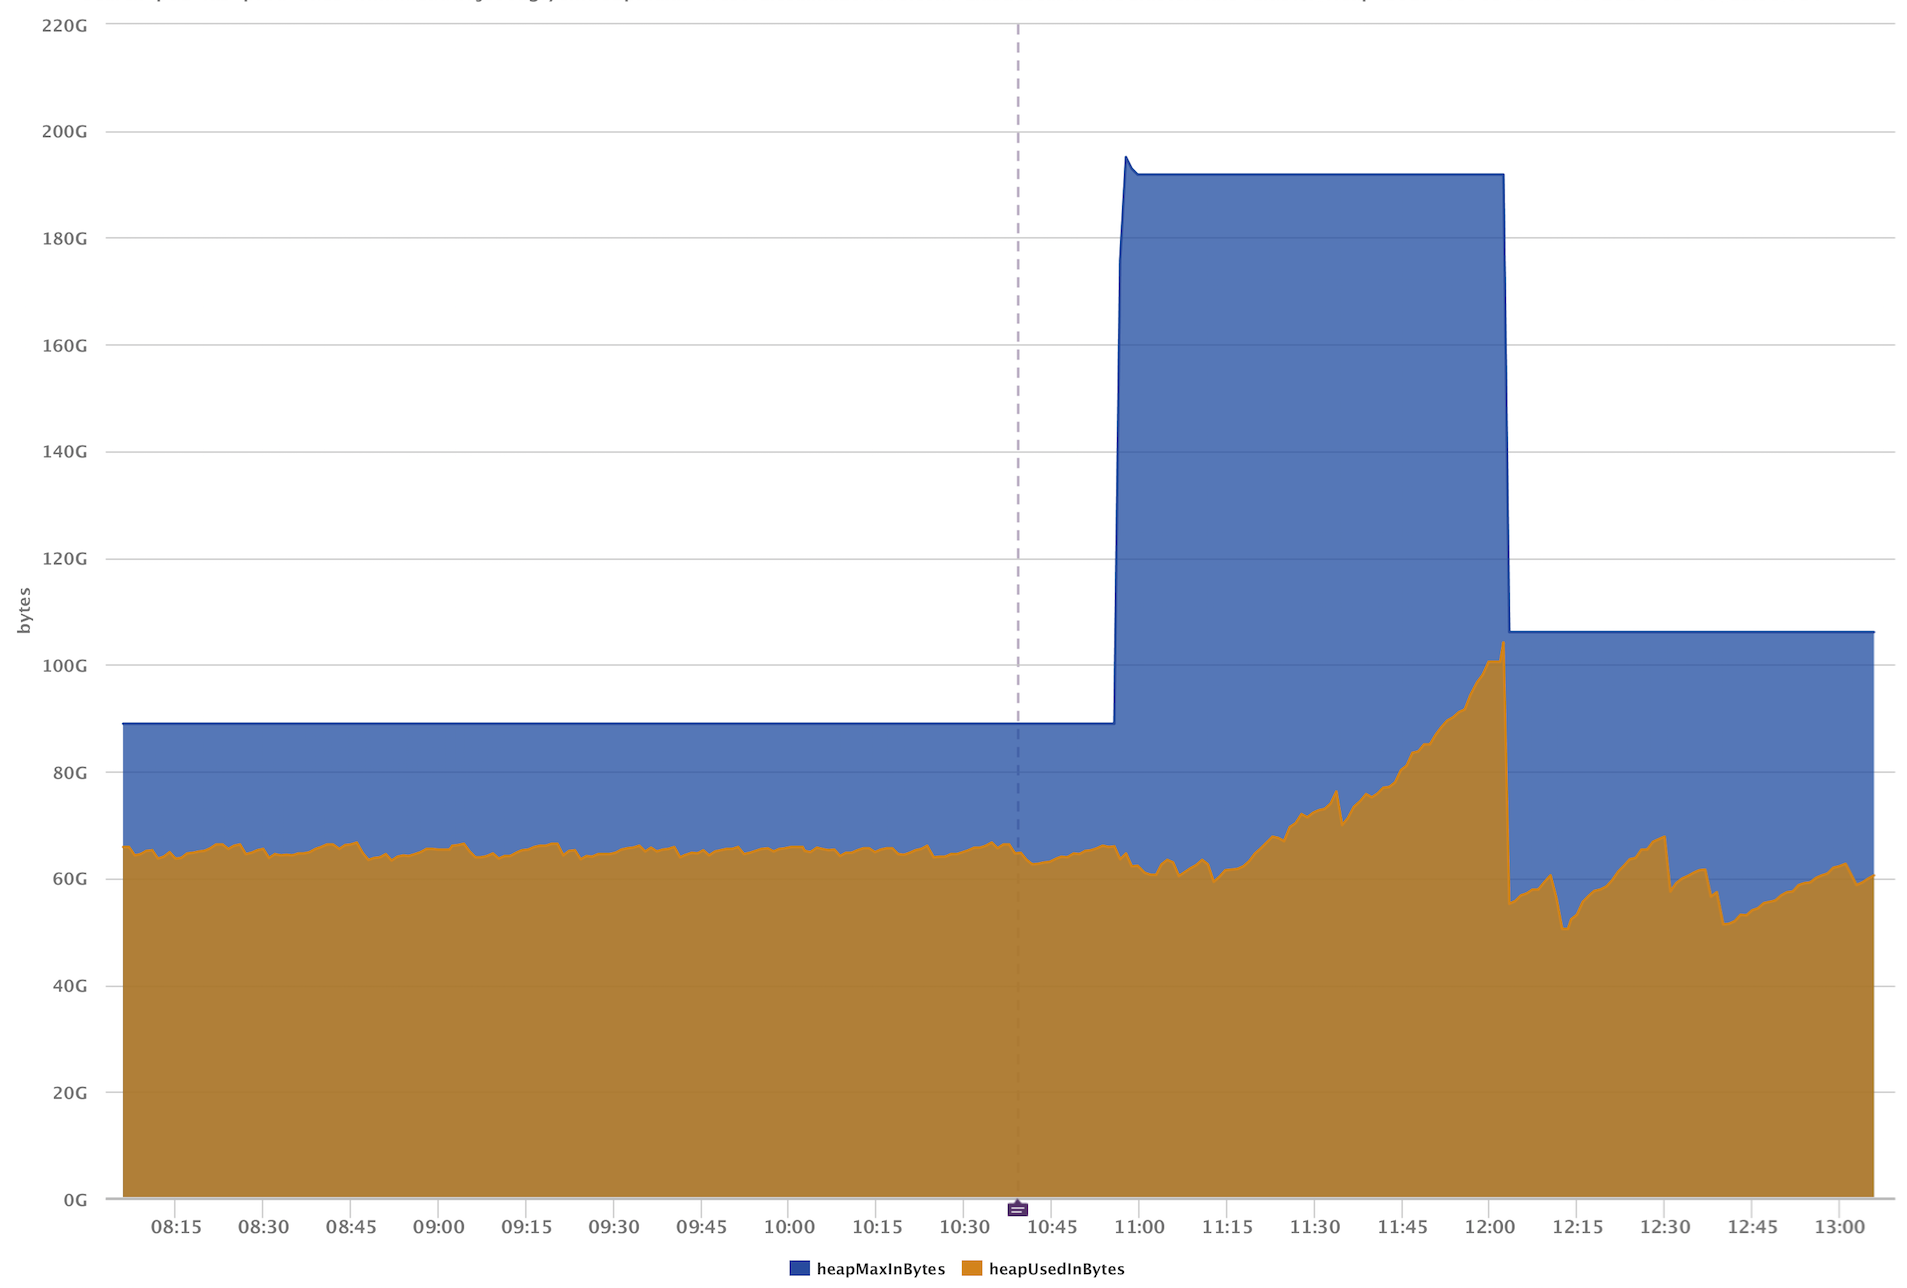
Since we’re using Active Discovery, we can see this process in action. Below is an image visualizing a cluster in the process of being reconfigured. In the first two graphs, we see the heap for the individual nodes and overall cluster heap. In the case of the individual node graph, we can see the exact point where the new nodes join the cluster and shard relocation occurs. And since both sets of nodes are members of the cluster while data is being transferred, we can see an increase in the overall cluster heap.
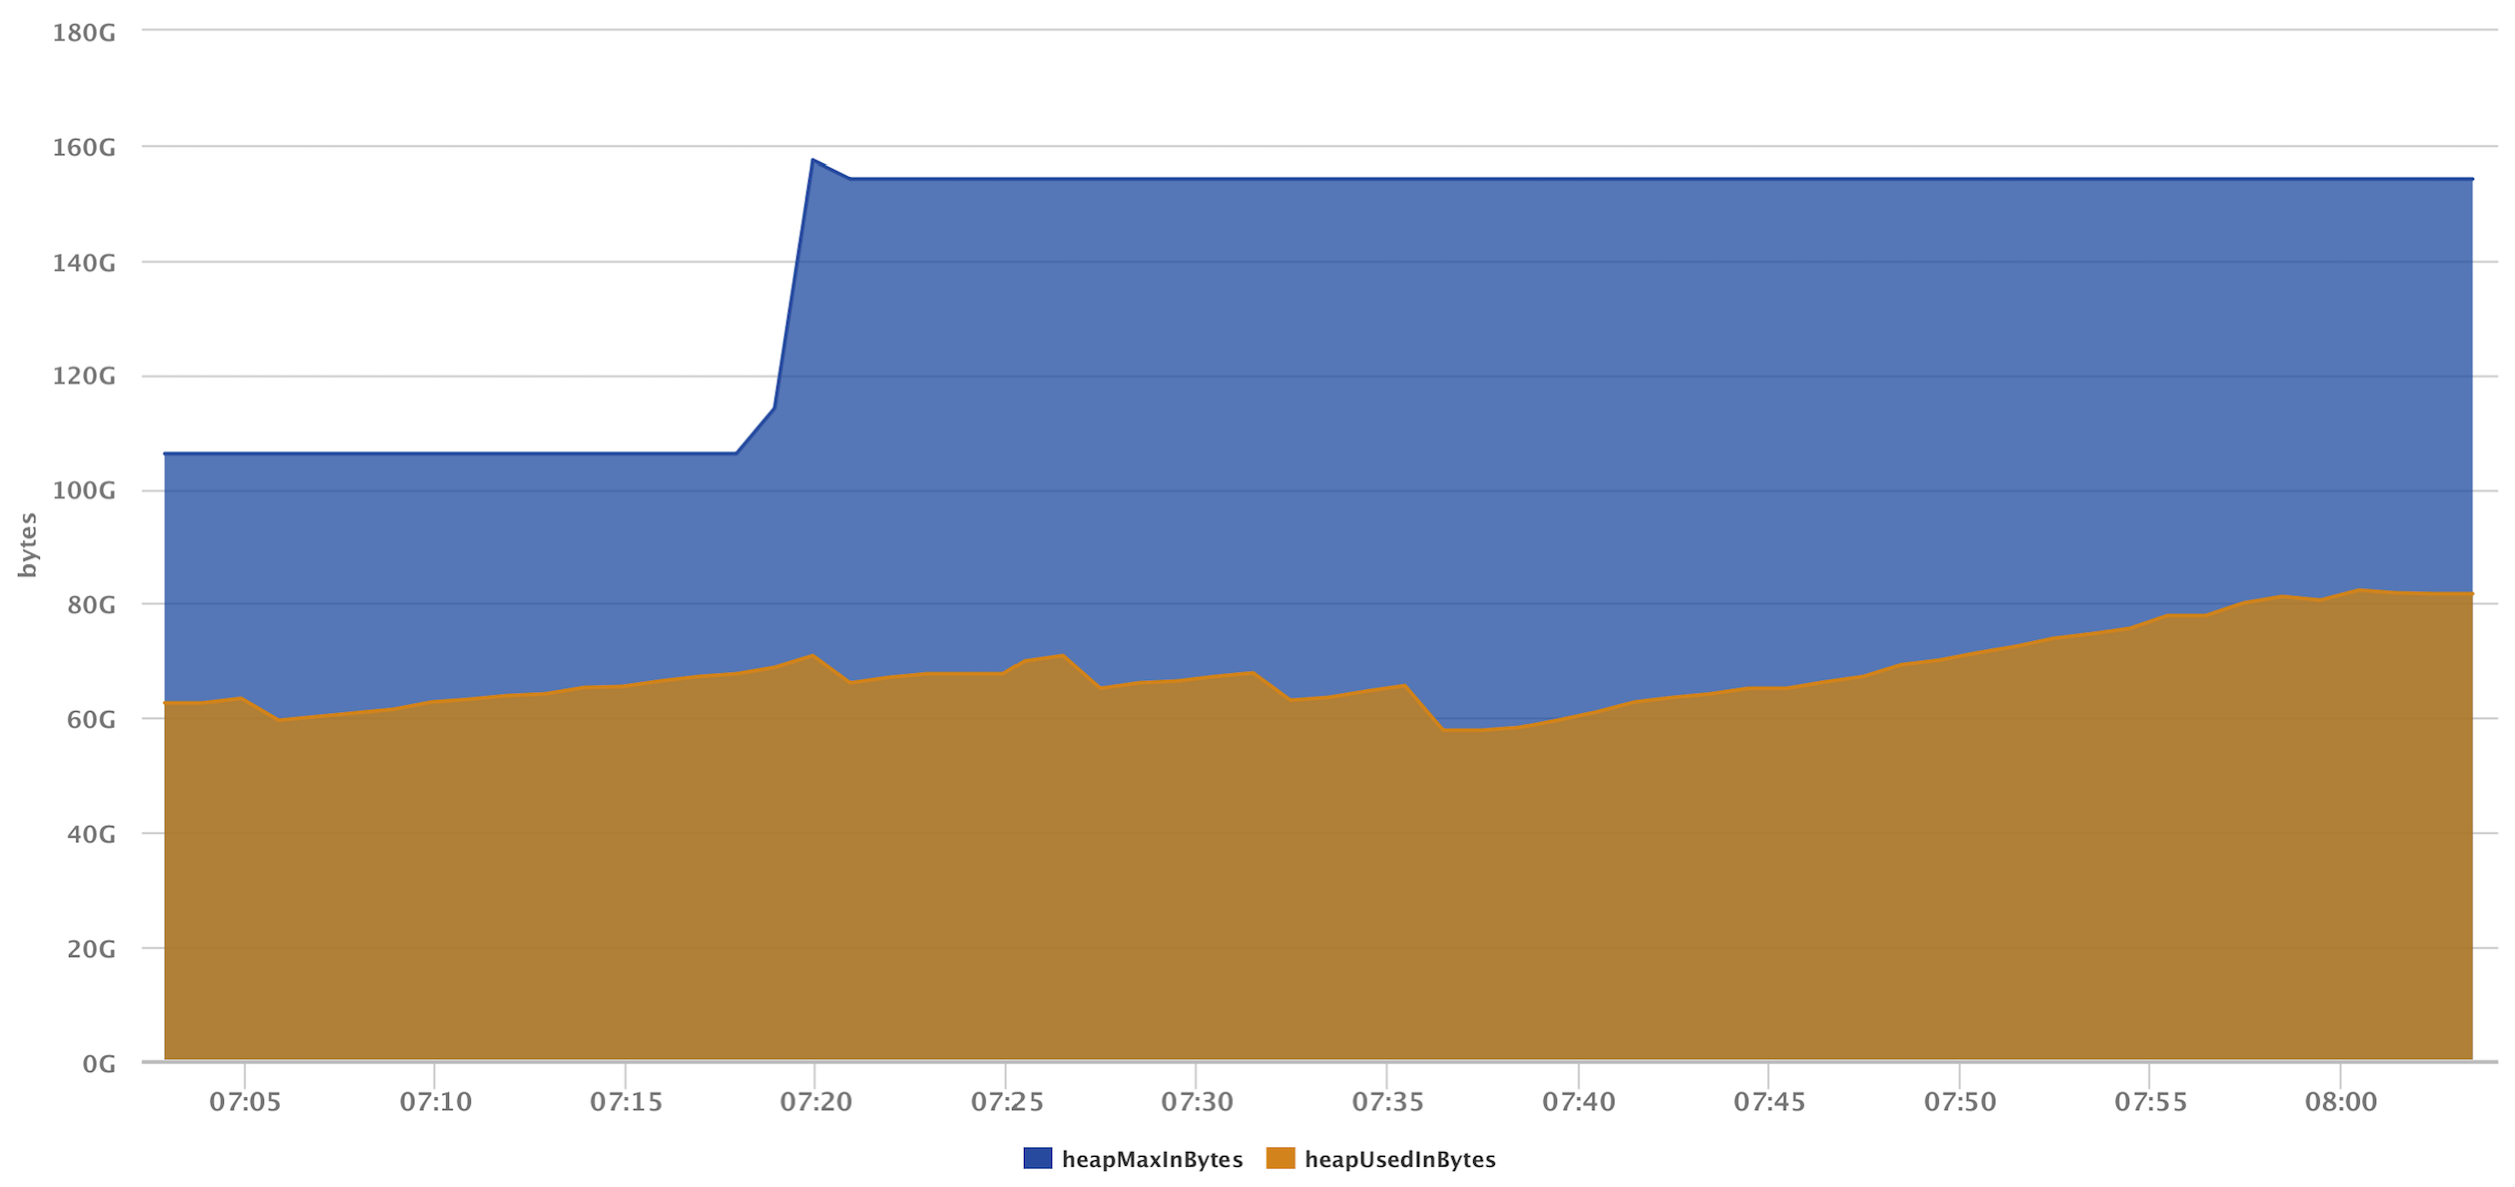
Finally, this image below shows the heap drop when the shard relocation process is complete and the original nodes drop from the cluster.
This is just another example illustrating the power of LogicMonitor Active Discovery, and how it can be utilized to gain critical insight at the application level.

