
Web Performance Metrics
Track the web performance metrics that matter. This guide breaks down 25+ metrics across seven categories with definitions, optimization tips, and real-world impact.


Denton Chikura
The quick download:
Tracking the right web performance metrics matters more than tracking every metric.
-
25+ metrics across seven categories (site speed, user-centric, resource, backend, engagement, technical, and internet performance) give you a full picture of how your website performs and how users experience it.
-
Core Web Vitals (LCP, INP, CLS) remain the benchmark for user-facing performance. They’re most directly tied to user satisfaction and Google search rankings.
-
Tracking metrics in isolation misses the story. When you combine front-end, backend, and internet performance data in a single view, you get actionable intelligence that ties technical performance to revenue.
-
Set goals before selecting metrics. The right KPIs depend on whether you’re optimizing for SEO, conversion rates, availability, or developer experience.
25+ Web Performance Metrics for Optimization Success
Web performance metrics are quantifiable indicators to evaluate and enhance website and web application speed, responsiveness, and overall user experience. They provide critical insights regarding loading times, user interactions, and visual stability. Stakeholders can identify areas for improvement, optimize resource usage, and ensure a smooth, efficient user experience across various devices and network conditions.
Optimized sites lead to positive user experiences, boost engagement and conversions, and enhance brand reputation. This article explores 25+ essential web performance metrics, categorized into seven groups for clarity.
Key web performance metrics summarized
| Metric | Description |
| Site speed metrics | |
| DOM Content Loaded (DCL) | The time it takes for the initial HTML document to completely load and parse without waiting for external resources to finish loading. |
| Time to First Byte (TTFB) | The time it takes for a user’s browser to receive the first byte of page content from the server. |
| Load time | The time it takes for a page to fully load in the browser. |
| Speed Index | A measure of how quickly page contents are visually populated. |
| Server Response Time | The amount of time it takes for a web server to respond to a request from a browser. |
| User-centric metrics | |
| First Paint (FP) | The time the browser takes to render anything visually different from what was on the screen before navigation. |
| First Contentful Paint (FCP) | The time it takes for the browser to render the first piece of content from the DOM. |
| Largest Contentful Paint (LCP) | The time it takes for the largest content element visible in the viewport to be rendered. |
| Interaction to Next Paint (INP) | The time between a user interaction and when the website returns feedback. |
| Cumulative Layout Shift (CLS) | A measure of the largest burst of layout shift scores for every unexpected layout shift that occurs during the entire page lifespan. |
| Time to Interactive (TTI) | The amount of time it takes for the page to become fully interactive. |
| Resource metrics | |
| Page weight | The total web page size, including all assets like images, scripts, and stylesheets. |
| Number of HTTP Requests | The count of separate HTTP requests a web page makes to render fully. |
| Transfer size | The size of the transferred response headers and body from server to browser. |
| Resource Timing | Detailed timing information for each resource loaded by a page. |
| Memory usage | The amount of memory the browser uses to load and run a web page. |
| Backend performance metrics | |
| Requests per Second | The number of requests a server can handle in one second. |
| Error rate | The percentage of total requests that result in errors. |
| User engagement metrics | |
| Bounce rate | The percentage of visitors who navigate away from the site after viewing only one page. |
| Page Views per Session | The average number of pages viewed during a single user session. |
| Average Session Duration | The average time a user spends on your website in a single session. |
| Technical performance metrics | |
| Total Blocking Time (TBT) | The total time between FCP and TTI where the main thread was blocked for long enough to prevent input responsiveness. |
| Long tasks | Any task that takes more than 50 milliseconds to complete can cause lag and unresponsiveness. |
| Internet Performance Monitoring (IPM) Metrics | |
| DNS monitoring | Tracks the speed and reliability of DNS queries to ensure users can quickly access the website. |
| CDN performance | Measures the effectiveness of CDN in distributing website content efficiently across different geographic locations. |
| Network transit latency | Assesses delays in data transmission over the internet, affecting how quickly users receive content from web servers. |
| API performance metrics | Evaluates API responsiveness and reliability for inter-system communication. |
The rest of the article explains these metrics in detail.
Site speed metrics
Site speed metrics evaluate how quickly a webpage loads and becomes usable for visitors. They are critical for understanding server performance, network latency, and overall user experience.
They indicate two aspects—perceived performance and actual performance. For example, if a page loads quickly but a video the site visitor wants to watch loads last, actual performance is good, but perceived performance is poor.
DOM Content Loaded (DCL)
DOM Content Loaded indicates that the initial HTML document has been completely loaded and parsed, without waiting for external resources like stylesheets or images to finish loading. This metric is crucial for understanding when the page structure is ready for JavaScript manipulation.
A fast DCL enables faster interactivity and improves perceived performance. Optimizing DCL requires minimizing render-blocking resources and optimizing the script loading order.
Time to First Byte (TTFB)
Time to First Byte measures how long a user’s browser takes to receive the web server’s first byte of page content. It indicates server responsiveness and network latency. A low TTFB means a fast initial server response, which is essential for overall page load speed.
TTFB is affected by factors like server configuration, network conditions, and DNS lookup time. Optimizing TTFB improves perceived page load times and user experience.
Load time
Load time measures the duration from the start of page load until all resources on the page, including images, scripts, and stylesheets, have finished loading. It provides a comprehensive view of the total time it takes for a page to be fully rendered and functional.
However, there are cases when load time might not accurately reflect when a page becomes usable for the visitor. For example, a page may take several seconds to fully load all resources, but the primary content (such as text or initial images) could be visible and interactive much earlier. This is common with progressive web apps, where key elements are prioritized for loading before the rest of the content.
Another instance is when a website uses lazy loading, where images and other media load only as the user scrolls down. It reduces initial load times but still makes the full load time seem longer. In such scenarios, even though the complete load time is high, the user can interact with the page sooner, increasing perceived speed.
Load time is essential for understanding the overall performance and identifying bottlenecks in resource loading. Optimizing load time requires techniques like lazy loading, resource compression, and minimizing HTTP requests.
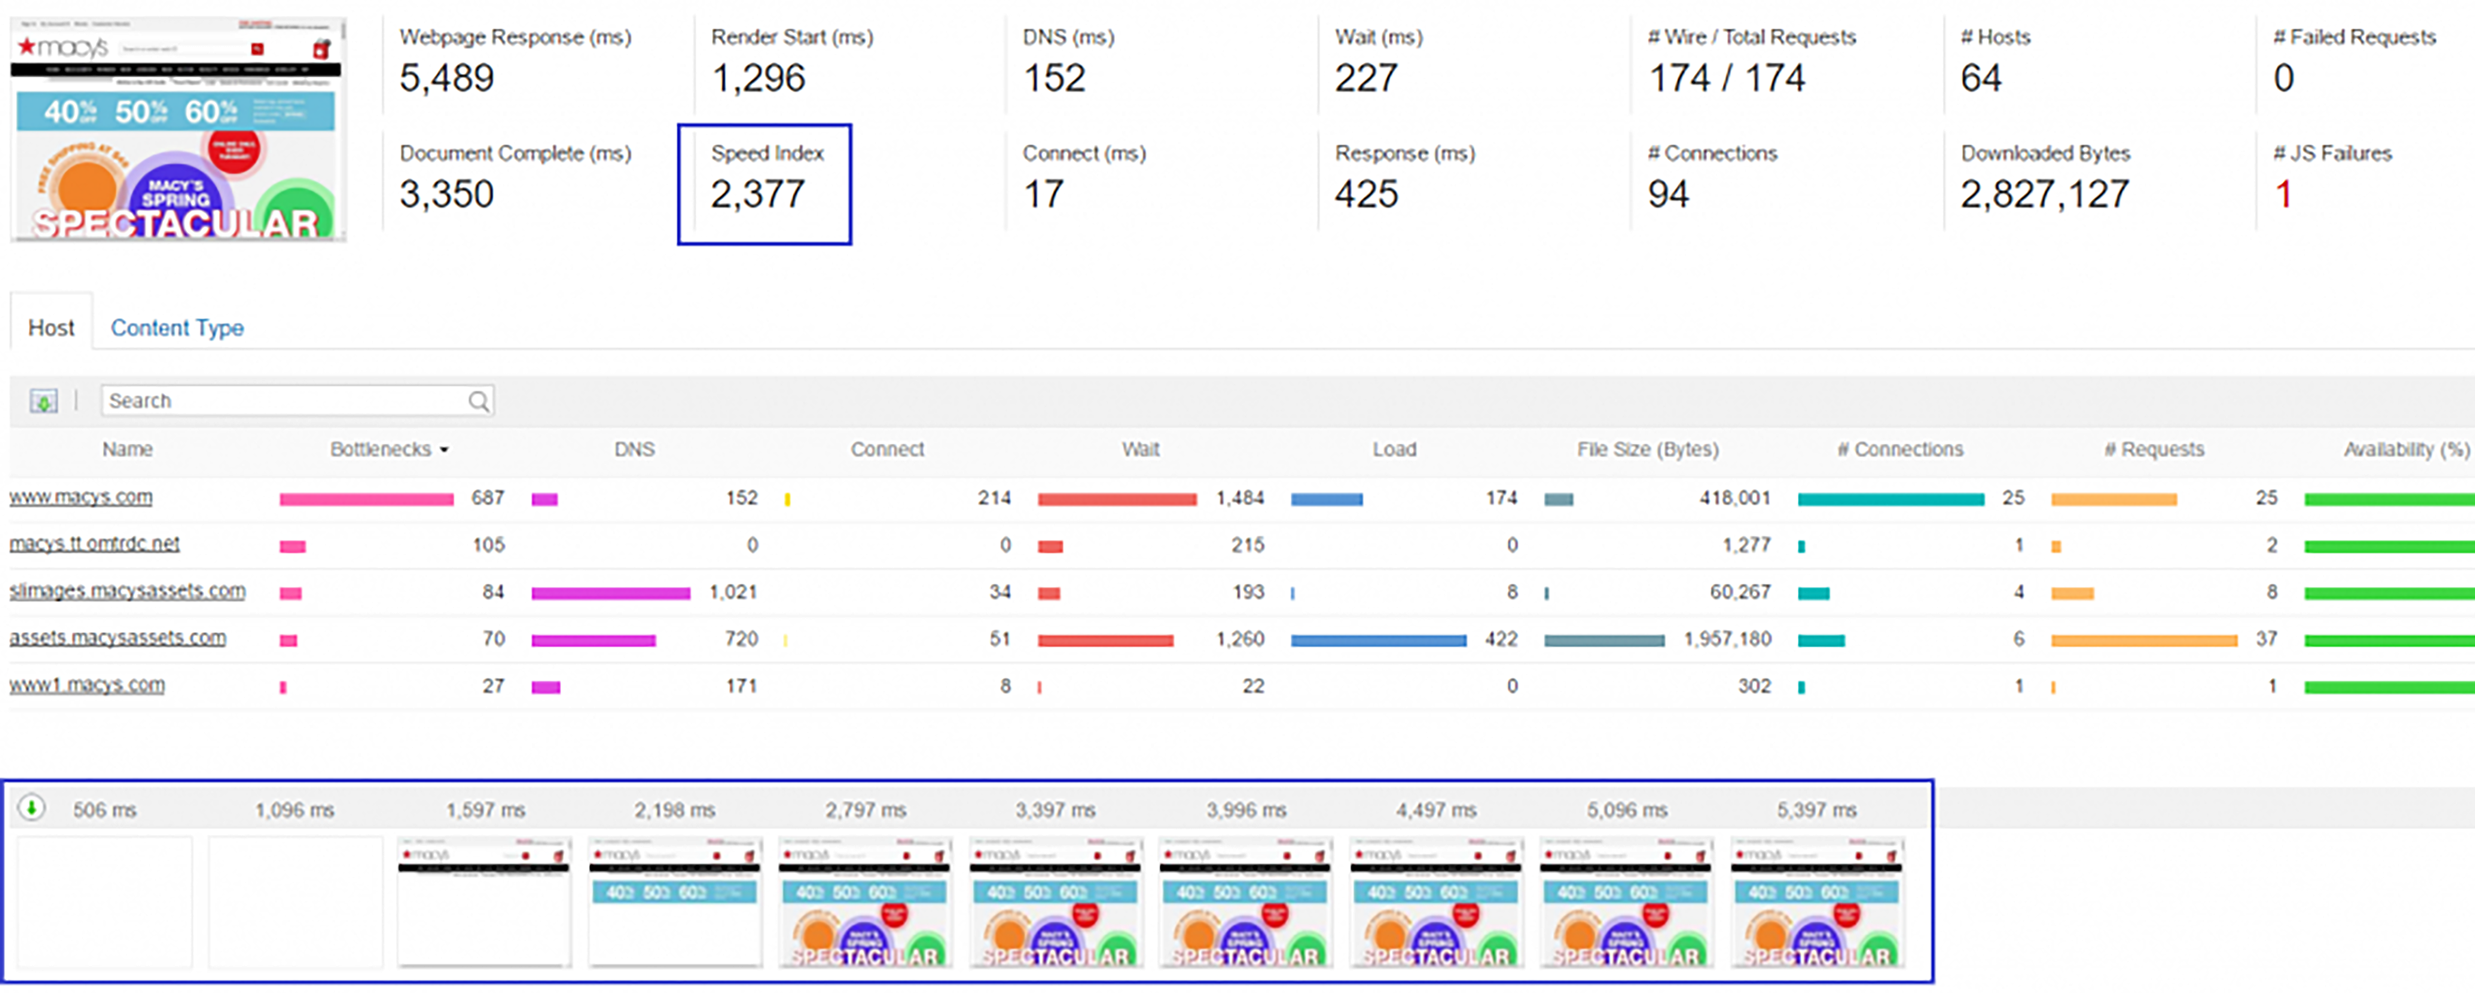
Speed Index
Speed Index measures how quickly the visible parts of a web page are populated. It calculates the average time at which visible page components are displayed. A lower score indicates a faster visual rendering of the page content. This metric helps understand the perceived loading speed from a user’s perspective.
Improving the Speed Index requires you to:
- Prioritize critical rendering paths.
- Optimize above-the-fold content (webpage components you can see without scrolling)
- Reduce render-blocking resources
Server Response Time
Server Response Time measures how long it takes for a web server to respond to a browser request. It is crucial to understand backend performance and its impact on page load times. Factors influencing this metric include server hardware, software configuration, application logic, and database queries. Optimizing server response time requires improving server-side caching, optimizing database queries, and upgrading server infrastructure.
User-centric metrics
User-centric metrics focus on how real users experience website performance. They indicate the website’s responsiveness to ongoing user interactions. These metrics help gauge user satisfaction and engagement.
First Paint (FP)
First Paint is when the browser renders anything that is visually different from what was on the screen before the navigation. This could be a change in background color or the first elements of the page layout. FP signifies the start of the page rendering process and indicates how quickly users get the first visual feedback that the page is loading. It provides a sense of responsiveness even though it doesn’t necessarily mean helpful content is displayed. Improving FP enhances perceived performance and user satisfaction.
First Contentful Paint (FCP)
First Contentful Paint measures the time from when the page starts loading to when any part of the page’s content is rendered on the screen. This could be text, images, SVGs, or non-white canvas elements. It indicates when users first see something meaningful on the page for feedback that the page is loading.
A fast FCP contributes to a positive user experience by reducing perceived load times. Improving FCP involves optimizing the critical rendering path, reducing server response times, and minimizing render-blocking resources.
Largest Contentful Paint (LCP)
Largest Contentful Paint measures the render time of the largest image or text block visible within the viewport relative to when the page first started loading. It marks the point in the page load timeline when the page’s main content has likely loaded. A fast LCP helps reassure the user that the page is helpful.
Improving LCP requires optimizing the loading of key page elements, prioritizing above-the-fold content, and ensuring efficient delivery of critical resources.
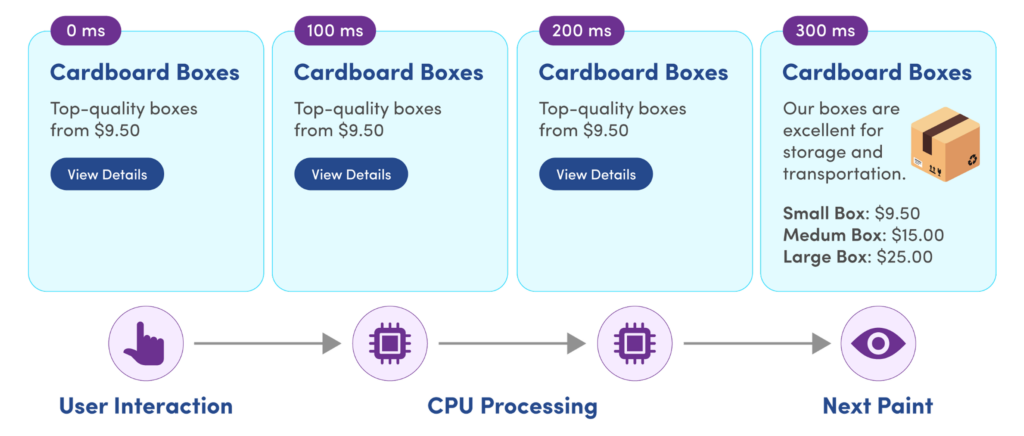
Interaction to Next Paint (INP)
Interaction to Next Paint measures the time elapsed between a user’s interaction, such as a click or tap, and the subsequent visual update on the screen. This metric provides insights into how quickly a website responds to user actions.
A lower INP indicates that the website is highly responsive, allowing users to see the results of their actions almost immediately. Developers and website owners can identify performance bottlenecks and optimize their sites to ensure users experience smooth interactions for satisfaction and engagement.
Cumulative Layout Shift (CLS)
Cumulative Layout Shift measures the sum total of all individual layout shift scores for every unexpected layout shift during the entire page lifespan. Layout Shift is the unexpected movement of visible elements on a web page as it loads, such as images, buttons, or text shifting position without user interaction. A layout shift occurs when a visible element changes its position from one rendered frame to the next.
CLS quantifies how often users experience unexpected layout shifts. A low CLS ensures the page is delightful. Improving CLS involves strategies like:
- Specifying size attributes for images and videos
- Avoiding inserting content above existing content, and
- Using transform animations instead of animations of properties that trigger layout changes.
A transform animation uses transform: translateX(100px) to slide an element across the screen. This affects the element’s position but doesn’t cause other elements around it to change.
Animation of properties uses left: 100px to move the same element. This changes the element’s position but also requires the browser to recalculate the layout around it. It impacts other elements and causes a heavier performance load.
Time to Interactive (TTI)
Time to Interactive measures the time from when the page starts loading to when it is visually rendered, its initial scripts (if any) have loaded, and it can reliably respond to user input quickly. A fast TTI ensures that users can interact with the page soon after it appears loaded. Improving TTI involves:
- Reducing JavaScript execution time
- Deferring or removing non-critical JavaScript
- Minimizing main thread work.
Resource metrics
Resource metrics analyze the various components that contribute to webpage loading and performance. Use them to identify optimization opportunities, such as reducing file sizes or minimizing requests to improve loading times.
Page weight
Page weight refers to the total size of a web page, including all HTML, CSS, JavaScript, images, and other resources that must be downloaded. It indicates the overall network load and the time it might take to fully download a page, especially on slower connections. A lower page weight generally leads to faster load times and better performance, particularly on mobile devices. Optimizing page weight metric involves compressing images, minifying code, leveraging browser caching, and removing unnecessary resources.
Number of HTTP requests
The Number of HTTP requests metric counts the number of separate requests a web page makes to fully load all its resources. Each request adds to the overall load time, as the browser needs to set up connections and wait for responses. Reducing the number of requests can significantly improve page load times, especially on congested networks. Strategies to optimize this metric include:
- Concatenating files (combining multiple CSS or JavaScript files).
- Using CSS sprites for images.
- Implementing lazy loading for non-critical resources.
Transfer size
Transfer size measures the data transferred over the network to load a web page, including headers and compressed file sizes. This metric is essential for understanding a website’s real-world performance, especially on mobile networks or areas with limited bandwidth. A smaller transfer size generally leads to faster load times and lower user data costs. Optimizing transfer size metric requires compressing resources, leveraging browser caching, and using efficient data formats.
Resource timing
Resource timing provides detailed timing information for each resource loaded by a page. This includes metrics such as redirect time, DNS lookup time, TCP connection time, SSL negotiation time, request send time, waiting time (TTFB), and content download time. Resource Timing is crucial for identifying bottlenecks in resource loading and understanding the performance of individual page components. This detailed breakdown allows developers to pinpoint specific areas for optimization, such as improving server response times or optimizing resource delivery.
Memory usage
Memory usage measures how much memory a web page consumes in the browser. This metric is essential for understanding the overall efficiency of the website, especially on devices with limited resources. High memory usage leads to slower performance, crashes, and poor user experience, particularly on mobile devices. Optimizing memory usage often involves efficient JavaScript coding practices, avoiding memory leaks, and managing DOM elements effectively.
Backend performance metrics
Backend performance metrics assess the efficiency of server-side processes that support web applications. Monitoring them ensures server reliability and responsiveness under varying loads.
Requests per second
Requests per second (RPS) measures the requests a server can handle in one second. It indicates server capacity and performance under load. A higher RPS means the server can handle more traffic efficiently. However, increasing the number of requests can strain server resources, leading to slower responses and a higher likelihood of errors. Maintaining the balance between response time and error rate ensures the server can handle traffic efficiently without compromising speed or stability. Optimizing RPS often involves improving server hardware, optimizing application code, implementing caching strategies, and load balancing across multiple servers.
Error rate
Error rate measures the percentage of requests that result in errors (such as HTTP 500 status codes) relative to the total number of requests. This metric is vital for understanding the reliability and stability of a web application. A low error rate indicates a more stable and reliable system. High error rates lead to poor user experience and lost business. Improving error rate often involves robust error handling, thorough testing, monitoring, and quick resolution.
User engagement metrics
User engagement metrics measure how effectively a website retains visitors and encourages interaction. They provide insights into user behavior and content effectiveness, helping businesses refine their strategies to enhance engagement.
Bounce rate
Bounce rate measures the percentage of visitors who leave the site after viewing only one page. This metric is crucial for understanding user engagement and the effectiveness of landing pages. A high bounce rate indicates issues with content relevance, user experience, or page load times. However, a high bounce rate might be expected for certain types of sites (such as blogs). Improving the bounce rate involves enhancing content quality, improving site navigation, optimizing page load times, and ensuring the site content meets user expectations.
Page views per session
Page Views per Session measures the average number of pages a user views during a single visit to the website. This metric is essential for understanding user engagement and the effectiveness of site navigation. A higher number of page views per session generally indicates that users find the content engaging and explore the site more deeply.
Improving this metric involves creating compelling content, optimizing site navigation, implementing effective internal linking strategies, and ensuring fast page load times across the site.
Average session duration
Average session duration measures the average user session length on a website. This metric is crucial for understanding how engaging and valuable users find your content. A longer average session duration generally indicates that users find the content relevant and spend time exploring the site. However, the ideal session duration varies by website type.
Improving average session duration requires creating high-quality, relevant content, optimizing site navigation, and ensuring a smooth user experience across all pages.
Technical performance metrics
Technical performance metrics evaluate specific aspects of website performance that can affect user experience. They help developers identify performance bottlenecks and optimize code for better user experiences.
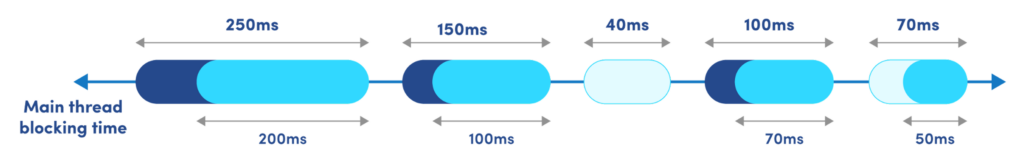
Total Blocking Time (TBT)
Total Blocking Time measures the total time between First Contentful Paint (FCP) and Time to Interactive (TTI) during which the main thread was blocked long enough to prevent input responsiveness. It is crucial to understand a page’s interactivity and responsiveness during load. A high TBT negatively impacts user experience, as the page appears unresponsive. Improving TBT involves,
- Optimizing JavaScript execution
- Breaking up long tasks
- Minimizing main thread work during page load.
The following figure shows the time the main thread is blocked by long tasks.
Long Tasks
Long Tasks are any tasks that take more than 50 milliseconds to execute on the main thread. This metric is important for understanding potential causes of unresponsiveness in web applications. Identifying and optimizing long tasks significantly improves a web page’s responsiveness and interactivity. Strategies for improving this metric include code splitting, using web workers for heavy computations, and optimizing JavaScript execution.
Internet Performance Monitoring (IPM) Metrics
The types of monitoring in this section fall under what’s collectively known as Internet Performance Monitoring (IPM), which focuses on observing the performance of third-party services that make up the Internet Stack.
DNS monitoring
DNS monitoring is a critical process that involves tracking and analyzing the availability, performance, and security of DNS infrastructure. You monitor zone transfers, verify DNS records, and analyze query patterns to detect potential attacks such as DNS floods or DNS spoofing. Organizations ensure the reliability of their online presence, optimize performance, and maintain security by identifying issues before they impact users or business operations.
DNS monitoring also includes tracking response times from authoritative nameservers, validating DNSSEC signatures, and monitoring the propagation of DNS changes across the internet.
CDN performance
CDN performance metrics assess the efficiency and effectiveness of Content Delivery Networks in distributing web content. These metrics include response times, cache hit ratios, and geographic distribution of content delivery. Monitoring CDN performance helps organizations optimize content delivery, reduce latency, and improve user experience.
Additionally, CDN performance monitoring involves analyzing throughput, origin shield effectiveness, and the performance of different content types (e.g., static assets, dynamic content, streaming media). It also includes monitoring CDN health, load balancing efficiency, and the impact of CDN configurations on overall website performance.
By closely tracking these metrics, organizations can make data-driven decisions to optimize their CDN strategy, enhance global content delivery, and deliver a fast, reliable user experience across diverse geographic regions and network conditions.
Network transit latency
Network transit latency metrics measure the time it takes for data to travel between different points in a network. This includes factors like routing efficiency, network congestion, and physical distance. Monitoring network transit latency is needed for understanding and optimizing the overall performance of digital services, as it directly impacts user experience and application responsiveness across various geographic locations.
Moreover, network transit latency monitoring involves analyzing packet loss, jitter, and round-trip times across different network paths and providers. It helps identify bottlenecks, inefficient routing, and potential network issues affecting service quality.
The Border Gateway Protocol (BGP), used between Internet Service Providers (ISP) to hand off traffic, can also cause delays or security breaches and should be regularly monitored. Organizations can proactively address network performance issues by continuously monitoring these metrics, optimizing routing decisions, and ensuring consistent service quality.
API performance metrics
API performance metrics evaluate the speed, reliability, and efficiency of Application Programming Interfaces. These metrics typically include response times, error rates, and throughput. Monitoring API performance is essential for ensuring smooth integration across software systems, maintaining service-level agreements, and identifying bottlenecks or issues that could affect the functionality of applications that rely on these APIs.
API performance monitoring tracks metrics such as request volume, payload sizes, and API availability across different endpoints and methods. It also involves analyzing API usage patterns, identifying frequently used endpoints, and monitoring the effectiveness of rate limiting and throttling. Advanced API performance monitoring may include synthetic testing to simulate user interactions and real-user monitoring to capture actual user experiences.
Impact of web performance metrics on business goals
By optimizing core metrics, businesses can significantly improve user satisfaction, which has a ripple effect on key business goals. Enhanced web performance leads to lower bounce rates, increased time spent on site, and more conversions, whether product purchases, form submissions, or content consumption.
The impact of web performance optimization is not limited to improved user experience. Faster websites have lower operational costs and require fewer server resources and bandwidth to deliver content efficiently. By investing in performance optimization, businesses can reduce infrastructure costs and enhance scalability, ensuring their websites handle higher traffic volumes without compromising speed or usability.
Let’s look at some real-world examples.
Pinterest implemented various optimizations across the front-end, network, and backend to improve metrics like overall page load time and user-perceived wait time. These improvements led to a 40% decrease in user wait time, a 15% increase in SEO traffic, and a 15% increase in signup conversion rate. The multiplicative effect of increased traffic and conversion rate made this initiative Pinterest’s biggest user acquisition win in 2016. It significantly boosted web and app signups.
The BBC found that for every additional second a page takes to load, 10% of users leave. They shifted focus to maintaining speed under high load, even at the cost of temporarily disabling some features. They implemented strategies such as caching and CDNs, optimizing page generation, and leveraging client-side JavaScript to increase user retention. Their approach effectively handled massive traffic spikes during major events like the Olympics. They could serve over 100 million devices during peak times.
LM Internet Performance Monitoring, powered by Catchpoint, enables you to monitor all the metrics listed in this guide and view them alongside your business metrics to gain a complete picture of your optimization requirements. You can collect all the metrics in a centralized system and analyze them visually to quickly identify the factors slowing down your website and what needs to be done to fix it.
The bottom line
Web performance metrics are essential for achieving business goals such as higher conversion rates, lower bounce rates, and increased user loyalty. They also significantly impact search engine rankings, as search engines like Google increasingly prioritize fast, responsive websites in their algorithms. Optimizing these metrics enhances the overall user experience, drives organic traffic, and improves visibility in search engine results.
The key is to track these metrics together, as a connected system. A slow TTFB might point to a server-side issue, while a high CLS could mean your front-end layout needs attention. When you combine site speed, user-centric, resource, backend, engagement, technical, and IPM metrics into a single view, you get actionable intelligence that connects technical performance to business outcomes.
LogicMonitor’s platform brings all of these layers together, from real user monitoring and synthetic testing to infrastructure observability and internet performance monitoring, giving your team user-to-code visibility across the full digital experience.
CHAPTERS
NEWSLETTER
Subscribe to our newsletter
Get the latest blogs, whitepapers, eGuides, and more straight into your inbox.
SHARE
See how your web performance metrics connect to the bigger picture.
LogicMonitor brings real user monitoring, synthetic testing, and infrastructure observability into a single platform, so your team can trace performance issues from the user’s browser to the underlying infrastructure.
FAQs
What are web performance metrics?
Web performance metrics are quantifiable measurements that assess how fast, responsive, and stable a website is. They cover everything from loading speed and user interactivity to backend response times and internet infrastructure performance. Used together, they help teams identify and fix performance problems.
What are the most important web performance metrics to track?
The essential starting point is Core Web Vitals (LCP, INP, CLS). Beyond those, key metrics include Time to First Byte (TTFB), total page load time, error rate, and bounce rate. The most important metrics depend on your specific goals, whether that’s SEO, conversions, or reliability.
How do backend metrics affect web performance?
Backend metrics like TTFB and server response time directly influence how quickly a page starts loading. A slow database query, an overloaded server, or a poorly configured CDN can add seconds to your TTFB and degrade Core Web Vitals even if your front-end code is well optimized.
What are internet performance metrics and why do they matter?
Internet performance metrics measure external components in the path between your server and your users, including DNS resolution time, CDN cache hit rates, BGP routing stability, and third-party script load times. These factors are outside your infrastructure but can significantly affect end-user experience. That’s why Internet Performance Monitoring (IPM), including DNS monitoring, CDN performance, and network transit latency, are essential parts of a comprehensive web performance strategy.

By Denton Chikura
Technical Writer

Denton Chikura is a technical writer and longtime observability advocate focused on helping site reliability engineers and engineering teams discover the tools and capabilities that strengthen internet resilience. He works at the intersection of monitoring, performance, and infrastructure to make complex systems more understandable and usable, bridging the gap between deep technical detail and real‑world operations. His goal is to help teams build faster, detect issues earlier, and recover smarter, ultimately making the internet a better, more reliable place for everyone.
Disclaimer: The views expressed on this blog are those of the author and do not necessarily reflect the views of LogicMonitor or its affiliates.
© LogicMonitor 2026 | All rights reserved. | All trademarks, trade names, service marks, and logos referenced herein belong to their respective companies.
