Overview
The Remote Session feature in LogicMonitor provides a secure way to remotely access and operate on devices from within your LogicMonitor portal. Remote sessions are enabled via the use of Apache Guacamole, a clientless remote desktop gateway that requires no plugins or client software.
The remote session protocols available for establishing a communication stream between your account and the Collector monitoring your device are RDP, SSH, and HTTP/S. The protocol must be configured for the device endpoint in order to be able to establish a remote session connection. Remote sessions take place through a secure SSL connection supported by the protocol (HTTP/S you have the option to use SSL or HTTPS or just HTTP).
Note: The maximum duration for a remote session is 60 minutes. After 60 minutes, whether you are currently interacting with the remote device or not, the session will time out.
Initiating a Remote Session
To initiate a remote session:
- From the Resources tree, select the device you wish to access and, from its detail view, click the “Manage” arrow and select “Remote Session” and the desired protocol from the subsequent dropdown menus.
Any protocol can be used if properly configured on the device, but typically RDP is used for Windows devices and SSH is for non-Windows/Linux devices.
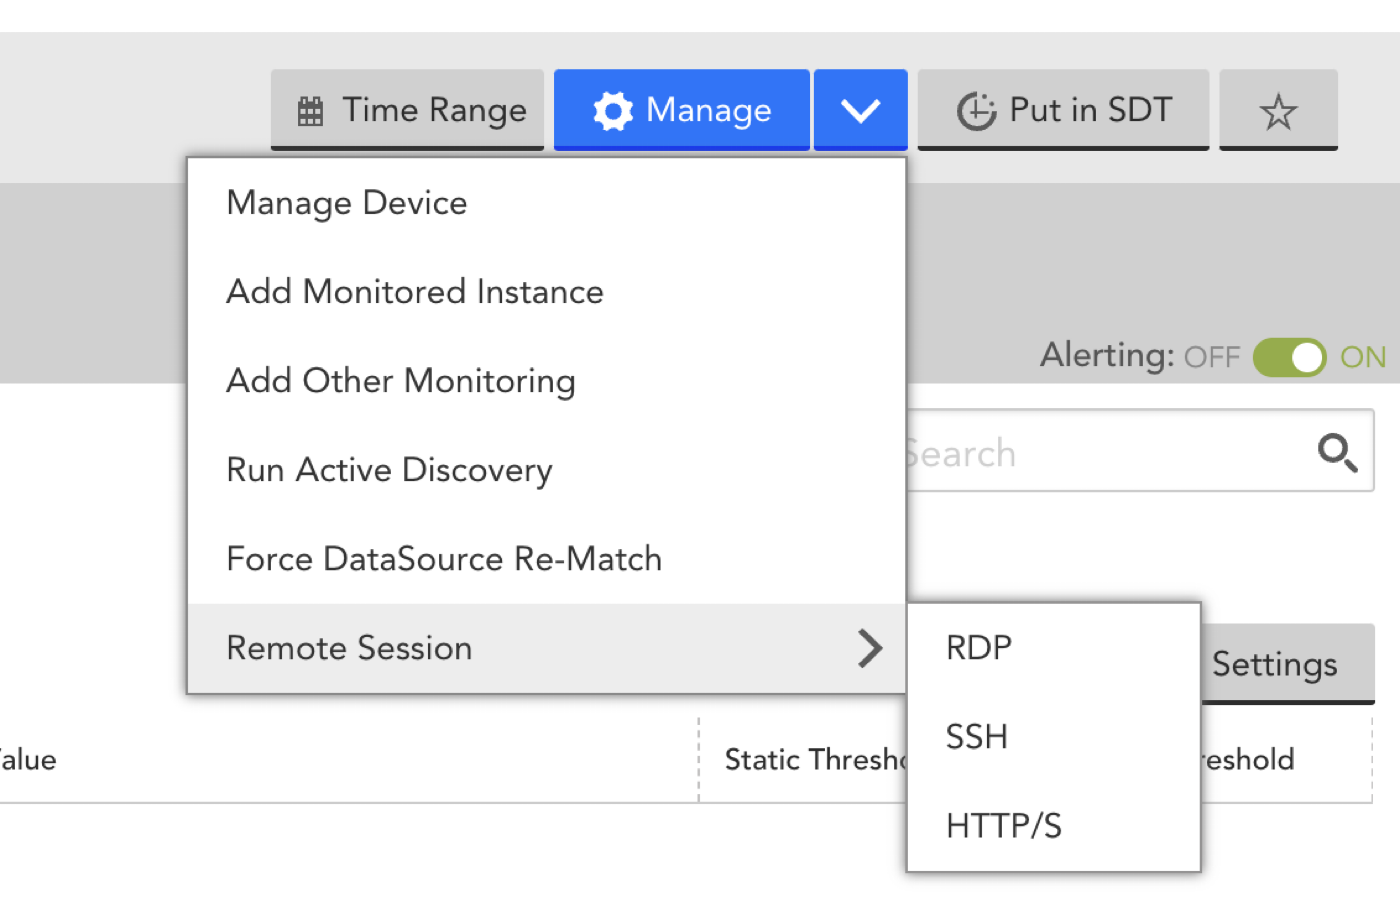
Note: Collector version 28.600 or a higher numbered version is required to use HTTP/S. If a lower numbered Collector version is in use, these protocol selections will be disabled and a message to that effect will be displayed upon mouse-over. - A new browser window opens, prompting you to enter the account and password for your device.
Note: You must log into the device within three minutes of initiating the remote session or the session will time out.
Note: LogicMonitor does NOT currently support SSH key authentication or Network Level Authentication on Windows.
- Once the remote session is initiated, select Control+Alt+Shift to open the Apache Guacamole clipboard for copy-and-paste functionality or directly input new command lines.

Note: Some platforms are not supported by the Apache Guacamole clipboard copy-and-paste feature, as discussed in the Apache Guacamole Frequently Asked Questions.
Remote Session Device Properties
LogicMonitor supports several Remote Session protocol properties that you can use to override default connection behavior.
| Remote Session Protocol | Property Name | Default Value | Req’d? | Description |
| SSH | remotesession.ssh.port | 22 | no | Populate to override default SSH port value. |
| RDP | remotesession.rdp.port | 3389 | no | Populate to override default RDP port value. |
| HTTP/S | remotesession.http.ssl.enable | true | no | SSL is enabled by default. Enter false if you are using HTTP instead of HTTPS. |
| remotesession.http.port | 443 (for HTTPS by default); 80 (for HTTP if ssl.enable is false) | no | Populate to override the default port for the HTTP/S connection. Defaults are 443 for HTTPS and 80 for HTTP. | |
| remotesession.http.rootpath | / | no | Specify the HTTP/S path. By default the root path is used. | |
| remotesession.http.proxy.version | v1 | no | Supported values: v1 and v2. Enables you to switch between proxy versions. If you specify invalid version (for example, v5) then by default v1 is selected.
Note: When you set the property, remove old cookies from the browser for remote-session URLs and then create the remote session. | |
| RDP and SSH (deprecated) | remotesession.port=[portnumber] | Values set for SSH or RDP ports using one of the properties listed above will override the value set for this property | no | This property is deprecated, but still supported. It carries the port number required to RDP/SSH into the device (typically only used if a non-standard port is required). If you are setting up Remote Session for the first time, use the above SSH and RDP port properties. |
| remotesession.protocol=[RDP or SSH] | n/a | no | Previously used to indicate the protocol (RDP or SSH) for the device (rather than allowing LogicMonitor to automatically determine protocol based on device type), but with the addition of new protocols and the ability to manually select preferred protocol upon remote session initiation, this property is fully deprecated and no longer used. |
For more information on adding/updating properties for a resource, see Resource and Instance Properties.
Access Controls
Remote sessions do not change the underlying authentication and access control of the device operating system, but they do allow access to the device in situations where it may not otherwise be possible. For this reason, LogicMonitor has several controls in place that serve to limit access to the Remote Session feature on a global or more granular basis:
- Account-wide control. Remote Session can be disabled on an account-wide basis from LogicMonitor’s account settings. For more information, see About the Account Information Page.
- Per-Collector control. Remote Session can be disabled on a per-Collector basis, effectively disabling the feature for all devices assigned to that Collector. This is accomplished by manually updating the remotesession.disable setting found in the Collector’s configuration file to “true”. For more information on editing a Collector’s configurations, see Editing the Collector Config Files.
- Role-based access control. Remote Session is defined as a separate user privilege. As discussed in Roles, a role can be given the ability to initiate remote sessions on all devices, those in a specific group, or no devices at all.
Requirements and Limitations
Please note the following requirements/limitations:
- The protocol used to initiate a session must be enabled on the device to which you are attempting to connect.
- The remote session connection will not work if “RDP Security Layer” is enabled for Window Server 2008’s Remote Desktop.
- If working with non-Windows or Linux devices (e.g. Cisco controllers), you will most likely use SSH to establish communication. However, you may need to manually do one of the following to ensure a proper connection:
- Ensure default SSH configurations are in place
- Enable username/password access for SSH on the device
- Make sure that the IPs used by the relay server are allowed (added to allow list). See LogicMonitor Public IP Addresses and DNS Names for a complete list.
- HTTP/S protocol limitations:
- Domain/device redirects. Redirects to another domain/device (e.g.
https://targetdevice.com/login.jsp redirects to
https://anotherdevice.com/login.jsp) are not supported. - Port redirects. Redirects to another port (e.g. http://targetdevice.com/index.jsp redirects to https://targetdevice.com/index.jsp, where the port changes from 80 to 443). For port redirects, use the properties listed in the Remote Session Device Properties section of this support article to specify the HTTP/S port, use of SSL, and path.
- SSO login redirects. This affects vCenter remote session logins. In addition, if the page is requesting resources out of target device domain and is not accessible from a public browser (e.g. the webpage is requesting another device’s CSS resources which are not accessible from the browser directly), those resources will not be available via the remote session.
- Link parsing in the HTTP body request. During a remote session, the HTTP/S protocol uses a RelayServer which works as a reverse proxy to return a page when the HTTP/S connection is initiated. It only acts upon HTTP requests and responses in the header in order to determine that the link is valid and for the same host. This affects some devices, such as Cisco UC devices.
- If the HTTP RemoteSession fails then add remotesession.http.proxy.version property and set its value as v2.
Note: When you set the property, remove old cookies from the browser for remote-session URLs and then create the remote session.
- Domain/device redirects. Redirects to another domain/device (e.g.
Note: While not possible with some redirects, if they are known the path can be added as the value for the remotesession.http.rootpath property to connect to the redirect page directly.
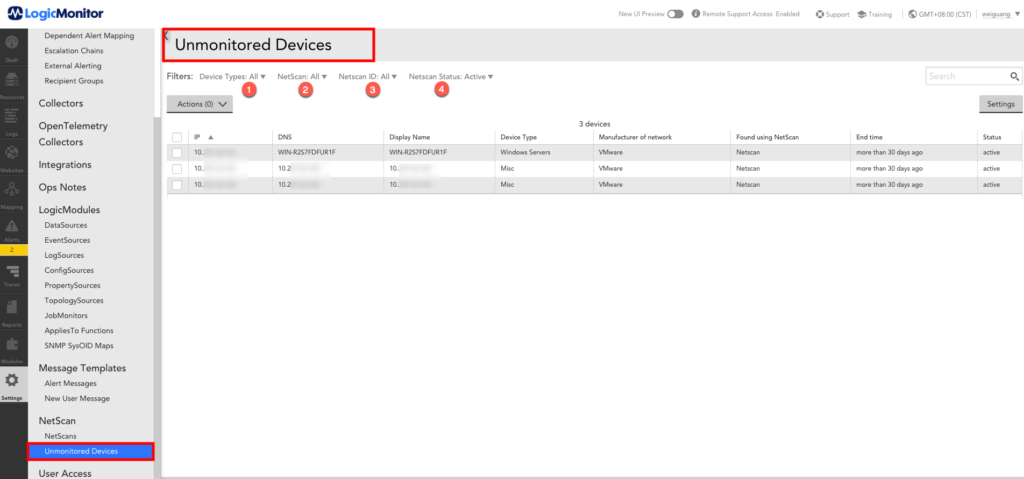
Devices discovered by NetScan that are not assigned to a device group show in the “Unmonitored Devices” on Resources tab or Settings tab.
You can filter this list of devices in several ways:
- Device types: e.g. Windows, Linux, Cisco, NetApp devices.
- NetScan: names of your NetScan definitions by which they were added.
- NetScan ID: The system defined ID of the iteration by which they were added.
- NetScan status: choose Active, Deleted, or All. Deleted devices are those that were previously discovered during a NetScan iteration, then deleted, and have since been re-discovered. You can move these devices directly into monitoring. Devices that have been ‘Deleted’ will not be added on future NetScans. If you want to remove Deleted devices from the list, add them to a group and delete that group.
You can move unmonitored devices to a group in two ways:
- Select the desired devices using checkboxes then click the “Move to Group” button. You will be prompted to specify an existing group.
- Select the desired devices using checkboxes then drag and drop them into the desired group.
Introduction
As discussed in How DataSources Get Applied to Resources, DataSources are automatically applied to the resources that you have added into monitoring. However, there may be occasions when you don’t want a particular DataSource to actively collect data for one or more resources to which it has been applied. For example, you may simply not be interested in the metrics being collected by that DataSource—or maybe you are interested in those metrics, but only for resources in your production environment. Or, perhaps, the DataSource has been deprecated by a new DataSource.
For these types of cases, you can perform targeted DataSource disabling. DataSource disabling allows you to discontinue data collection (and therefore, alerting) for one or more resources, while preserving all historical data collected for the resource thus far. (Deleting a DataSource or disassociating a DataSource (via a change in AppliesTo logic), on the other hand, results in the loss of all historical data.)
Alternatives to Disabling DataSources
Depending upon your objective, you may be better served by courses of action other than disabling a DataSource. Next are two examples:
- Are you disabling monitoring because of noisy alert conditions? If so, alternate courses of action could be to disable alerting instead of monitoring, or to make datapoint thresholds less sensitive, as discussed in Disabling Alerting and Tuning Static Thresholds for Datapoints respectively. Adjusting alert settings rather than disabling the DataSource allows the DataSource to continue collecting data.
- Is the DataSource incorrectly applied? If the DataSource is incorrectly applied to one or more resources, you can update the AppliesTo logic so that the DataSource automatically disassociates. (Important! Proceed with extreme caution as disassociating a DataSource from one or more resources immediately and permanently deletes all historical data collected by that DataSource for those resources.) For more information on AppliesTo logic, see AppliesTo Scripting Overview.
Disabling a DataSource
You can disable monitoring for a particular DataSource on a single resource, a particular instance of a multi-instance DataSource on a single resource, or for a particular DataSource across all resources in a resource group. As discussed in the following sections, the steps for disabling a DataSource vary depending on how broadly you are targeting disablement.
Note: When you disable monitoring of a particular DataSource for a resource or resource group, Active Discovery is also disabled for that DataSource. This means that instances will not be discovered, updated, or deleted for impacted resources.
Disabling a DataSource Across a Resource Group
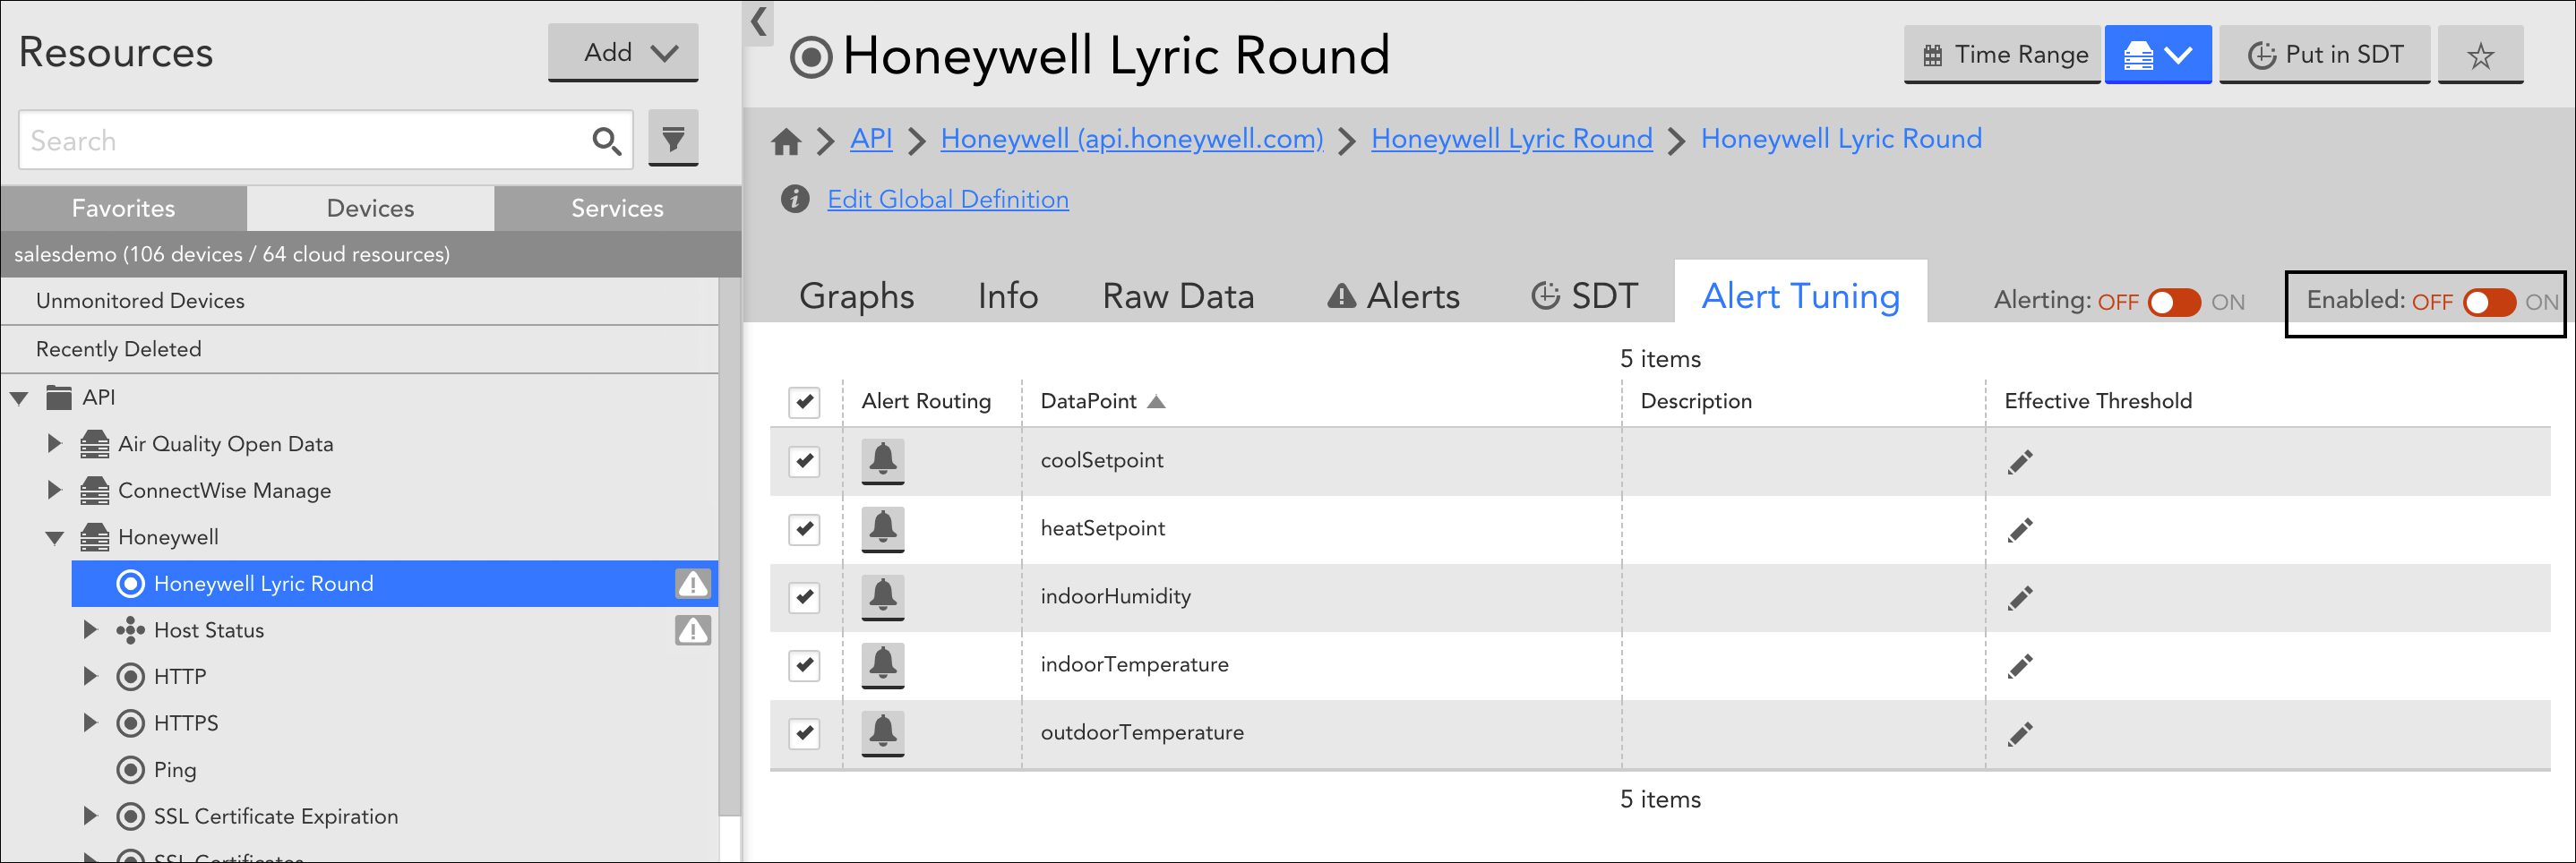
To disable monitoring for a DataSource for all resources in a resource group, navigate to the Resources page and, from the Resources tree, select the desired resource group. From the detail view, open the group’s Alert Tuning tab and uncheck the checkbox in the “Enable” column for the DataSource you are disabling.
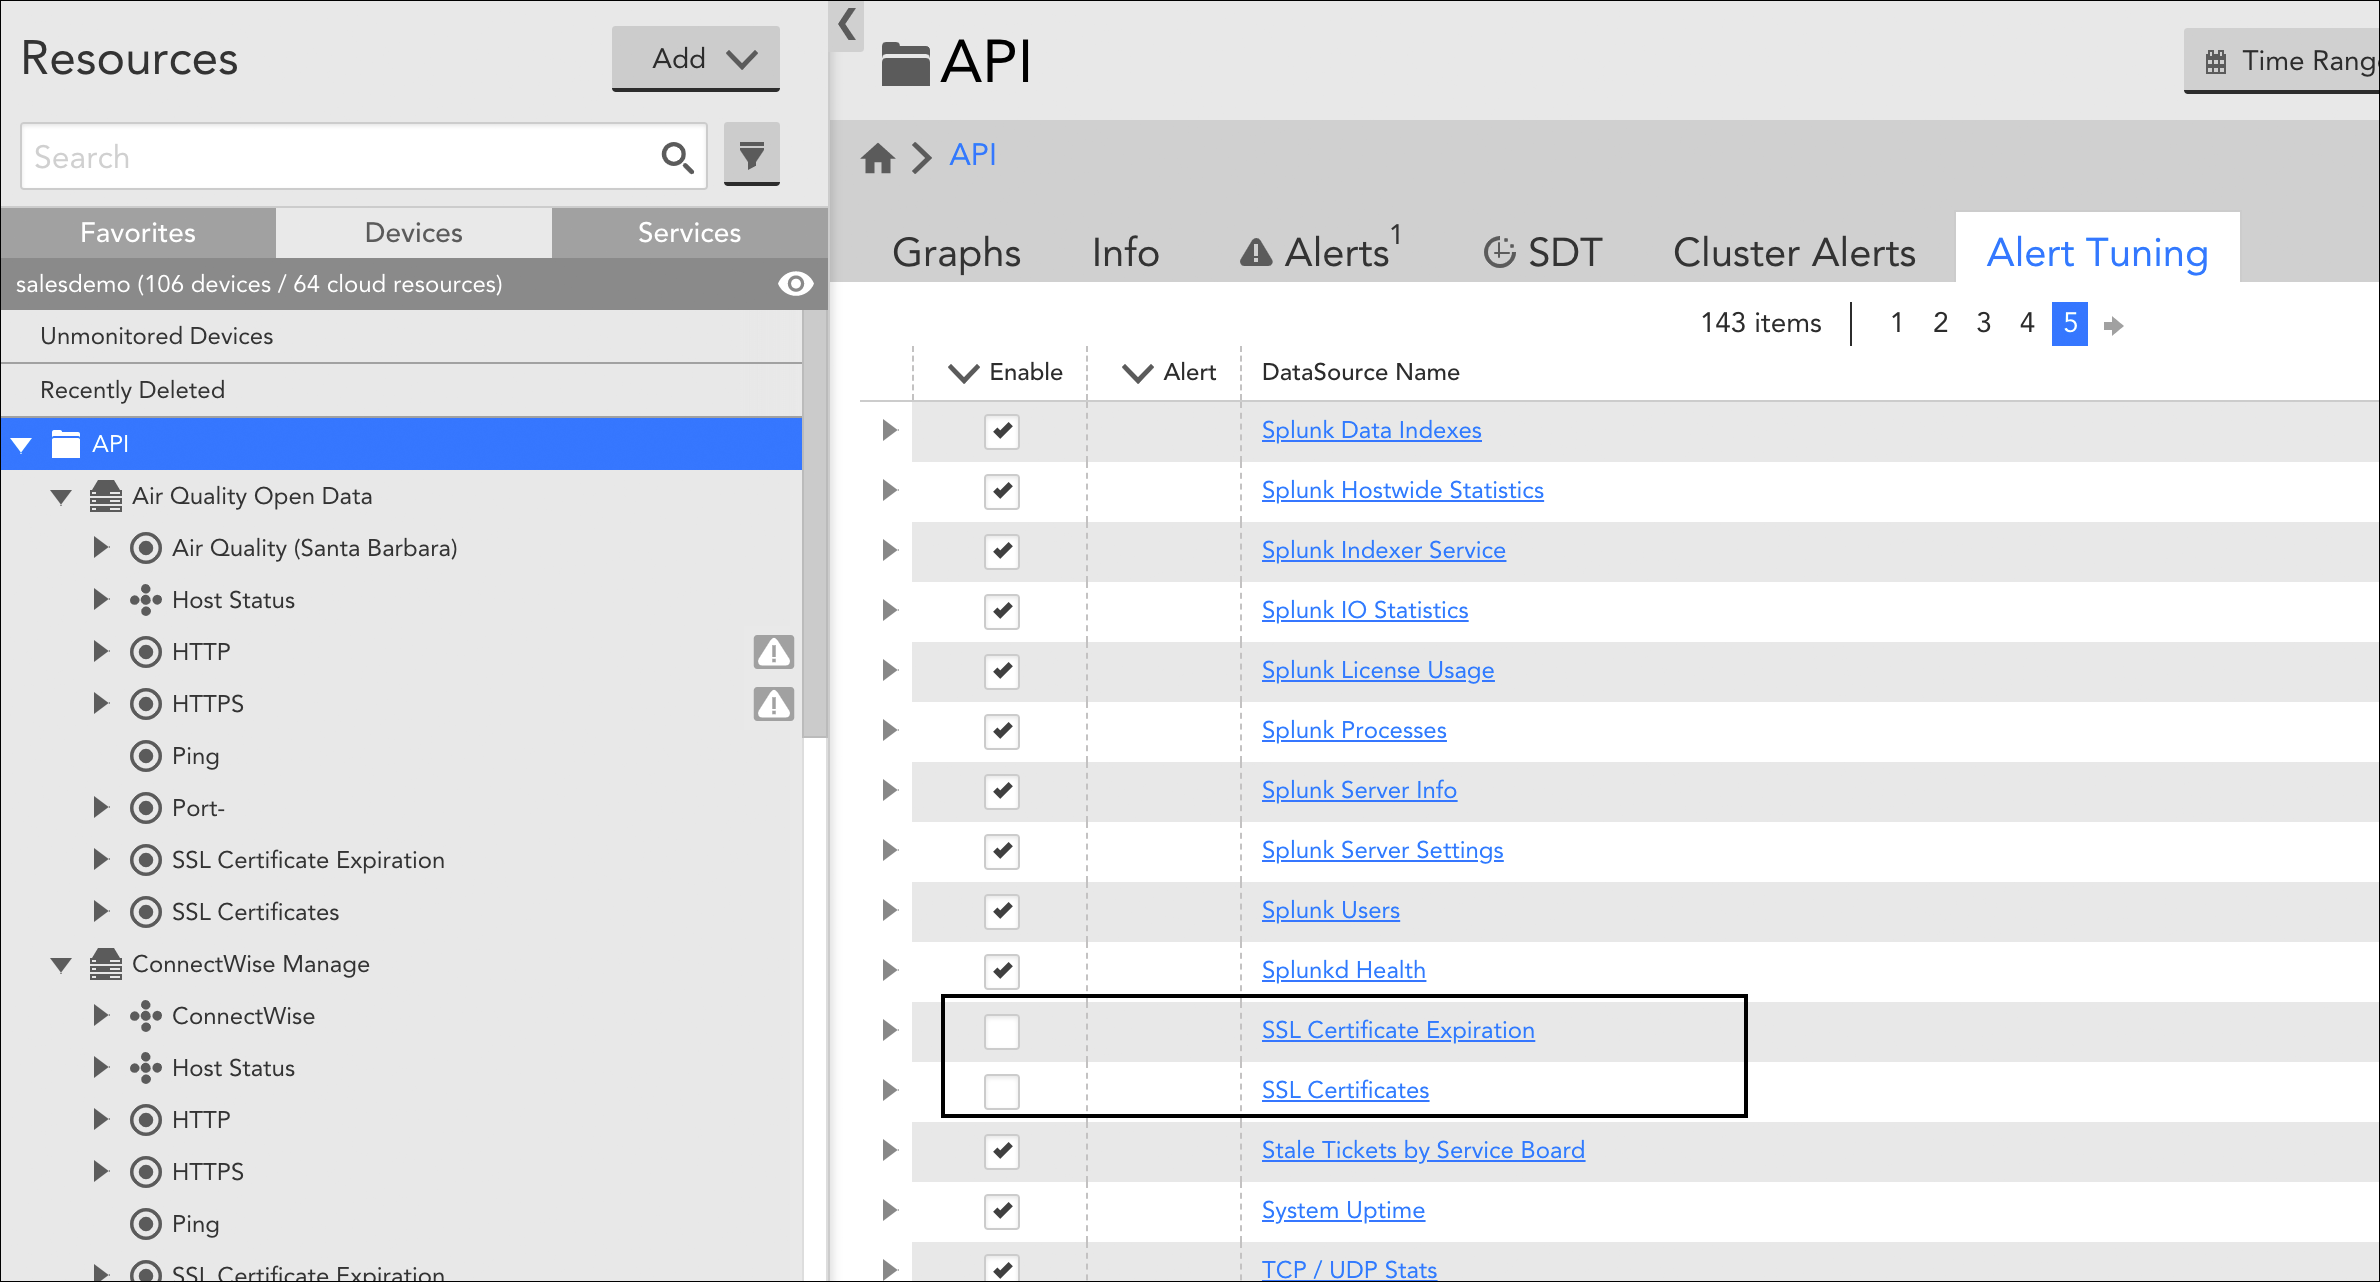
In this image, two DataSources have been disabled for all resources that are members of the “API” resource group.
When a DataSource is disabled at the resource group level, it is automatically moved into a dynamic DataSource group titled “Disabled Datasource.” This group is created for each resource in the resource group for which that DataSource applied. A refresh may be required before this group appears.
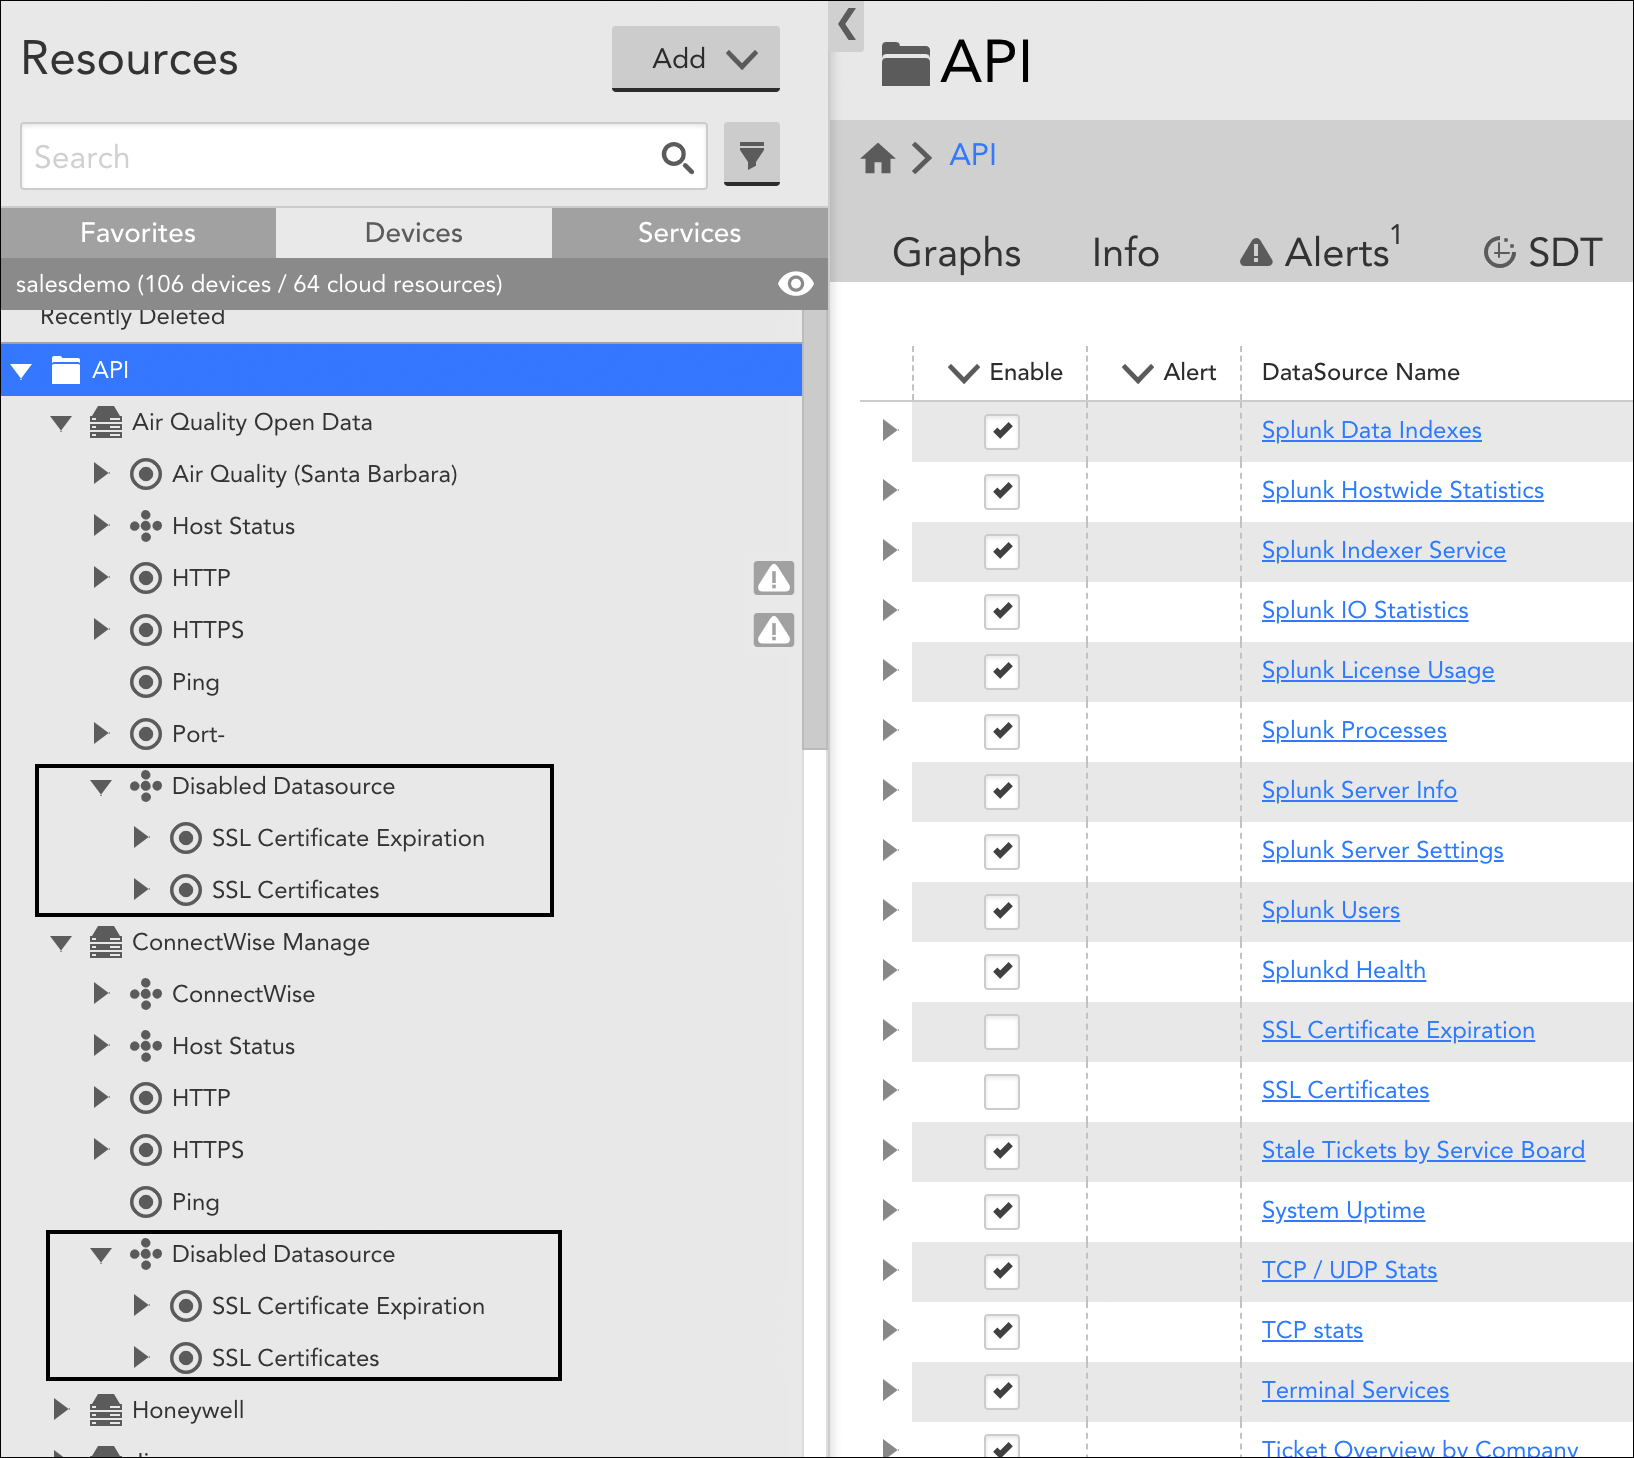
Continuing with the example in the previous screenshot, DataSources disabled at the group level are moved into a dynamic DataSource group titled “Disabled Datasource”. As shown here, this group is created for each resource in the resource group to which the DataSource applies.
Disabling a DataSource for a Single Resource
To disable a single-instance DataSource for a particular resource, navigate to the Resources page and, from the Resources tree, expand the resource for which you want to disable the DataSource. Select the desired child DataSource and, from its detail view, toggle the Enabled slider to the “OFF” position.
Note: If the DataSource is multi-instance, you’ll need to disable it at the instance level (discussed next). This allows you to disable for some instances, but not others, if desired.
Disabling an Instance of a DataSource for a Single Resource
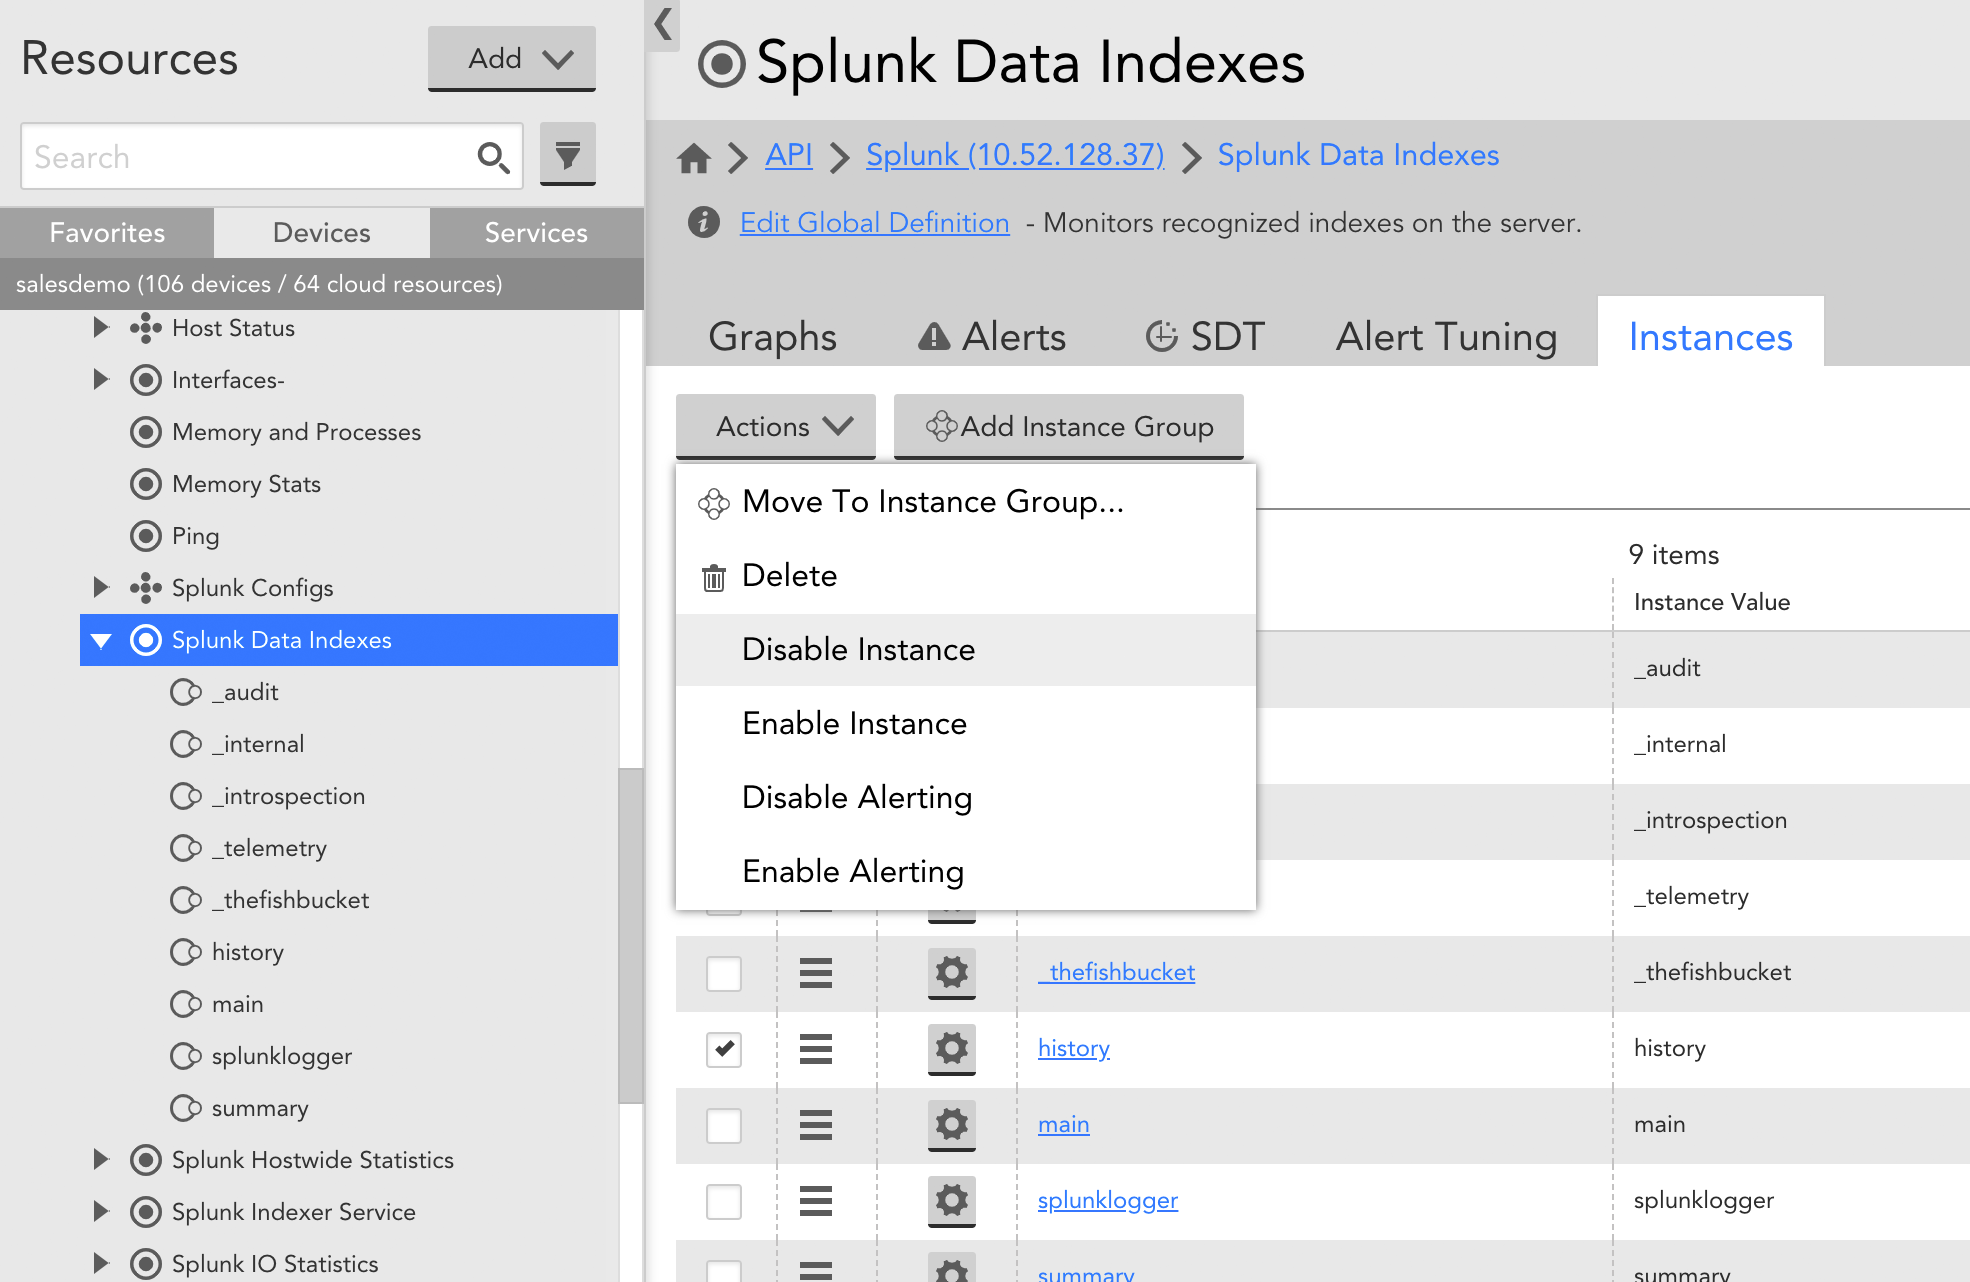
To disable one or more instances for a multi-instance DataSource for a particular resource, navigate to the Resources page and, from the Resources tree, expand the resource for which you want to disable the DataSource. Select the desired child DataSource and, from the detail view, open its Instances tab. Place a checkmark to the left of those instances of the DataSource you want to disable, click the Actions button, and select “Disable Instance” from the dropdown.
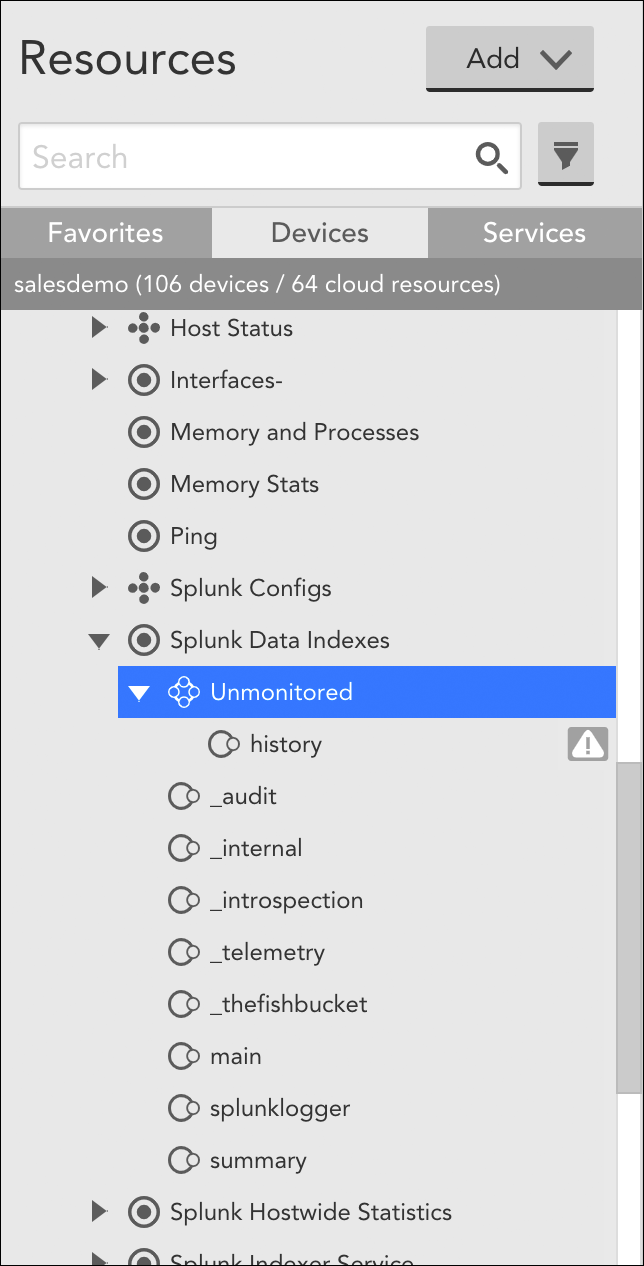
When an instance of a DataSource is disabled, it is automatically moved into a dynamic instance group titled “Unmonitored”. For more information on instance groups, see Instance Groups.
Overview
For every DataSource applied to a device, LogicMonitor attempts to discover instances to monitor. Some DataSources will only ever have one one instance to monitor per device (e.g. ping), while others may identify multiple instances (e.g. disks, server volumes, interfaces, etc.) to monitor per device
When multiple instances are identified by a DataSource (called a multi-instance DataSource), these instances can be grouped. Instance groups allow you to organize instances in ways that are meaningful to your environment.
In addition to providing logical organizational structures, instance groups, like device groups, are available for selection from the Resources tree. As independent entities, they support many of the same actions that other tree objects do, including the ability to:
- Tune static datapoint thresholds (using the Alert Tuning tab) for all member instances en masse (see Tuning Static Thresholds for Datapoints).
- Enable dynamic thresholds (using the Alert Tuning tab) for all member instances en masse (see Enabling Dynamic Thresholds for Datapoints).
- Put all member instances into SDT (using the SDT tab) en masse (see SDT Tab).
- View overview DataSource graphs (using the Graphs tab) for just those instances in the group (see Graphs tab).
- View alerts (using the Alerts tab) for just those instances in the group.
Instance groups can be created and populated manually or automatically. Automated group management is driven by the Active Discovery process configured for a DataSource.
Manual Management of Instance Groups
For multi-instance DataSources that do not have automated instance grouping enabled, instance groups can be manually created, populated, and edited from the Instances tab. The Instances tab displays when viewing a multi-instance DataSource from the Resources tree.
To create a new instance group, click the Add Instance Group button. Once created, an instance can be moved from the default “Ungrouped” group into the new group by either dragging and dropping it or placing a checkmark to its left in the instance table and selecting Actions | Move to Instance Group.
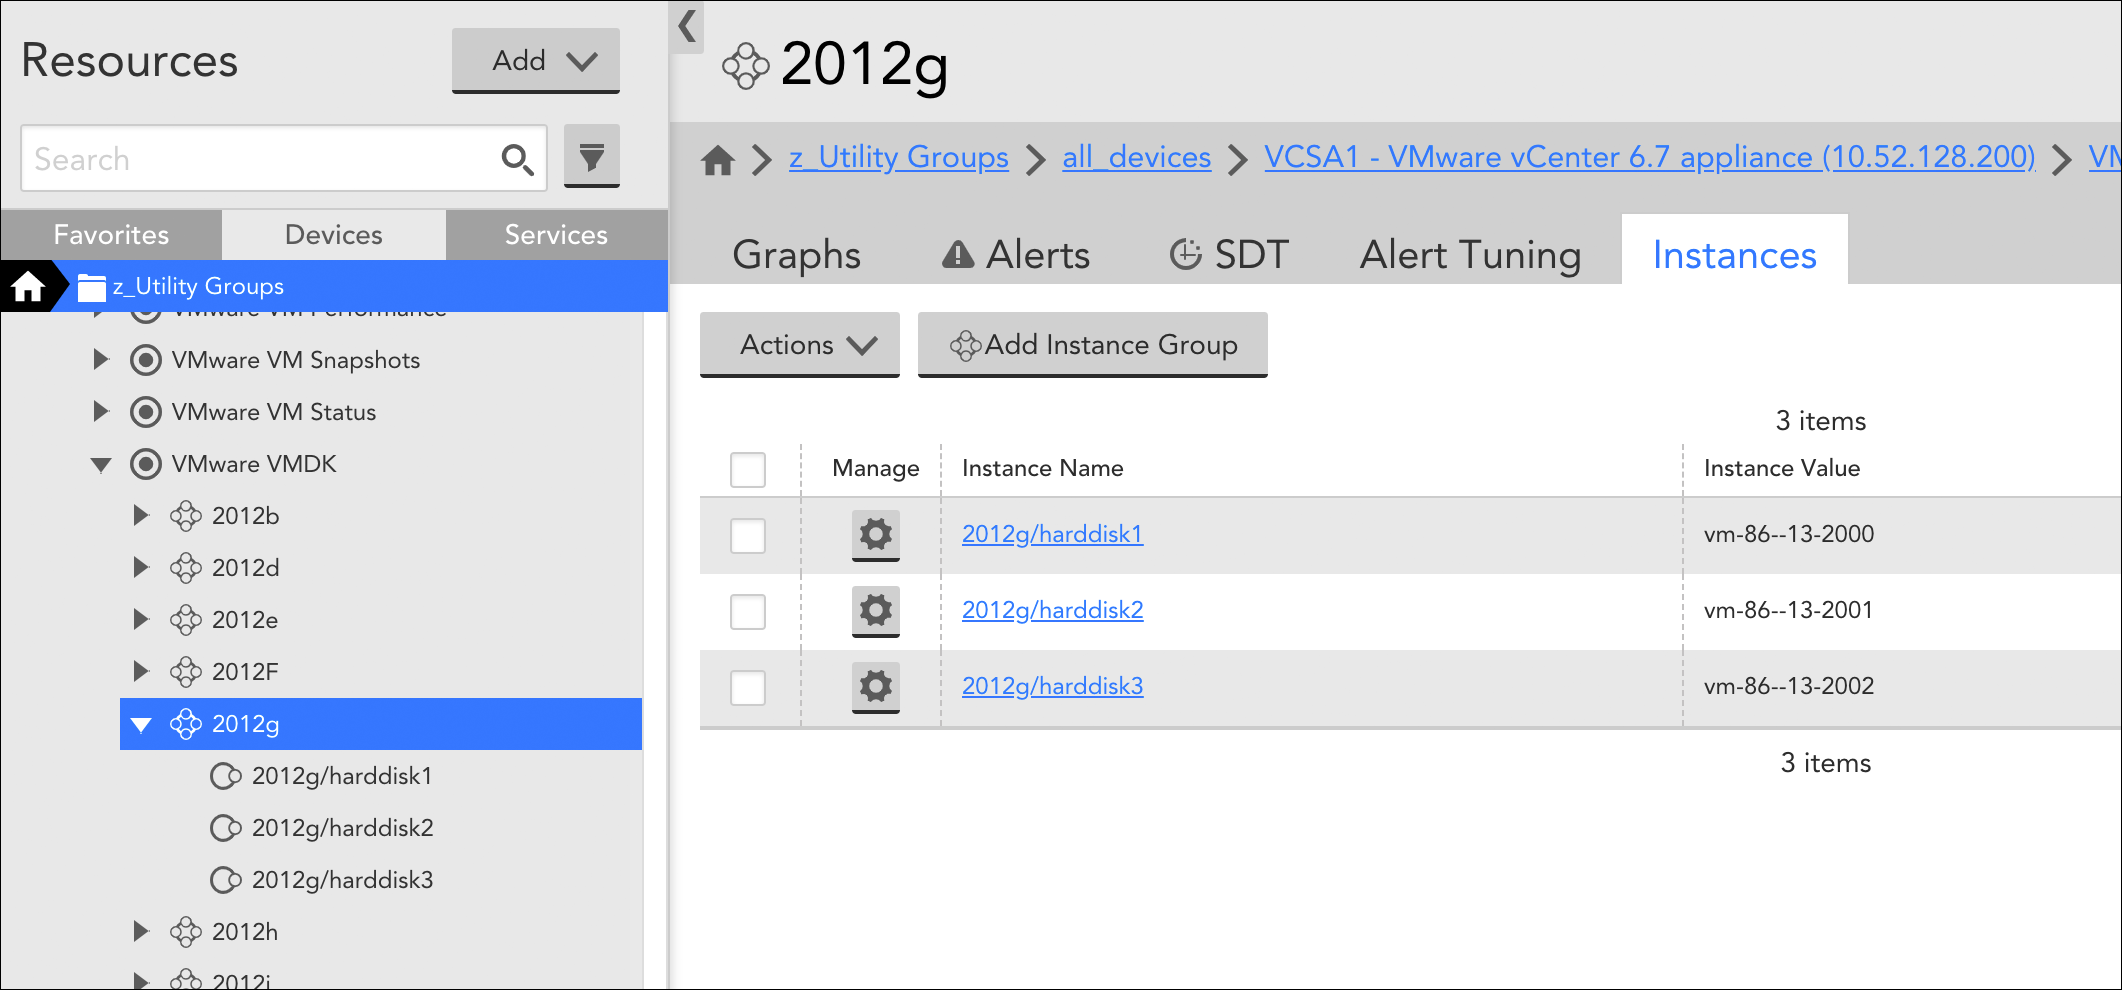
To edit the name or description of an instance group, or delete the group, click the down arrow located to the left of the group name, as shown next.
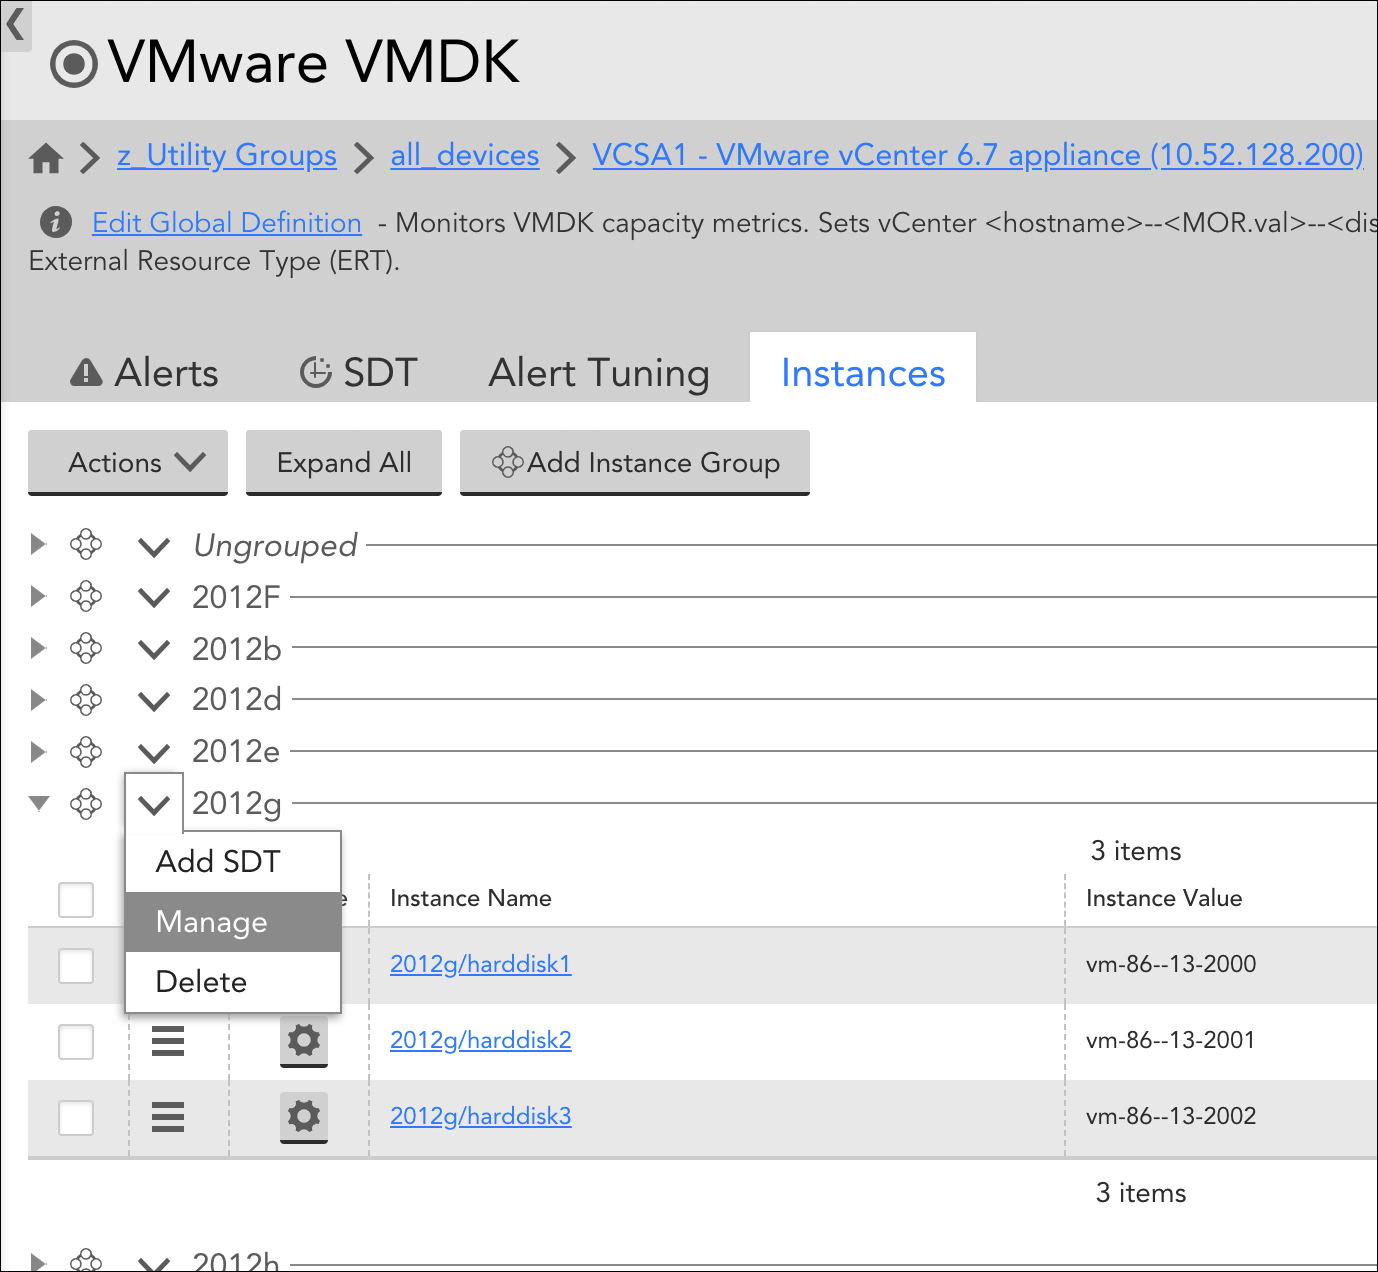
From the Instances tab of the parent multi-instance DataSource, groups that were manually created can be edited or deleted.
Automated Management of Instance Groups
As an alternative to manually grouping instances, you can allow LogicMonitor to automatically group instances according to shared attributes upon discovery. Automated grouping is a function of the Active Discovery process, which is configured from the DataSource definition. (For more information on Active Discovery, see Active Discovery).
Specifically, automated management of instance groups is established by selecting something other than “Manual” from the Group method field’s dropdown. In order for the Group method field to be available, the DataSource definition’s Multi-instance? and Enable Active Discovery options must be checked.
There are up to four automated grouping methods you can use to organize instances:
- NetScaler
- NetScalerServiceGroup
- Regular Expression
- Instance Level Property
Which methods you are presented with from the Group method field is dependent upon what is supported by the protocol (e.g. SNMP, WMI, etc.) being used to discover instances (as defined in the Discovery method field of the DataSource definition). Each automated grouping method is discussed next.
NetScaler
Used only for Citrix NetScalers, this grouping method automatically groups instances (i.e. services) according to the load balancing virtual IPs (VIPs) in which they are members.
NetScalerServiceGroup
Used only for Citrix NetScalers, this grouping method automatically groups instances (i.e. services) according to service group names.
Regular Expression
This method supports three parameters:
- useValue=”name”|”value”|”description”|”auto.instance_property_name”
- dynamicGroup=”a regex with capturing”
- groupName1=”regex1″ groupName2=”regex2″
As detailed in the following sections, these parameters exist to answer two basic questions:
- How should instances be organized and what should those resulting instance groups be called? (Determined via either the groupName or dynamicGroup parameter; these two parameters are mutually exclusive.)
- When evaluating the first question, which property of the instance should be used—either its name or value? (Determined via the useValue parameter.)
useValue (optional)
This parameter determines which instance property (name or value) will be evaluated. It is optional; if useValue is not specified, the instance name (also commonly referred to as “WILDALIAS”) will be used by default.
The following examples illustrate how the useValue parameter can be used in conjunction with either the dynamicGroup or groupName parameter to indicate that the instance’s value (also commonly referred to as “WILDVALUE”) should be evaluated, rather than its name.
useValue="value" dynamicGroup="\w+"useValue="value" Controllers="tray\d+controller." Batteries="tray\d+battery." CacheDIMMs="tray\d+dimm." Fans="tray\d+fan." PowerSupplies="tray\d+psu." SFPs="tray\d+sfp."dynamicGroup
If you want to dynamically extract group names from instance names or values, you can specify a regular expression with capturing (i.e. a portion of the regular expression that should be used as the group name, which will be the first capture group, defined by parentheses). For example, Linux hosts may have some set of physical block devices (e.g. sda, sdb, hdb, hdc, etc.), each with zero or more partitions. To group each partition (e.g. sda1, sda2, sda3, sdb2, sdc5) with its parent block device (sda, sdb, sdc) without requiring advanced knowledge of all possible block device names (and thus groups), you could use the following expression, which would return group name “sda” for sda1, sda2, and sda3; group name “sdc” for sdc5; and so on.
dynamicGroup="^(.d.)"Note: Use single quotes around regular expressions to avoid having to escape characters with “/”, as is required with some situations with double quotes:
dynamicGroup=’/w’
dynamicGroup=”//w”
groupName
You can assign instances to a predefined set of groups based on the name or value of the instances. The parameters are group name, followed by a regular expression. Any instance that matches the regular expression will become a member of the group. Instances can be members of more than one group if they match more than one regular expression.
For example, a Linux host may have physical disks sda, sdb, and sdc, along with Logical Volume Manager (LVM) disks dm0, dm1, and dm2. To auto-assign all LVM disks into group “LVM”, and all physical disks into group “physical”, you could use the following expression:
physical="sd.*" LVM="dm.*"The regular expression must match the entire instance in order for the instance to be assigned to that group. Thus, it is usually necessary to end in regex wildcards, as shown in the previous example (i.e. “.*”). Additionally, predefined group names cannot contain spaces.
Instance Level Property
If you enter an Instance Level Property name (prepended with “auto.”), into the Parameters field, an instance group for each unique value of that ILP will be created. For example, if you wanted to group all instances that share a common port speed, you would enter the following:
auto.port_speedThis would result in unique groups being created for instances with port speeds of 100Mbps, 1Gbps, 10Gbps, and so on. Note that ILPs are case sensitive in this field. For more information on instance properties, see Resource and Instance Properties.
“Unmonitored” Instance Groups
If monitoring is disabled for an instance (or if newly discovered instances are initially set to be disabled per Active Discovery configurations), LogicMonitor will automatically create an instance group called “Unmonitored” and populate it with the unmonitored instance(s). You can disable monitoring for other instances by dragging them into this group. Conversely, you can re-enable monitoring for an instance by dragging it out of this group and into an active instance group. For more information on disabling monitoring, see Disabling DataSources.
Overview
Device groups allow you to organize your devices and cloud resources in LogicMonitor in ways that can make management significantly easier and save you time when configuring alert thresholds, dashboards, reports, alert routing, and device properties. As discussed in Device Groups Overview, there are many ways to strategically group your devices and cloud resources in LogicMonitor.
Configuring a Device Group
To begin the creation of a new device group, select Resources | Add | Group | Device Group. In the Add Device Group dialog that opens, there are several pieces of information that must be provided, as discussed next.
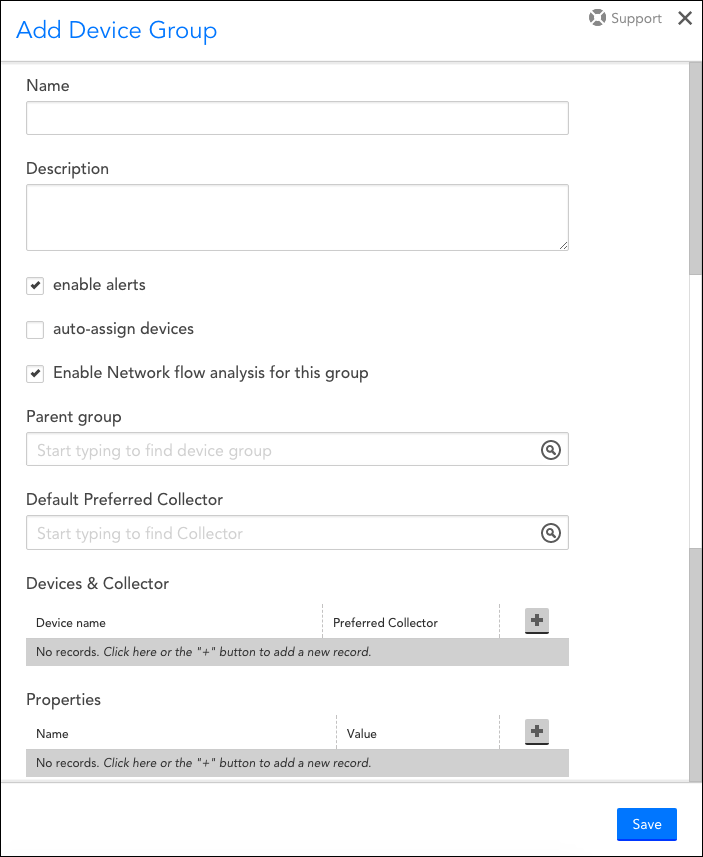
Name
In the Name field, assign a name to your new device group. This name will display in the Resources tree and will be used as a reference in reports, dashboards, and alerting.
Note: If you have groups of a similar nature that you expect you will want to reference in the same graphs or reports, it is recommended that you use a similar group prefix so that you are later able to take advantage of LogicMonitor’s support of glob expressions. For more information on glob support, see Using Glob throughout your account.
Note: Device group names cannot include the operators and comparison functions used in datapoint expressions, as listed in Complex Datapoints. Additionally, device group names, as best practice, should not include the following filter reserved strings: :::, :, !::, !~, ~, >:, <=, !:, >, <. Use of these strings can cause errors when filtering on device groups within dashboard widgets or other functionalities that filter according to device groups.
Description
In the Description field, enter a detailed group description. This description will display upon hovering over the group name in the Resources tree.
Enable Alerts
By default, the Enable alerts checkbox is selected. When alerting is enabled, alerts will be generated if a threshold is exceeded by any device or cloud resource datapoint in the group. Disabling alerting allows data to be collected without alert generation. Alerts can also be disabled at the device/cloud resource, DataSource, and datapoint level.
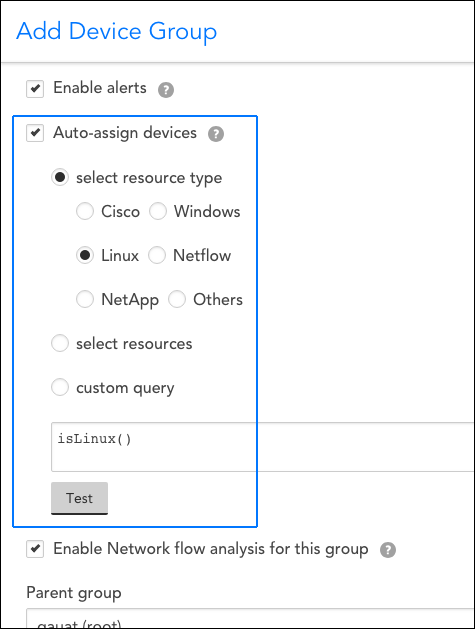
Auto-assign Devices
To automatically assign members to this group based on device type, device name or a custom query that utilizes LogicMonitor’s AppliesTo scripting language. Devices and cloud resources currently in your account, as well as those added to your account in the future, will be assigned to this dynamic group if they meet the specified criteria. Resources cannot be manually added to dynamic groups, and are automatically removed when they no longer meet the auto-assign criteria. For more information on dynamic device groups, see Device Groups Overview.
Note: You will need “Manage” permissions at the root level in order to create a dynamic group.
Note: Unlike when determining DataSource associations, the criteria that dynamically determines which devices are auto-assigned to a dynamic group (i.e. the AppliesTo script) can only evaluate properties of the host itself, not any inherited properties from those groups of which it is a member. This is to avoid circular referencing. For similar reasons, the systems.group property is also excluded from use in a dynamic group’s AppliesTo script as the query itself could change the results of the query, potentially creating an endless loop.
Enable Network Flow Analysis for this Group
Select the Enable Network flow analysis for this group checkbox to enable collection of network traffic flow data for all devices assigned to this group. For more information on collecting network traffic flow data via LogicMonitor, see Configuring Monitoring for NetFlow.
Parent Group
From the Parent group field, assign your new group to a parent group. Your new group can either be a subgroup of a group you’ve previously created or a subgroup of the very top-level root account (i.e. [account name] (root)).
Default Preferred Collector
From the Default Preferred Collector field, assign the primary Collector responsible for collecting data from the devices in the group. Backup Collectors will automatically be assigned if the preferred Collector fails over.
Devices & Collector
Assuming you haven’t selected the Auto-assign devices option to make your new group a dynamic group, use this functionality in this section to manually assign devices or cloud resources to your group. The Collector monitoring the device will also display.
Properties
Use the functionality in this section to assign properties at the group level. Properties defined at the group level will be inherited by all group and subgroup members, as long as those properties aren’t additionally assigned at deeper levels (i.e. subgroup or device level), in which case they will override the group properties assigned here. For more information on how to assign properties at the group or device level, and the reasons for doing so, see Resource and Instance Properties.
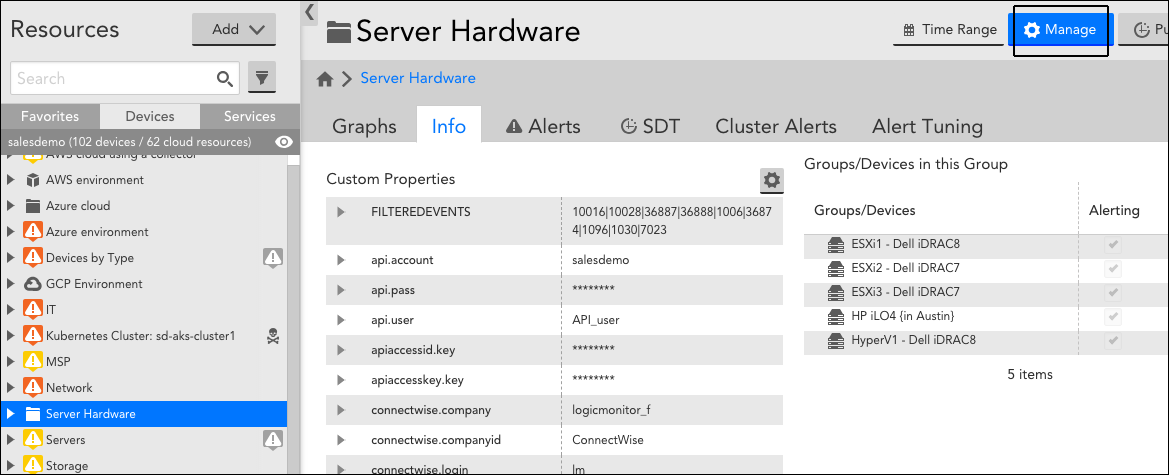
Managing an Existing Device Group
Once a new device group has been created and saved, you can edit its configurations (e.g. update parent group, add/remove devices, edit the query that determines dynamic group membership, etc.) by navigating to it in the Resources tree and clicking its Manage button, as shown next.
Grouping your devices and cloud resources in LogicMonitor can make management significantly easier and save you time when configuring alert thresholds, dashboards, reports, alert routing, and device properties.
Device groups allow you to:
- Organize your devices and cloud resources within the Resources tree, improving navigation and load time.
- Manage device and cloud resource performance, alert thresholds, and properties at a group level.
- Easily create dashboard and report views of all items in a group.
- Customize user permissions based on groups or subgroups.
As discussed in Adding Device Groups, device groups are created by navigating to Resources | Add | Group | Device Group.
Common Grouping Strategies
There isn’t one right way to group your devices and cloud resources, but there are a couple of common ways to approach grouping that make things more efficient. Keep in mind that it is usually not too difficult to change how your devices and cloud resources are grouped so there is room for fine tuning to ensure your device group structure is the best fit for your environment.
As discussed next, there are three common strategies for group organization:
- Grouping according to criticality
- Grouping according to team/organization structure
- Grouping according to device relationships
Grouping According to Criticality
Consider grouping devices and cloud resources together based on how critical they are to your operation. Critical infrastructure with slow performance metrics are likely to be of more interest to you and have different alert thresholds than QA devices with the same slow performance. Grouping devices of similar importance will enable you to set group alert thresholds across all items in the group, allowing you to differentiate between a critical CPU alert on production infrastructure and a critical CPU alert on test environment infrastructure without configuring individual thresholds for hundreds of items.
Additionally, grouping devices of similar importance will enable you to route alerts by group. For example, you could set up an alert rule matching error/critical alerts for your production infrastructure that routes notifications to members of your operations team 24/7 (e.g. text message or phone call in the middle of the night) and set up a different rule that matches test environment error/critical alerts and routes notifications to a ticketing system if it is past 7:00pm
Grouping According to Team/Organization Structure
Consider grouping devices and cloud resources based on the structure of your organization. How does your organization operate and divide responsibility? Having a device group structure that mirrors your organizational structure will make all other areas of account configuration (especially user roles and permissions) much simpler. Such a device group structure can help teams quickly find the devices relevant to their jobs and allows you to set up roles for each group, such that each team can only make changes to the devices for which they are responsible.
Grouping based on organizational structure may mean grouping by:
- Function (for example a database group, networking group, servers group and so on)
- Location (for example a group for each office or data center location)
- Customer (for example you’re an MSP and have groups for each of your customers)
- Business application (for example grouping together all devices serving a particular website)
Additionally, this concept extends to subgroups (which are discussed in a later section of this article). If you have a NOC team, for example, that in charge of overseeing a large number of devices and then smaller functional teams responsible for subsets of those devices, your device group structure may look like this:
- NOC
- Database
- Networking
- Servers
Grouping According to Device Relationships
Consider grouping devices and cloud resources based on how they depend on one another to expedite troubleshooting and make it easier to schedule downtime for related devices. For example, does your organization have a regular maintenance window that results in a distinct set of devices becoming unavailable? Grouping those devices together would allow you to more clearly identify downtime due to maintenance and, more importantly, more clearly identify issues that arise in devices outside of maintenance. You could also group devices that comprise a single application. In general, grouping devices based on how they relate to one another will make it easier to see how a particular event impacts your infrastructure and enable you to more quickly identify its cause.
Subgroups
You can add as many subgroups as you need; all of the above strategies apply to subgroups as well. Two key things to keep in mind when introducing subgroups are:
- When referencing device groups or subgroups throughout your account (e.g. in dashboards, reports, alert rules, user roles), you should add a wildcard to the end of the group name (e.g. ‘Production*’). A group name that is wildcarded will include devices in any of the group’s subgroups.
- Properties and thresholds set at the subgroup group level will override the values of those same properties and thresholds at the parent (or higher) group levels.
Including a Device in Multiple Groups
Devices and cloud resources can be members of multiple device groups. If the same property is defined across these groups, then it’s important to note that properties set at the deepest level group take precedent. If the same property is set in two groups at the same level, and a device or cloud resource is a member of both of these groups, the selection of which property will take effect is nondeterministic.
Manual vs. Dynamic Device Groups
There are two types of device groups: manual and dynamic.
Manual Device Groups
Manual device groups have static membership. You must manually add devices or subgroups to, or remove them from, manual groups (although devices may be automatically added to such groups as a result of a network discovery scan). You can also use LogicMonitor’s API to add and remove devices from a manual group.
Dynamic Device Groups
Dynamic groups have dynamic membership, meaning that devices or cloud resources are automatically added or removed from the group based on specific common characteristics. Because dynamic grouping typically better enforces organization with less effort than manual grouping, it’s recommended to use dynamic grouping whenever possible.
Note: Only administrators and those with admin-level manage permissions to resources (the All option selected at the top of the table of resources) can manage dynamic groups. For more information on Roles and Permissions for dynamic groups, see Roles.
Dynamic groups are created by specifying AppliesTo criteria for the auto-assignment of devices to the group. For more information, see AppliesTo scripting language.
Devices cannot be manually added to dynamic groups, and are automatically removed when they no longer meet the auto-assignment criteria. For example, you could create a group for your San Francisco office, with the following custom query: location =~ "San Francisco". If a device is transferred from the San Francisco to Los Angeles office and the location property is updated, it will no longer appear in the San Francisco group.
Properties and thresholds can be managed for a dynamic group the same way they are managed for a manual device group, and will be inherited by group members.
Note: To avoid circular references, the criteria that determines which devices are auto-assigned to a dynamic group (for example the AppliesTo script) can only evaluate properties of the host itself. Inherited properties from groups of which the device is a member cannot be evaluated.
For similar reasons, the systems.group and system.deviceGroupId properties are also excluded from use in a dynamic group’s AppliesTo script. This is because the query itself could change the results of the query, potentially creating an endless loop.
To create a dynamic group that is dependent on group membership, use the property system.staticgroups in your AppliesTo script: join(system.staticgroups,”,”) =~ “production”.
Next are several examples of when you may want to use dynamic groups:
- When a subset of devices use a custom port. For example, assume for a moment that all of your SQL servers whose names start with ‘ALT’ have a custom port configured for MySQL. In this scenario, you could create a dynamic group that includes all devices whose names start with ‘ALT.’ You could then clone the MySQL DataSource, edit it to use the custom port, and apply it to only that group. All existing and new MySQL servers added to the account that have a name that starts with ‘ALT’ will automatically be assigned the cloned DataSource with the custom port instead of the original MySQL DataSource.
- To generate a dashboard widget or report. For example, if you have a widget or a report in which you’d like to display data for a certain type of device, you could create a dynamic group that includes only devices of that certain type and then configure the widget or report to reference the dynamic group. New devices added to the account that match the dynamic group criteria will automatically be added to the widget or report.
- To identify devices that aren’t being monitored comprehensively. LogicMonitor applies DataSources to devices based partly on the
system.sysinfoproperty. Typically this property is automatically set when the device is added. However, ifsystem.sysinfoisn’t set for a device (likely because a LogicMonitor Collector wasn’t able to identify the device), LogicMonitor might only apply generic metrics that aren’t device-specific, like ping, http, etc. In this scenario, you can create a dynamic group with the querysystem.sysinfo ==""to include all the devices in an account that Collectors weren’t able to identify during discovery. This would allow you to identify any devices in your account that aren’t being monitored as comprehensively as they could be.
Some examples of dynamic group queries include:
system.sysinfo =~ "Linux"– create a dynamic group of all Linux hosts.system.hostname =~ "lax"– create a dynamic group of all hosts in the LAX data center.hasCategory("Netscaler")– create a dynamic group of all Citrix NetScalers.system.hostname =~ "nyc" && system.hostname =~ "prod"– create a dynamic group of all production hosts in NYC.
Overview
The Instances tab is available from the Resources page. It displays when viewing multi-instance DataSources from the Resources tree. Multi-instance DataSources are DataSources that monitor objects (e.g. disks, server volumes, interfaces, etc.) that can potentially be present multiple times on a single device.
The Instances tab provides an overview table of all the instances found for a particular DataSource on a particular device. It’s a convenient way to quickly view or edit instance detail, as well as perform tasks in bulk such as disabling instances or disabling alerting on instances.
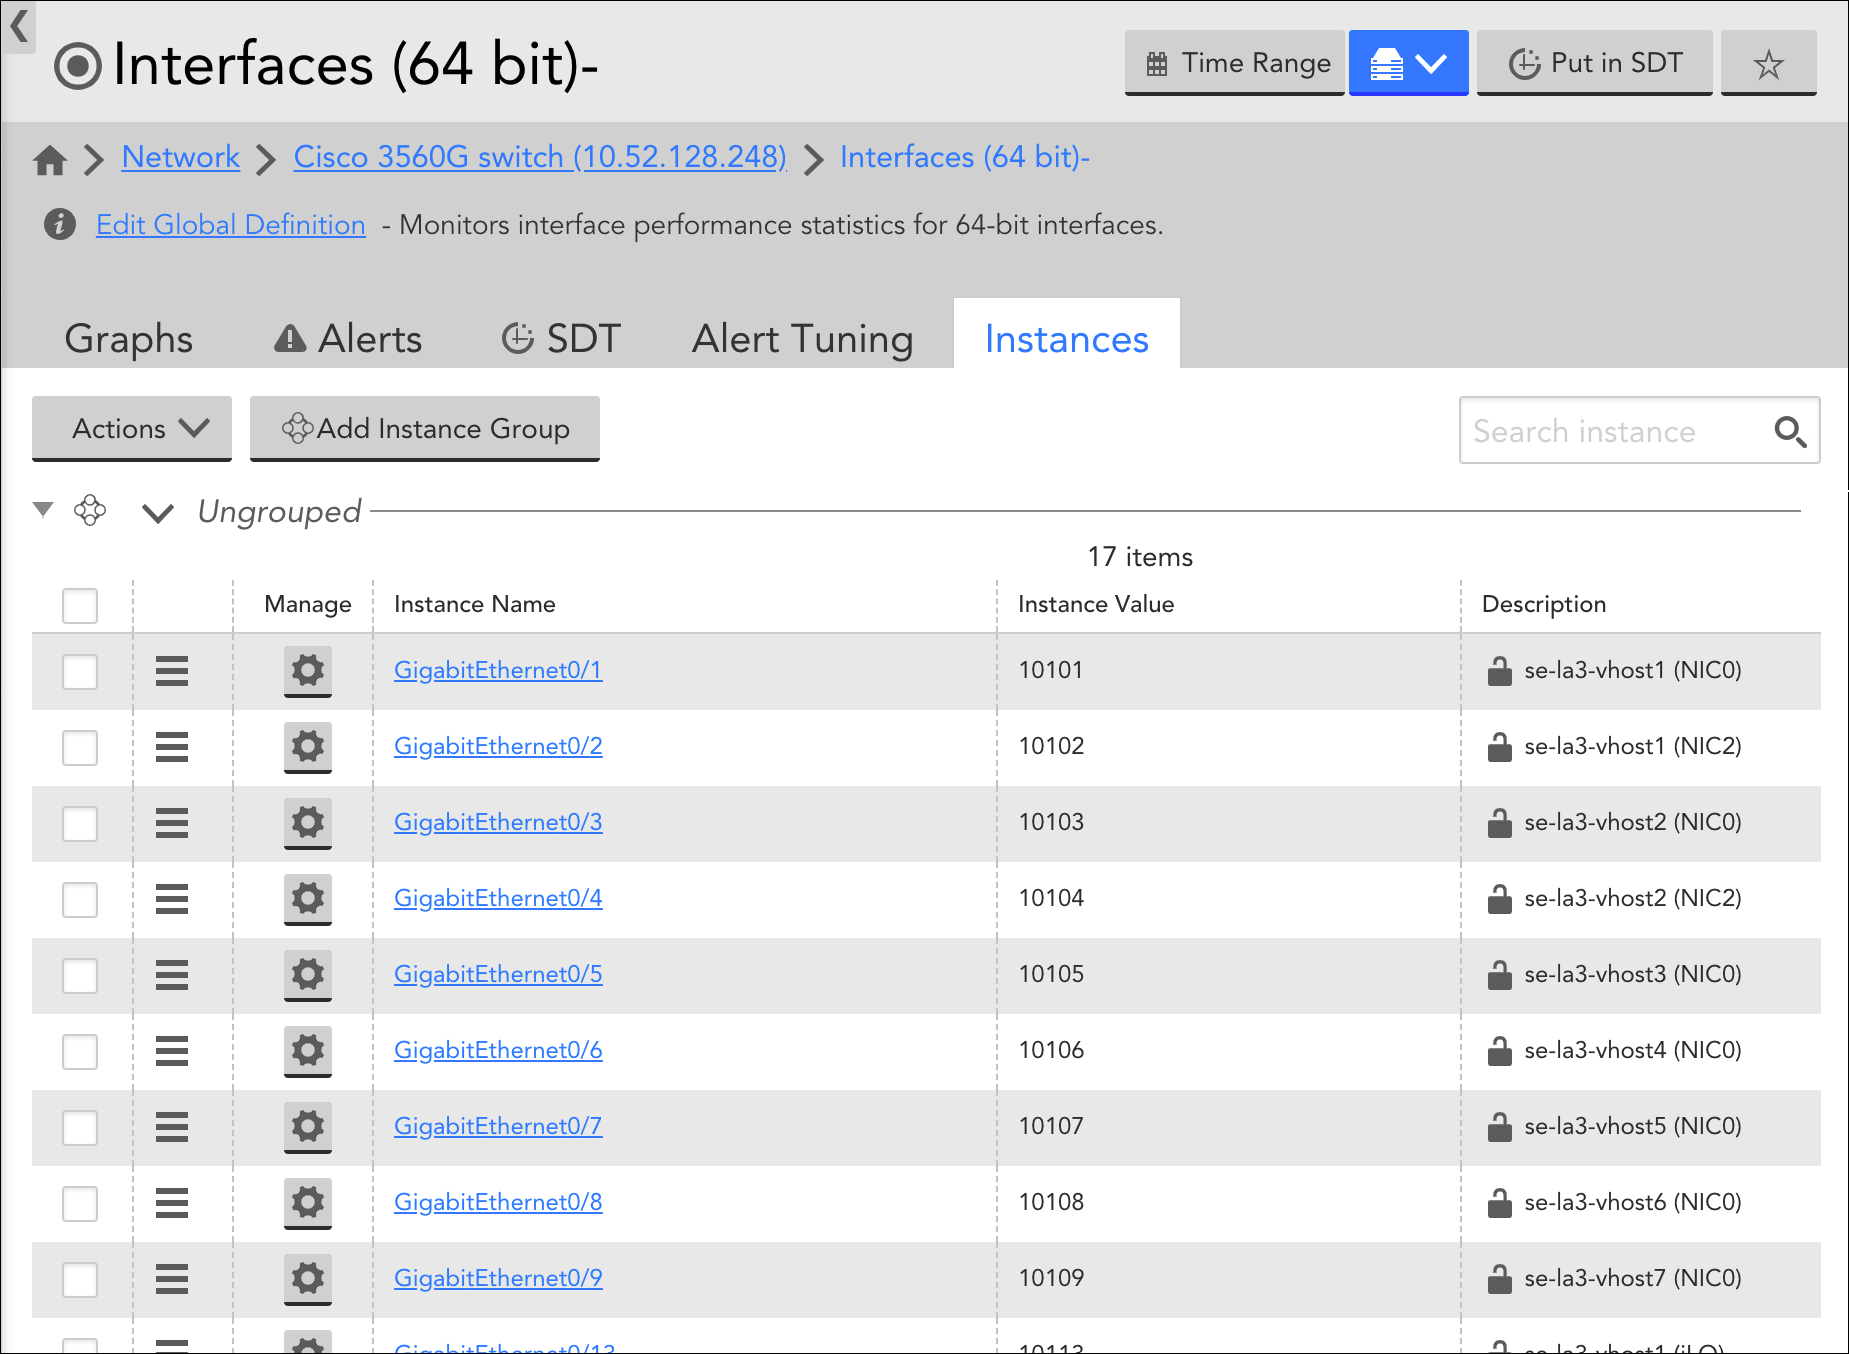
Editing Instances
Click the cogwheel icon in the Manage column of the instance table to open the Manage Instance dialog and edit instance details. If the instance was manually added, you have the ability to edit all instance details including instance name, value, and description. If the instance was added automatically by Active Discovery, only the description is available for editing. For more information on these instance details and the process of manually adding instances, see Adding Instances.
If Active Discovery is enabled for the DataSource, the Allow Active Discovery to overwrite the description option is available. When checked, this option allows the Active Discovery process to overwrite any description manually entered here. The lock icon that displays to the right of an instance description in the instance table depicts an open lock when this option is checked and a closed lock when it’s unchecked. For more information on Active Discovery, see Active Discovery.
You can also manage property assignment for an instance from the Manage Instance dialog. See Resource and Instance Properties for more information on instance properties.
Disabling/Enabling Instances
The Instances tab supports two methods for disabling/enabling instances:
- Manage Instance dialog. Check or uncheck the Enable alerting option found on the Manage Instance dialog (available by clicking the cogwheel icon in the Manage column of the instance table) to enable/disable an instance.
- Instance table. Place a checkmark to the left of one or more instances in the instances table and select Actions | (Disable|Enable) Instance.
Disabling an instance stops data collection for that instance. Upon disabling of an instance, LogicMonitor will automatically create an instance group named “Unmonitored” and populate it with the unmonitored instance. For more information on the impacts of disabling instances, see Disabling Monitoring for a DataSource or Instance.
Disabling/Enabling Alerting for Instances
To disable or enable alerting for an instance from the Instances tab, place a checkmark to the left of one or more instances in the instances table and select Actions | (Disable|Enable) Alerting. For more information on the impacts of disabling alerting, see Disabling Alerting.
Deleting Instances
The Instances tab supports two methods for deleting instances:
- Manage Instance dialog. Click Delete from the Manage Instance dialog (available by clicking the cogwheel icon in the Manage column of the instance table) to disable an instance.
- Instance table. Place a checkmark to the left of one or more instances in the instances table and select Actions | Delete.
Note: When an instance is deleted, all data collected for it (i.e. monitoring history) is also deleted.
Managing Instance Groups
LogicMonitor supports instance groups, allowing you to flexibly show relationships between the instances that are monitored under a DataSource for a single device. From the Instances tab, you can manually create or edit instance groups (assuming they are not automatically created groups), as well as move instances among groups. For more information on managing instance groups (both manual and automatic), see Instance Groups.
Note: In addition to displaying for multi-instance DataSources, the Instances tab also displays when viewing instance groups from the Resources tree, allowing you to view and edit instance configurations for just those instances in the group, rather than all instances found on the device for that DataSource.
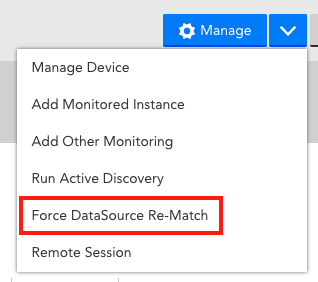
Force DataSource re-match is a troubleshooting step to ensure the system has correctly applied all available DataSources to a device.
To force DataSource re-match, select it from the dropdown list next to the Manage button on the device page.
LogicMonitor has DataSources to monitor web pages, processes, services, and UNC Paths. Because Active Discovery is disabled for these DataSources by default, you will need to add web pages, UNC paths, process, and services as instances on a per-device basis. The steps are outlined below:
- On the Resources page, navigate to the device in the Resources tree.
- Highlight the device in the Resources tree, and click the down arrow icon button located next to the Manage button for that device. From this dropdown menu, select “Add Other Monitoring“.
- Edit the necessary configurations for each web page, process, service, or UNC path you are adding as a monitored instance. These configurations are detailed in the following sections.
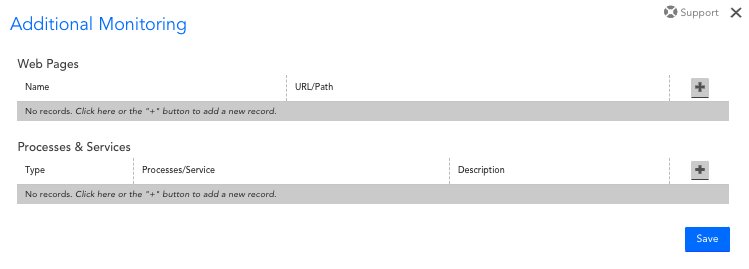
Web Pages
| Field | Description |
| Name | The name of the monitored web page as it will appear in LogicMonitor. |
| URL/Path | The full URL for the web page, or the relative URL path for the web page if the website domain is already associated with the device. |
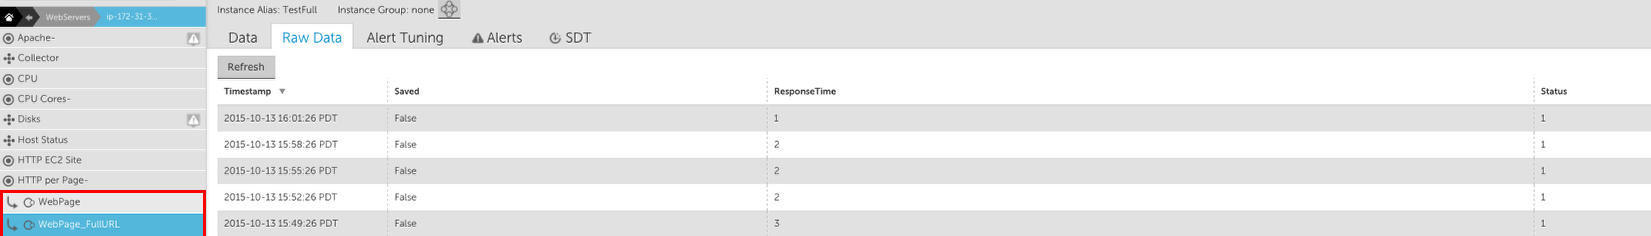
The HTTP per Page DataSource will load the web page, and provide a status and the page load time:
Processes and Services
| Field | Description |
| Type | The type of process or service you are adding. The dropdown values for this field will be limited based on whether the device runs a Windows or Linux Operating System. |
| Processes/Service | The process or service to be monitored. The dropdown values for this field will be pre-populated based on the processes and services running on your device. |
| Description | The description for the monitored process or service, as it will appear in LogicMonitor. |
Linux processes will be monitored by the LinuxNewProcesses DataSource, Windows processes will be monitored by the WinProcessStats DataSource and Windows services will be monitored by the Microsoft_Windows_Services DataSource. For more information about monitoring Linux services, see LogicModules in Package.
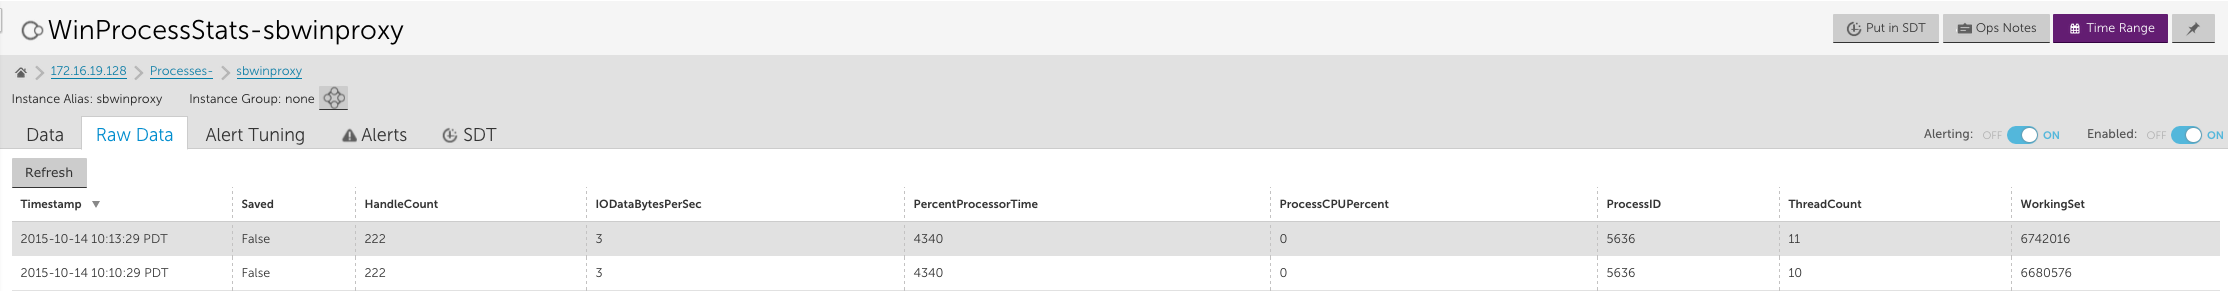
Note: Instances will need to be manually added (using Add Monitored Instance) to a resource and applied to the Microsoft_Windows_Services DataSource to get output.
UNC Paths
To monitor a UNC share, whether a domain DFS share or otherwise, use the UNC Monitor DataSource. This DataSource will do a directory listing on the given UNC share and report success or failure.
To add a share to be monitored, select a Windows host in the hosts view. The monitoring of the UNC actually occurs on the Collector that monitors this host, but the results can be associated with any Windows host.
For Windows devices, the option to monitor UNC Paths is available in the Additional Monitoring settings.
| Field | Description |
| Name | The name of the monitored UNC path as it will appear in LogicMonitor. |
| URL/Path | The UNC path. This can be a path to a directory or a specific file, such as \\fs\root\builds . LFS Paths, such as C:\Windows, are also supported. |
The UNC Monitor DataSource will monitor the accessibility of the UNC path from the collector monitoring this device.
When specifying UNC Paths to monitor, make sure that the user account has the proper permissions to access the UNC share. By default the user specified by the property wmi.user is used to access the file. If you need to specify an alternative user, use the following properties to set the username and password for the Windows user:
| Property | Description |
| win.user | Windows user name. |
| win.pass | Windows password. |
The above device properties can be used to set from Manage Device > Add Property. For more information, see Resource and Instance Properties.
Overview
For every DataSource applied to a device, LogicMonitor attempts to discover one or more instances to monitor. (For more information on how DataSources get applied to devices, see How DataSources Get Applied to Resources.)
Some DataSources will only ever have one instance to monitor per device (e.g. ping), while others may identify multiple instances (e.g. disks, server volumes, interfaces, etc.) to monitor per device.
For single-instance DataSources, the instance is automatically added and data collection begins immediately. For multi-instance DataSources, instances can be automatically added into monitoring via LogicMonitor’s Active Discovery process, or they can be manually added into monitoring. In the following sections, we’ll discuss both of these methods.
Adding Instances via Active Discovery
Active Discovery is automatically run for multi-instance DataSources that have it enabled. It is a process by which LogicMonitor determines all of the similar components of a particular type on a given system. For each component “discovered”, an instance is created and data is collected for that instance. For a detailed discussion of LogicMonitor’s Active Discovery process, see Active Discovery.
Active Discovery typically runs on a schedule that is configured from the DataSource definition. However, there may be situations in which you do not want to wait for the next scheduled execution of Active Discovery in order to add an instance into monitoring. In these situations, Active Discovery can be manually initiated.
Manually Initiating Active Discovery
Before manually initiating Active Discovery, ensure the DataSource and/or instance are not disabled at the group level as this will prevent instances from being added into monitoring.
To manually initiate Active Discovery, follow these steps:
- Navigate to the Resources page and, from the Resources tree, highlight the device for which you’d like to initiate Active Discovery.
- Click the device icon in the upper right corner of the Resources page and select “Run Active Discovery” from the dropdown that appears.
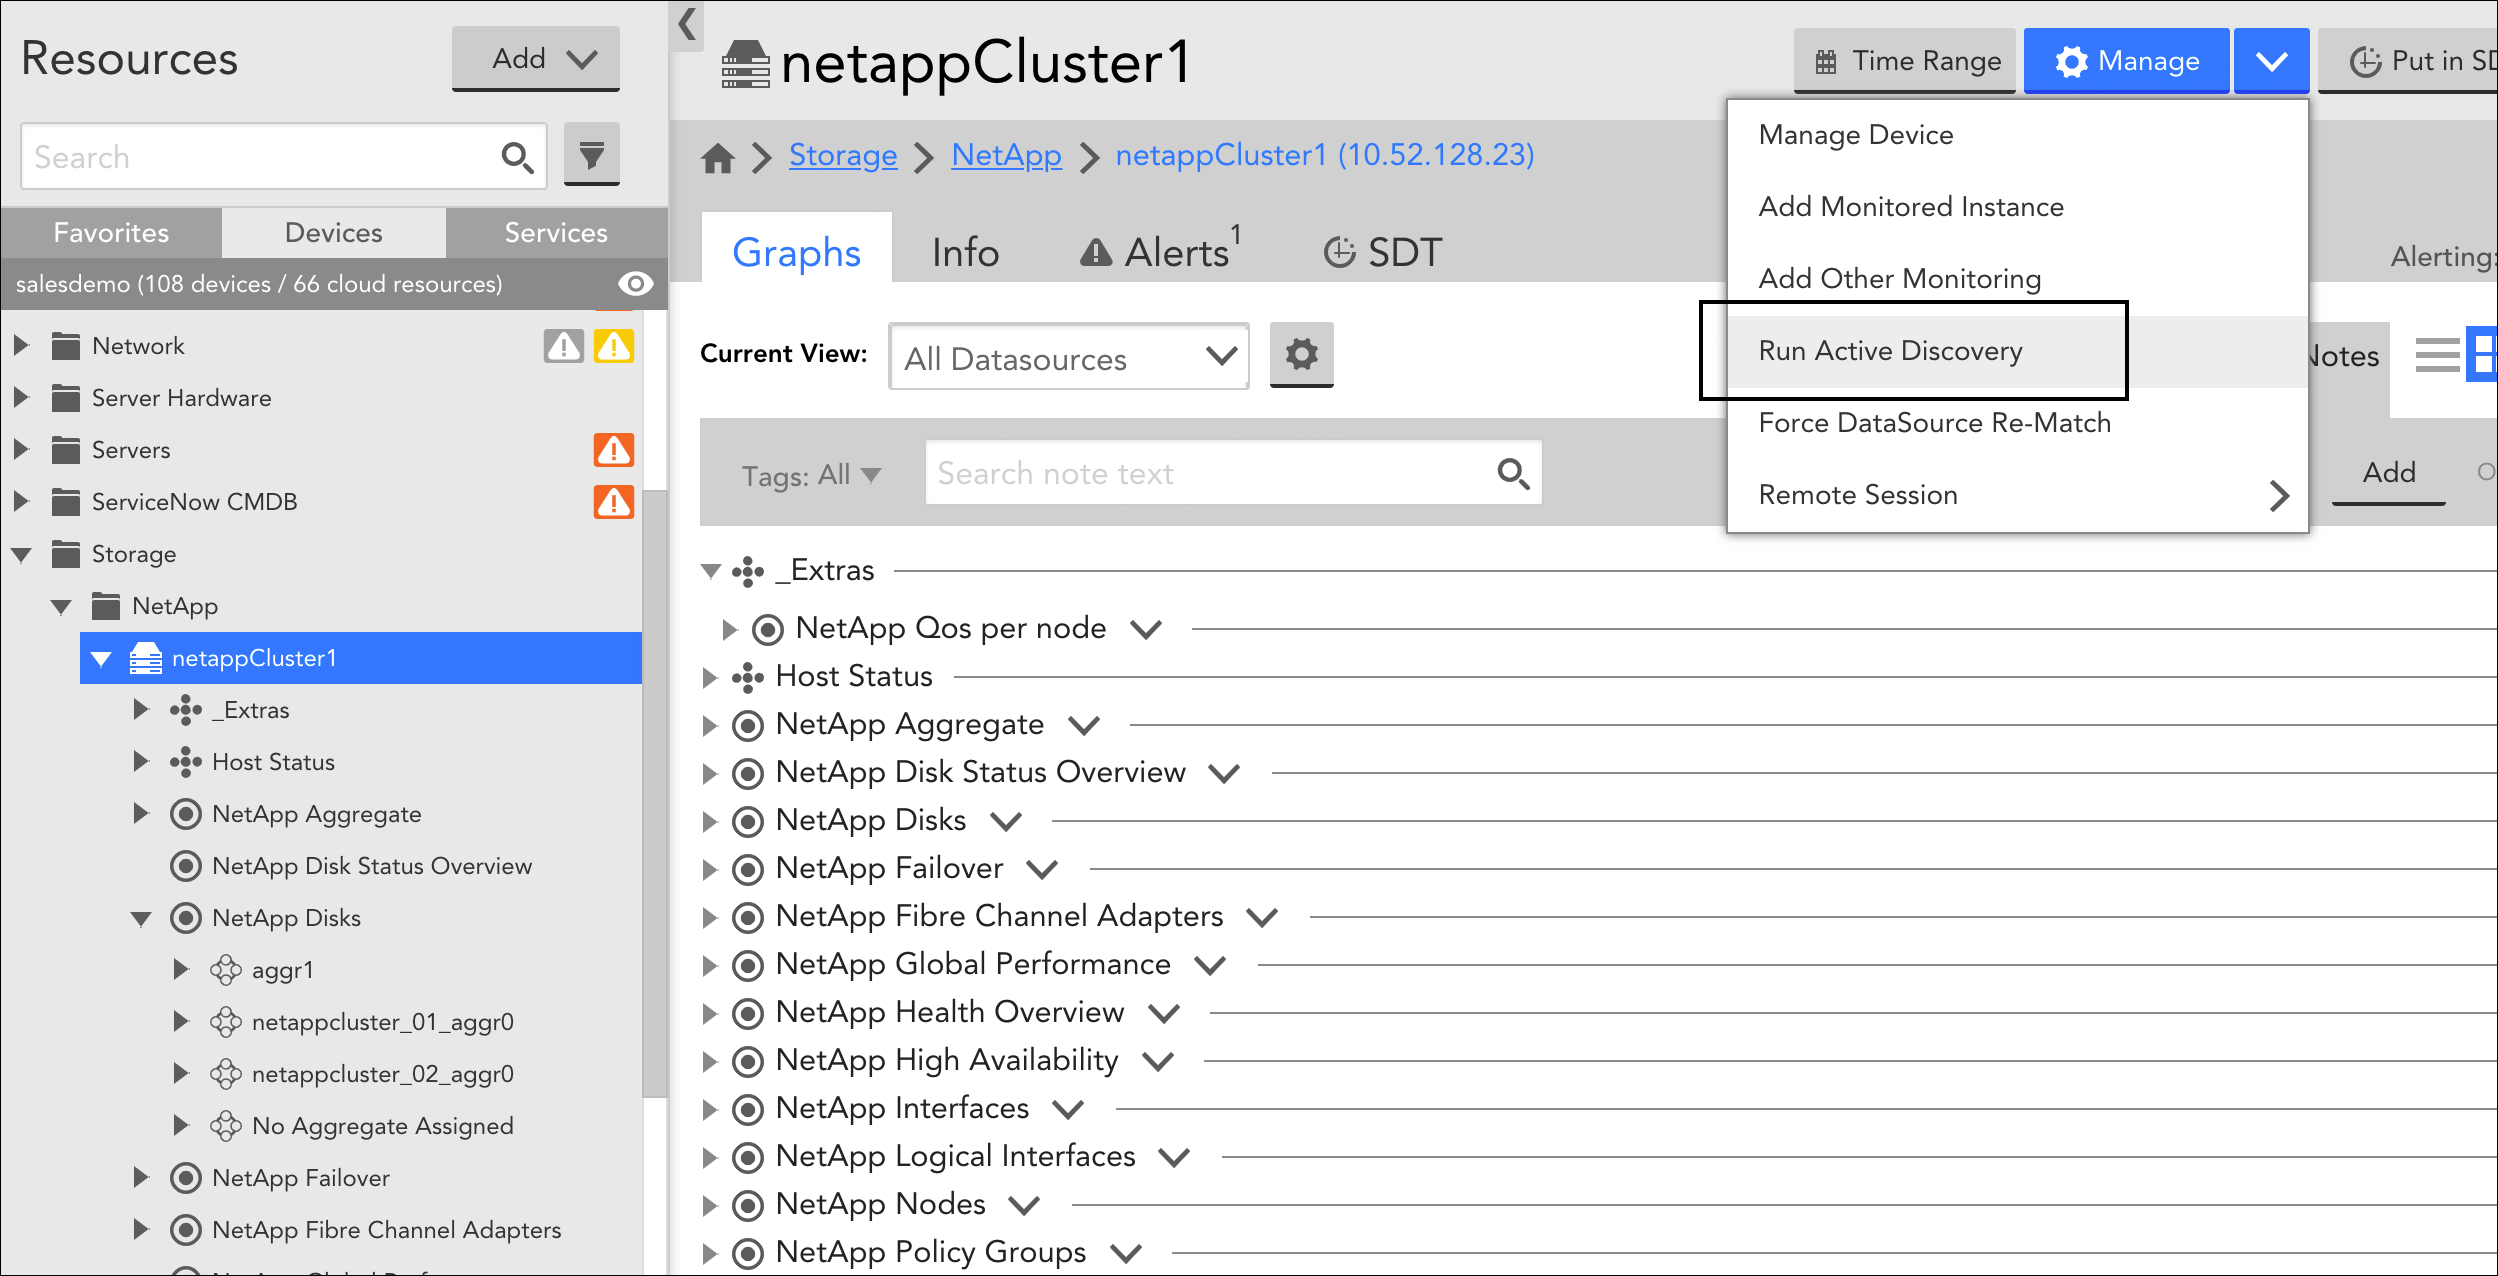
All multi-instance DataSources that are applied to the device and have Active Discovery enabled will execute the Active Discovery process.
Note: The act of manually initiating Active Discovery for a resource also causes the reevaluation of all PropertySources and DataSources in your account in terms of their application to the current resource, as discussed in Creating PropertySources and How DataSources Get Applied to Resources respectively. In addition, LogicMonitor will perform a basic system information discovery check, as discussed in Resource and Instance Properties.
Manually Adding Instances
Multi-instance DataSources that do not have Active Discovery enabled require that instances be added manually. An example of a multi-instance DataSource for which it may be appropriate to not enable Active Discovery is one that applies to an application that runs on a different port per device, and the list of ports is not exclusive to the application. In this case, it may be most efficient to manually add an instance of the application, specifying the port.
To manually add an instance into monitoring, follow these steps:
- Navigate to the Resources page and, from the Resources tree, highlight the device for which you’d like to initiate Active Discovery.
- Click the device icon in the upper right corner of the Resources page and select “Add Monitored Instance” from the dropdown that appears.
- At the Add Monitored Instance dialog, complete the following configurations:
- DataSource. From the DataSource field, select the DataSource for which you are adding an instance to be monitored. This field provides matching suggestions as you type and you must choose from one of the suggested options. Only multi-instance DataSources that have been applied to the current device and do not have Active Discovery enabled from their configurations are available for selection here.
- Name. In the Name field, enter a name for the instance. Instance names are limited to 255 characters.
- Wildcard value. In the Wildcard value field, enter the value that will be used by the DataSource to query this specific instance. For example, the value could be a specific port or SNMP OID index.
Wildcard values are limited to 1024 characters. Ensure that you do not enter the following invalid ASCII characters as Wildcard values. They are: white space, :, =, \, and #. Note that # is valid but it can break Active Discovery (AD). You can replace these invalid ASCII characters with an underscore. Note that this could collide with other instances. For example, TEST_INSTANCE and TEST:INSTANCE can collide but it is reasonably rare.
- Description. In the Description field, enter a description for the instance.
- Group. From the Group field, select the instance group under which you would like to organize this instance. This field provides matching suggestions as you type and you must choose from one of the suggested options. If no instance groups have been explicitly set up, only the “@default” option is available which organizes the instance in the default “Ungrouped” group. For more information on instance groups, see Instance Groups.
