
Adding Instances
Last updated on 03 December, 2021Overview
For every DataSource applied to a device, LogicMonitor attempts to discover one or more instances to monitor. (For more information on how DataSources get applied to devices, see How DataSources Get Applied to Resources.)
Some DataSources will only ever have one instance to monitor per device (e.g. ping), while others may identify multiple instances (e.g. disks, server volumes, interfaces, etc.) to monitor per device.
For single-instance DataSources, the instance is automatically added and data collection begins immediately. For multi-instance DataSources, instances can be automatically added into monitoring via LogicMonitor’s Active Discovery process, or they can be manually added into monitoring. In the following sections, we’ll discuss both of these methods.
Adding Instances via Active Discovery
Active Discovery is automatically run for multi-instance DataSources that have it enabled. It is a process by which LogicMonitor determines all of the similar components of a particular type on a given system. For each component “discovered”, an instance is created and data is collected for that instance. For a detailed discussion of LogicMonitor’s Active Discovery process, see Active Discovery.
Active Discovery typically runs on a schedule that is configured from the DataSource definition. However, there may be situations in which you do not want to wait for the next scheduled execution of Active Discovery in order to add an instance into monitoring. In these situations, Active Discovery can be manually initiated.
Manually Initiating Active Discovery
Before manually initiating Active Discovery, ensure the DataSource and/or instance are not disabled at the group level as this will prevent instances from being added into monitoring.
To manually initiate Active Discovery, follow these steps:
- Navigate to the Resources page and, from the Resources tree, highlight the device for which you’d like to initiate Active Discovery.
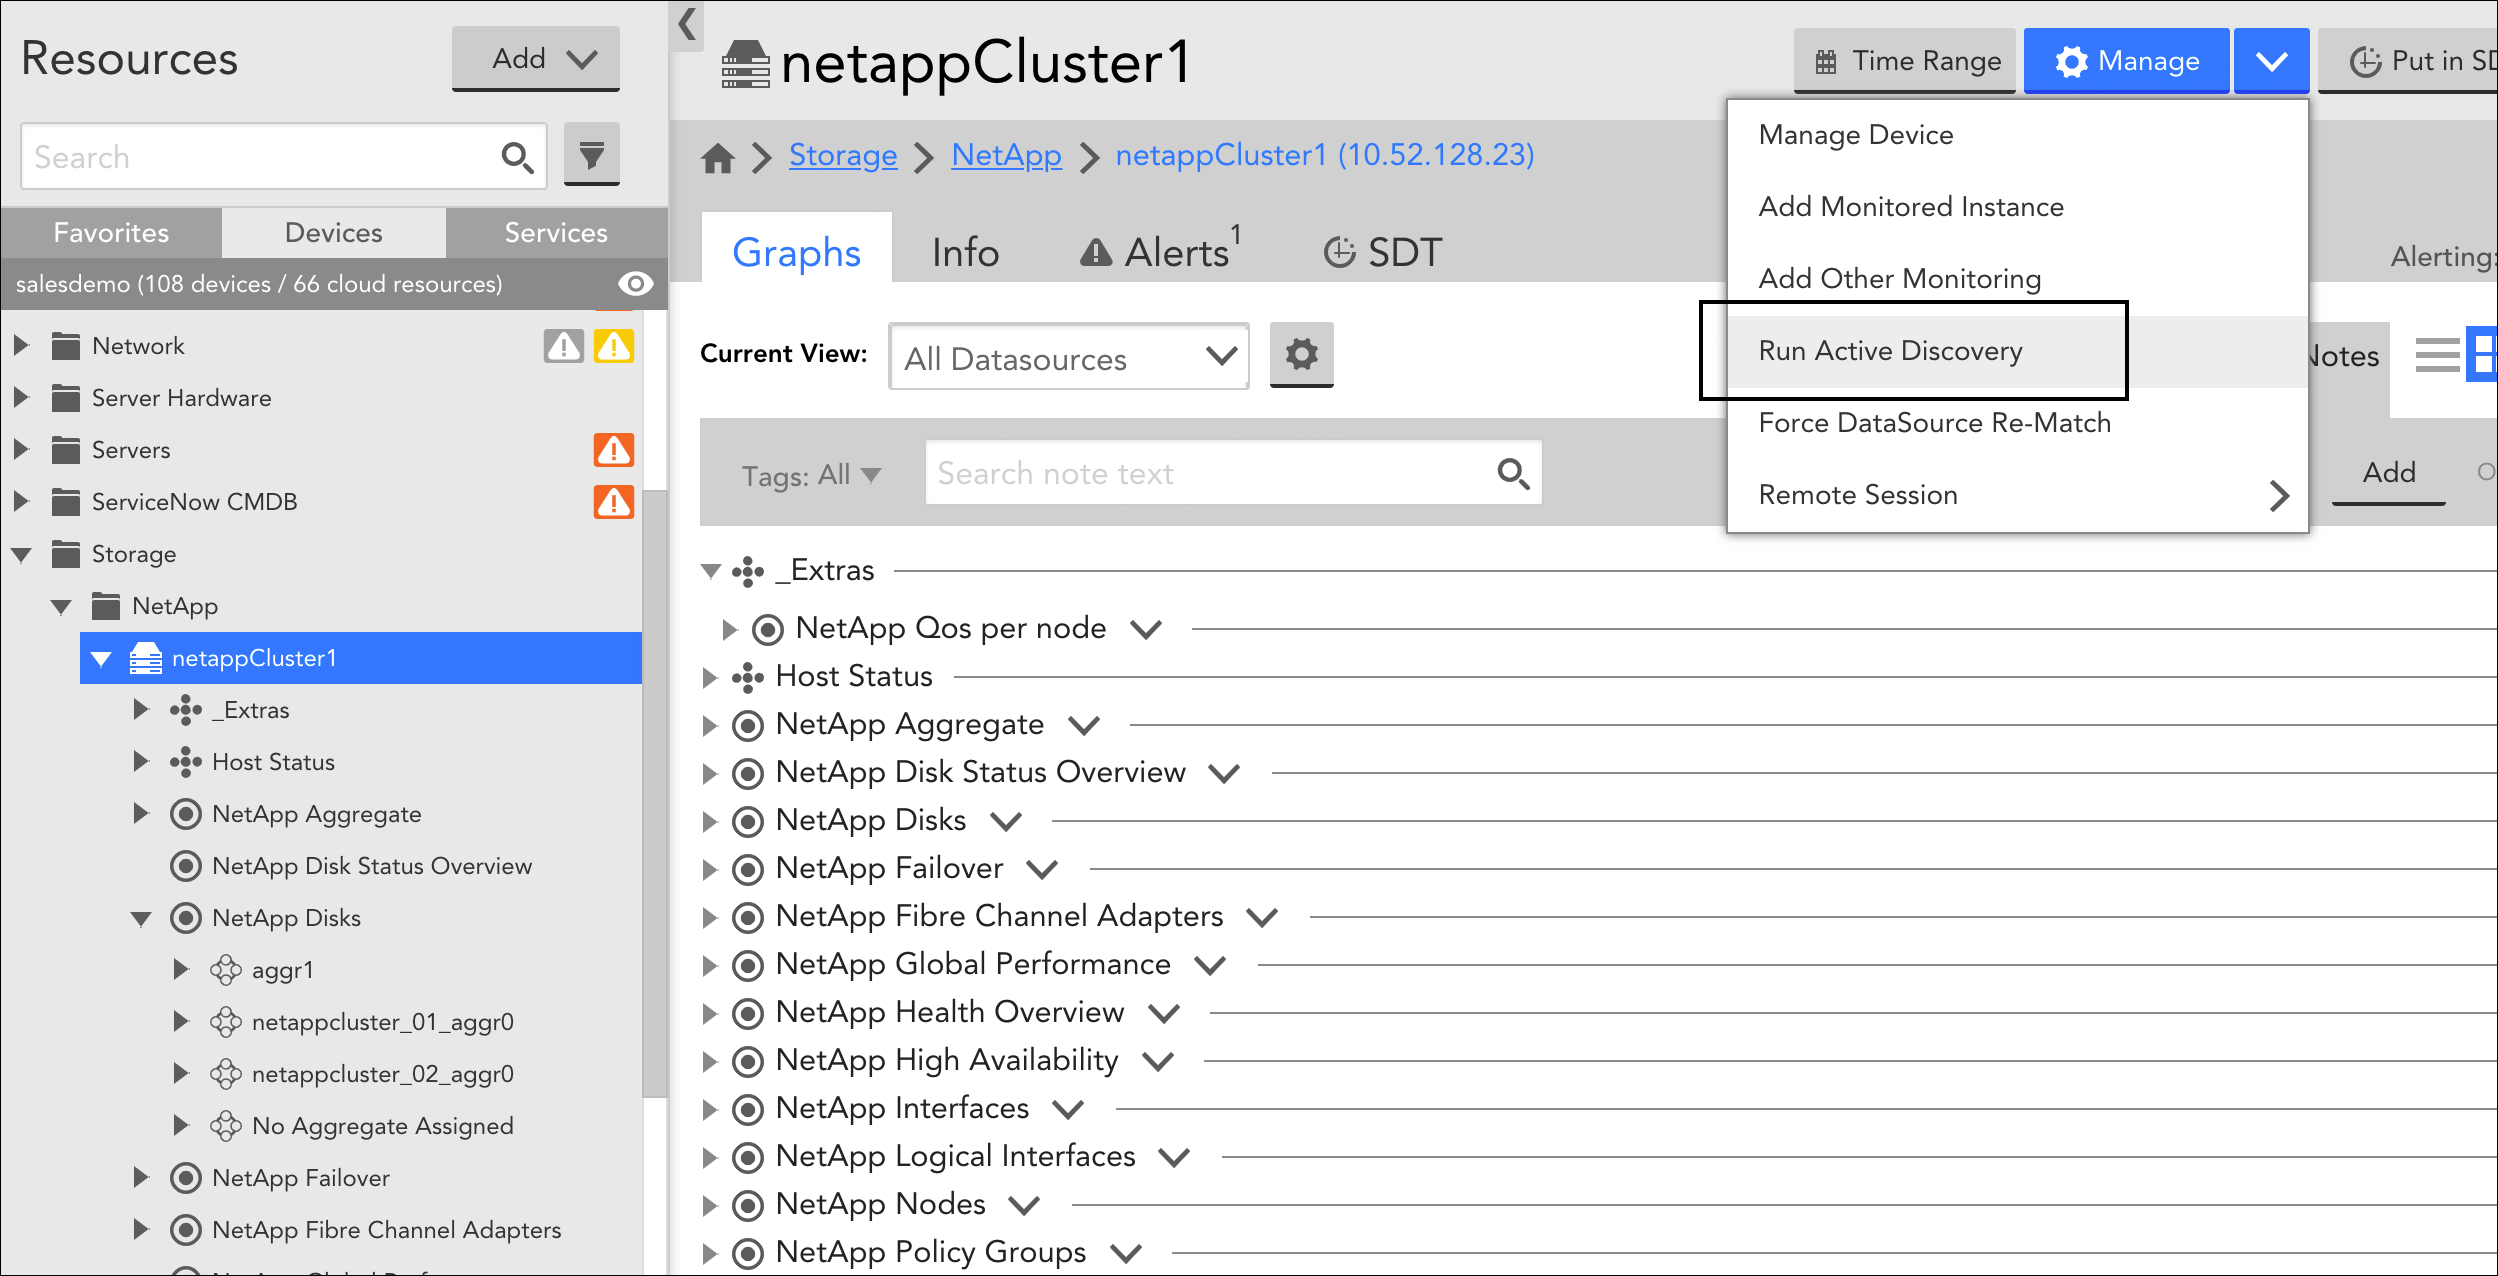
- Click the device icon in the upper right corner of the Resources page and select “Run Active Discovery” from the dropdown that appears.

All multi-instance DataSources that are applied to the device and have Active Discovery enabled will execute the Active Discovery process.
Note: The act of manually initiating Active Discovery for a resource also causes the reevaluation of all PropertySources and DataSources in your account in terms of their application to the current resource, as discussed in Creating PropertySources and How DataSources Get Applied to Resources respectively. In addition, LogicMonitor will perform a basic system information discovery check, as discussed in Resource and Instance Properties.
Manually Adding Instances
Multi-instance DataSources that do not have Active Discovery enabled require that instances be added manually. An example of a multi-instance DataSource for which it may be appropriate to not enable Active Discovery is one that applies to an application that runs on a different port per device, and the list of ports is not exclusive to the application. In this case, it may be most efficient to manually add an instance of the application, specifying the port.
To manually add an instance into monitoring, follow these steps:
- Navigate to the Resources page and, from the Resources tree, highlight the device for which you’d like to initiate Active Discovery.
- Click the device icon in the upper right corner of the Resources page and select “Add Monitored Instance” from the dropdown that appears.
- At the Add Monitored Instance dialog, complete the following configurations:
- DataSource. From the DataSource field, select the DataSource for which you are adding an instance to be monitored. This field provides matching suggestions as you type and you must choose from one of the suggested options. Only multi-instance DataSources that have been applied to the current device and do not have Active Discovery enabled from their configurations are available for selection here.
- Name. In the Name field, enter a name for the instance. Instance names are limited to 255 characters.
- Wildcard value. In the Wildcard value field, enter the value that will be used by the DataSource to query this specific instance. For example, the value could be a specific port or SNMP OID index.
Wildcard values are limited to 1024 characters. Ensure that you do not enter the following invalid ASCII characters as Wildcard values. They are: white space, :, =, \, and #. Note that # is valid but it can break Active Discovery (AD). You can replace these invalid ASCII characters with an underscore. Note that this could collide with other instances. For example, TEST_INSTANCE and TEST:INSTANCE can collide but it is reasonably rare.
- Description. In the Description field, enter a description for the instance.
- Group. From the Group field, select the instance group under which you would like to organize this instance. This field provides matching suggestions as you type and you must choose from one of the suggested options. If no instance groups have been explicitly set up, only the “@default” option is available which organizes the instance in the default “Ungrouped” group. For more information on instance groups, see Instance Groups.