


It’s natural for IT Ops teams to rely heavily on alert notifications when they are troubleshooting performance issues. It’s so common that we dedicated our most recent Advanced User webcast to the topic. The key takeaway from the webcast was that using LogicMonitor dashboards in combination with well-tuned alert notifications can significantly improve resolution time. Read on to learn some best practices for how to use the new shiny Dashboard NOC widget.
Troubleshooting begins the moment you receive alert notifications from LogicMonitor. While we recognize that how you investigate an alert varies from case to case, if your LogicMonitor dashboards are set up strategically they can help you identify the problem issue faster.
We recommend that you set up a dashboard to reflect each application. This means clearly showing the data and status for all of the different components of your application. For example, the following dashboard uses the new NOC widget to display the status of our backend web servers on the left hand side, the status of our load balancers in the center, and the status of our front end external services check on the right hand side:
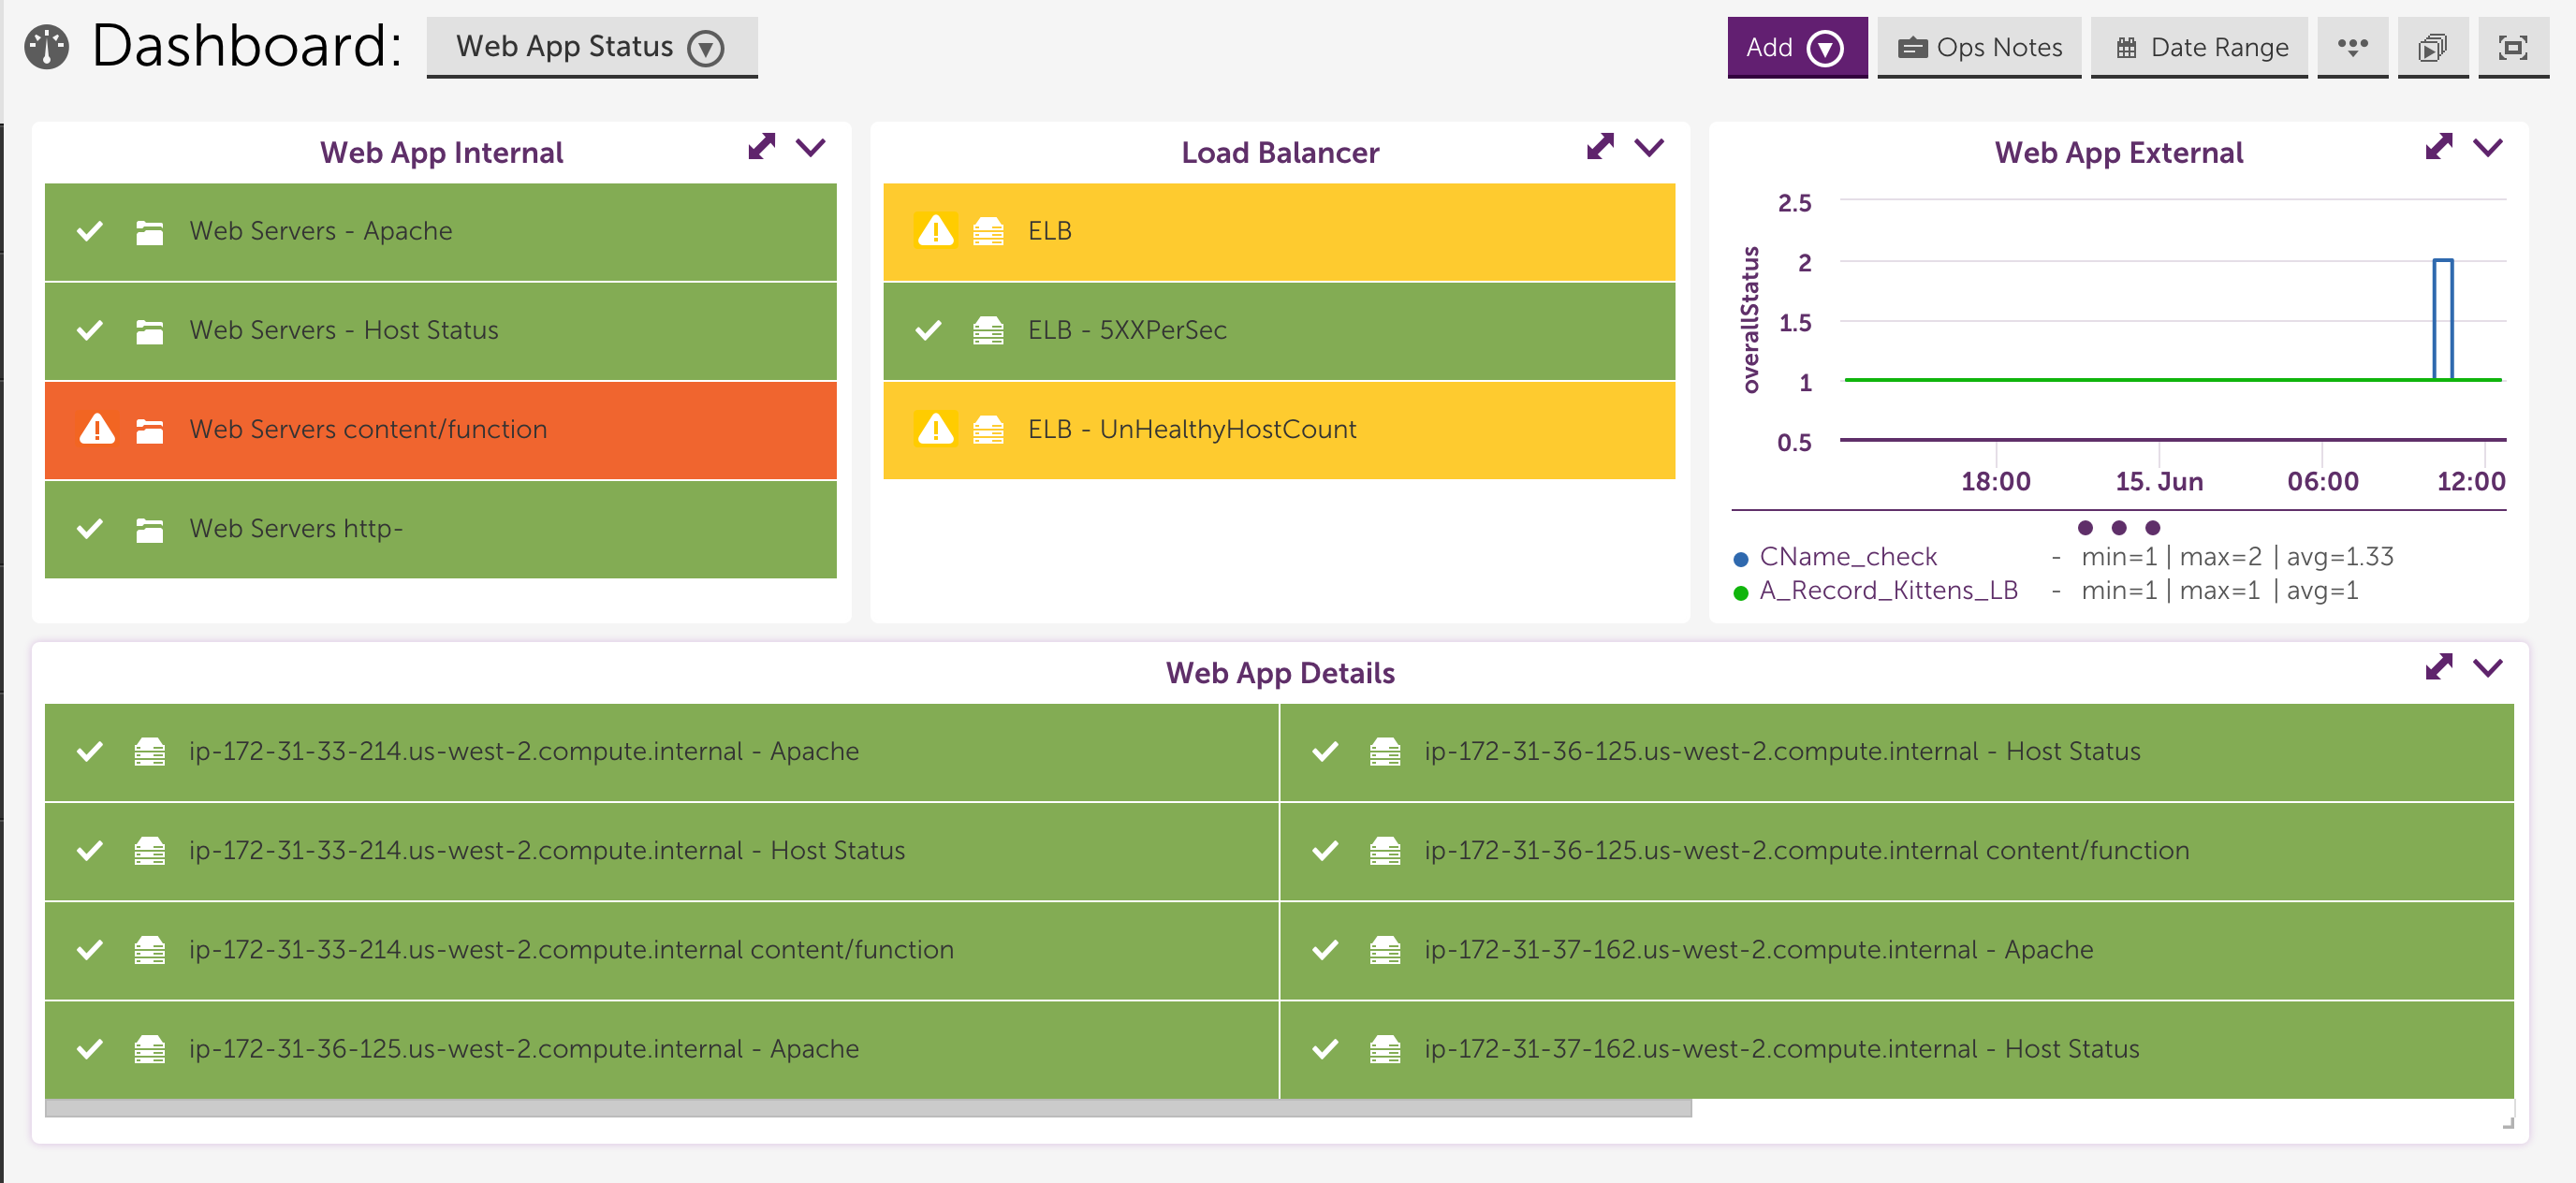
This arrangement is valuable because you can easily visualize how components of your application are performing, and how the different components relate to each other. When troubleshooting, using dashboards that reflect your application in combination with the alerts you receive from LogicMonitor helps you to think about the alerts in the context of your application. Without such dashboards, we have found that when customers receive an alert notification they tend to focus on what they are getting alerted for, rather than think about the health of the application, or what they may be overlooking by focusing on alerts.
As an example, consider the case where alerts are received indicating a website is down from the external SiteMonitor checks, and the load balancer reports multiple backend servers down. A common reaction in this situation is to assume the issue is with the web servers – as the load balancer reported the backends down, this is not unreasonable, so investigation may begin by checking the web servers logs, restarting Apache, etc. However, by looking at the dashboard for this situation – it is immediately clear that the web servers themselves are fine.
By seeing the alerts in context, it is clear the problem is not with the web servers themselves, but with the communication between the load balancer and the web servers. This quickly narrows the investigation down to issues such as firewalls blocking the path, or content that is being used by the load balancer as health checks not being available. (Ideally, the monitoring would be checking the same health check content as well, so if this was the issue, it should be clearly evident from the monitoring.)
The resolution of most issues is easy – once you know where the real problem lies. Well planned dashboards can help you identify where that issue is.
In summary, ensure you do each of the following before your next operational issue:
- Comprehensively set up monitoring for each component of your application.
- Set up dashboards that reflect your application’s logical structure. Show the status of each component in your application so that you can quickly identify which components are working and which aren’t when a problem occurs. Include key performance indicators in graphical form on the dashboard – a great place to use top 10 graphs to present a lot of information effectively (Top 10 web servers by HTTP requests; by CPU, etc).
- Think about your alerts in the context of your application. When you receive an alert, review dashboards to identify which component of your application is driving the issue.
Interested in watching the webcast recording? Click here.
If you have ideas or requests for future advanced webinar topics please email [email protected].
Sarah Terry is on the Product Management team at LogicMonitor.