

AI Observability for GPUs, LLMs, Infrastructure, and Digital Experience
See how every layer of your AI service stack performs, from GPUs, LLMs, and infrastructure to internet performance and digital experience, so teams can resolve issues faster, control costs, and deliver more reliable AI services.
Turn AI complexity into control, cost savings, and better user experiences
Give teams one connected view of AI performance, infrastructure health, LLM behavior, and digital experience so they can move faster, troubleshoot smarter, and focus on what matters.
Improve GPU performance, reduce idle capacity, and avoid wasted spend by understanding when resources are healthy, saturated, overheating, underused, or overextended.
Catch runaway token usage, provider issues, latency spikes, and inefficient compute early so teams can protect budgets without slowing AI innovation.
Detect performance degradation before users feel it, reduce manual troubleshooting, and keep critical AI experiences running smoothly across infrastructure, applications, and digital touchpoints.
Quickly determine whether issues come from your infrastructure, the internet, cloud services, or third-party providers so teams can resolve disruptions faster and avoid wasted effort.
Prioritize incidents by user impact, service importance, region, and business risk so teams can cut through noise and act on what actually affects the business.
What you can do with AI Monitoring
Everything you need for AI Observability to monitor workloads, GPUs, LLMs, and user experience
LogicMonitor gives teams unified visibility across the AI service stack from infrastructure, GPUs, LLMs, APIs, vector databases, and cloud platforms to the Internet stack and digital experience, so they can understand how AI services are performing.
Unify AI workload, GPU, LLM, and experience telemetry in one platform
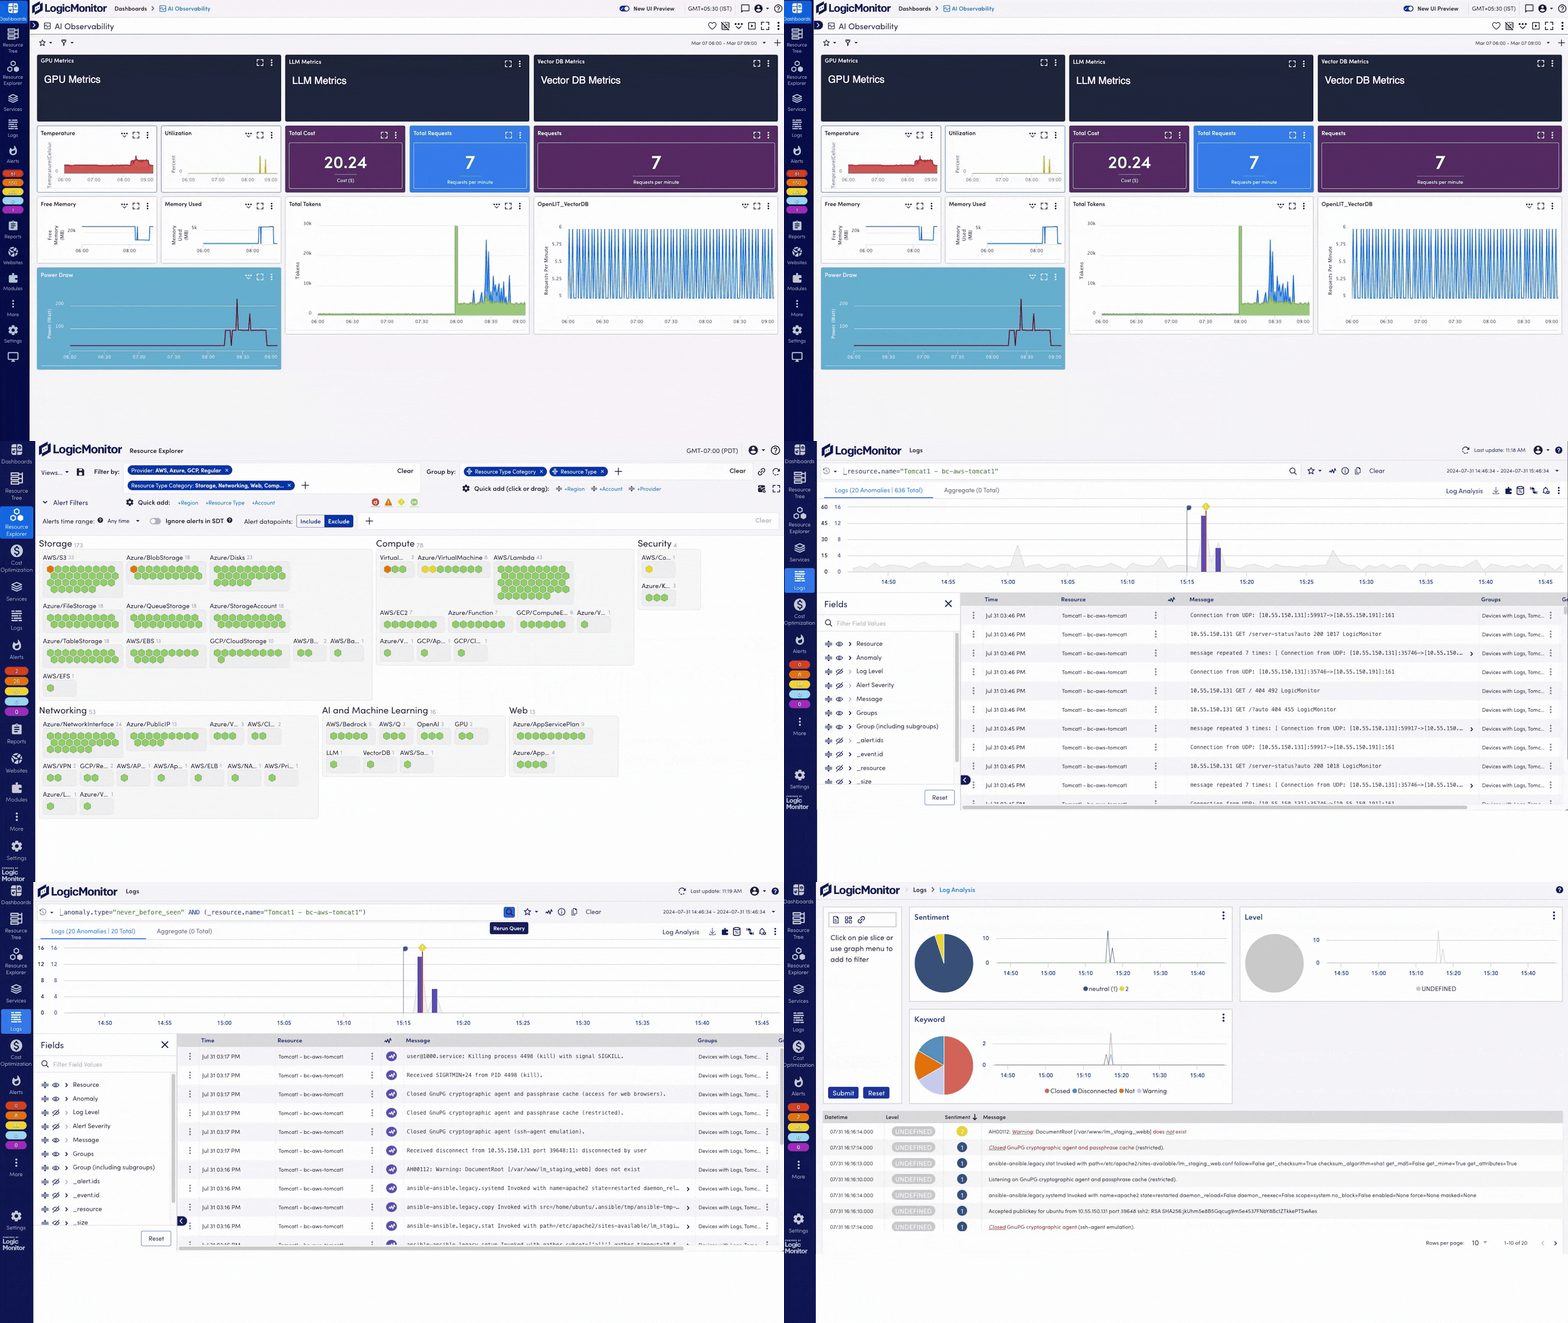
Bring GPU metrics, LLM performance, vector database stats, infrastructure health, internet performance, and digital experience signals into one view.
-
GPU monitoring Collect GPU utilization, memory usage, temperature, power draw, and cluster health for NVIDIA GPUs.
-
LLM monitoring Track token usage, API latency, error rates, cost per request, and provider performance across OpenAI, AWS Bedrock, Azure OpenAI, Google Vertex AI, and other model services.
-
Internet Performance Monitoring Add internet performance, synthetic monitoring, and real user experience data to understand how AI services perform.
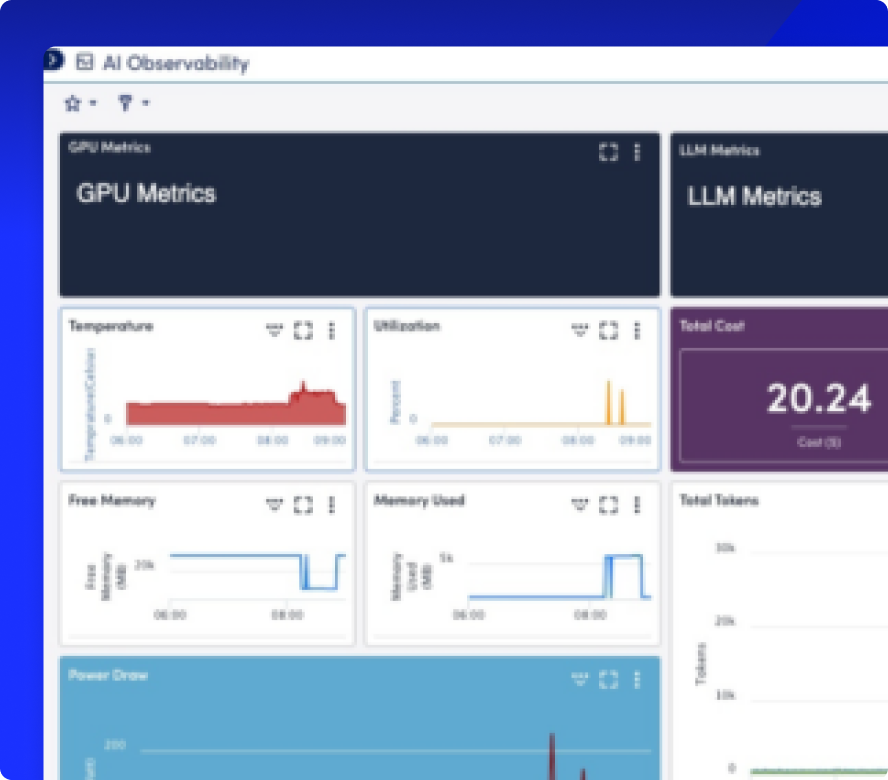
See AI workload performance, GPU health, and user impact in one view
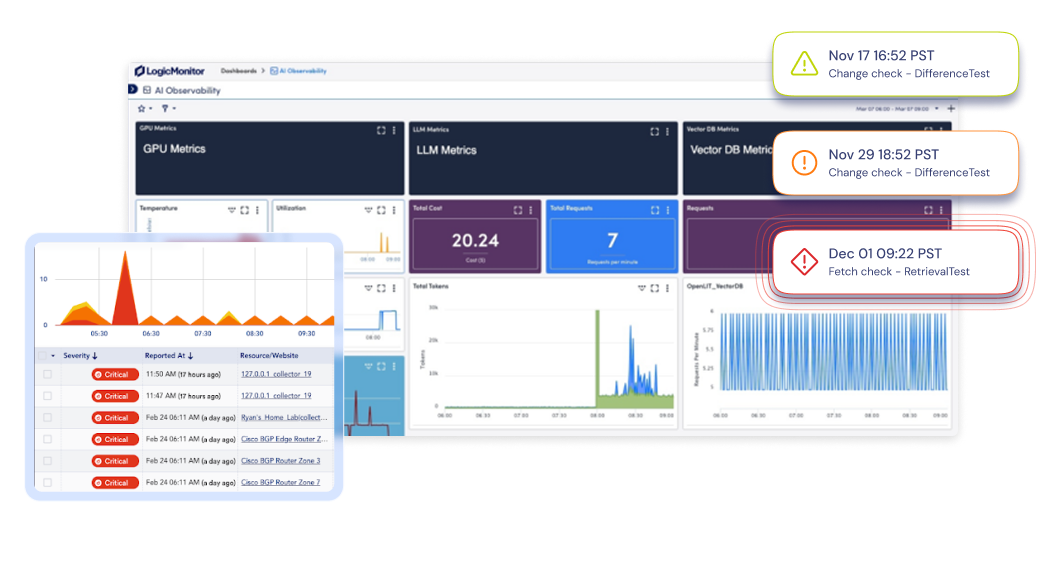
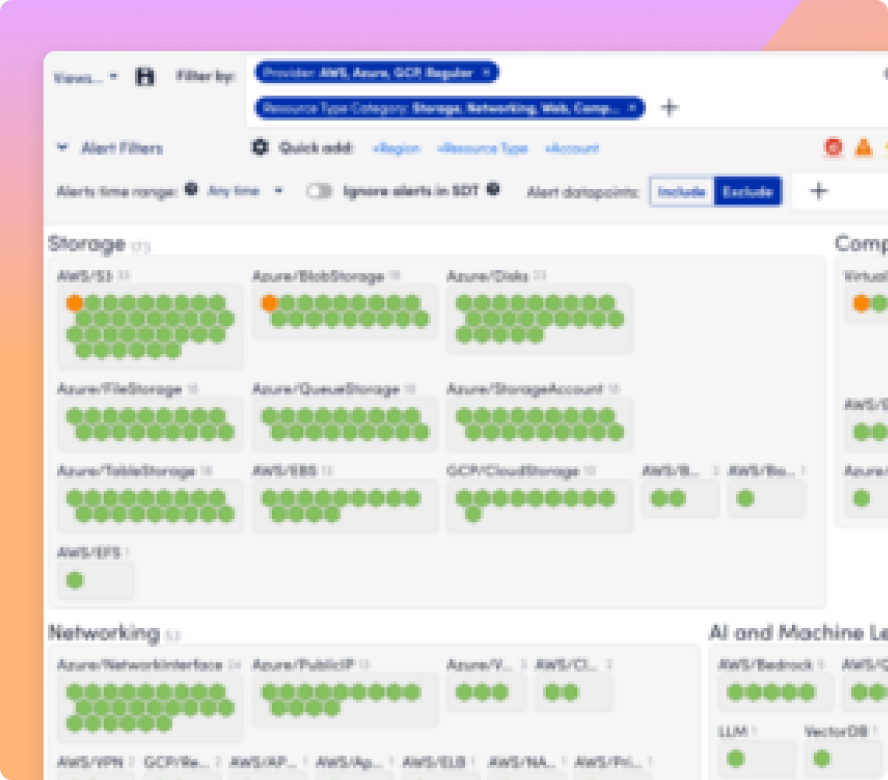
Display GPU, LLM, vector database, infrastructure, internet performance, and digital experience data side by side. Give teams a shared view of AI service health, cost, performance, and user impact.
-
Prebuilt templates Access ready-made AI-focused dashboards that ship with LM Envision.
-
Custom dashboards Build and arrange widgets via drag-and-drop to tailor views for any team or role.
-
User-impact dashboards Correlate AI backend performance with RUM, synthetic tests, and IPM data to show user impact.
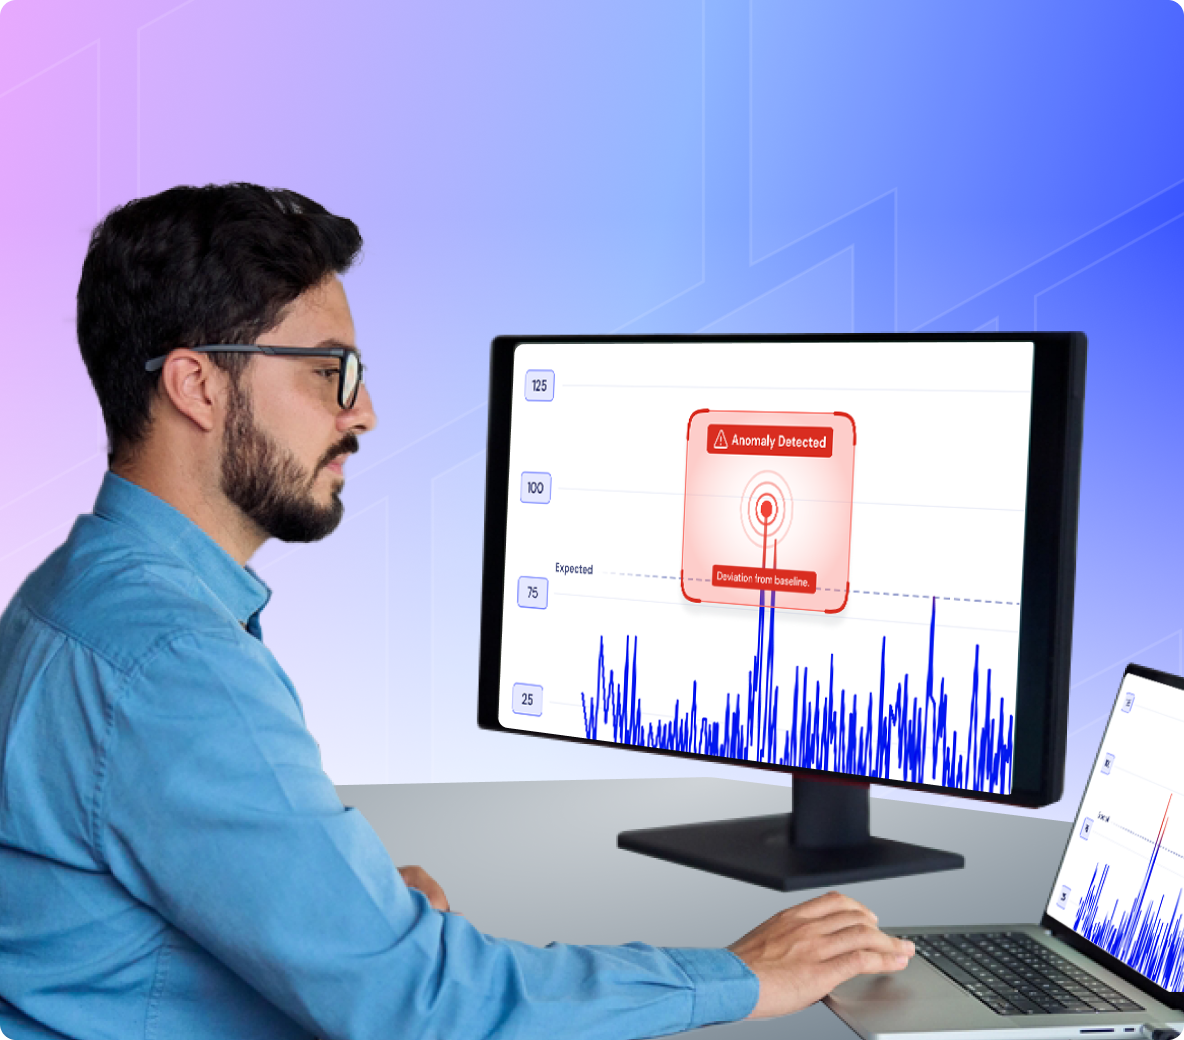
Reduce AI alert noise and prioritize incidents by service impact
Catch unusual behavior across AI workloads, GPUs, LLM APIs, infrastructure, internet dependencies, and user journeys.
-
Anomaly detection engine Automatically flag abnormal patterns across LLM latency, token usage, GPU saturation, API errors, and inference pipelines.
-
Experience-aware prioritization RUM and synthetic monitoring help teams understand whether AI performance issues are affecting users, regions, or digital journeys.
-
Internet dependency context IPM helps determine whether latency or availability issues stem from internal infrastructure or external internet, DNS, CDN, cloud, ISP, or third-party service dependencies.
Trace AI requests from the user to the internet path to LLM to GPU
Map inference pipelines, service relationships, cloud and on-prem topology, and internet delivery paths to pinpoint latency across the full AI transaction.
-
End-to-end AI request tracing Trace the path from user interaction to API gateway, LLM framework, vector database, GPU execution, external provider, and response.
-
Internet path and third-party dependency visibility Use Catchpoint to validate availability, latency, reachability, and provider performance across regions, networks, cloud, CDN, and SaaS dependencies.
-
AI service chain insights Correlate metrics from Kubernetes, LangChain, SageMaker, cloud AI services, APIs, and infrastructure with Catchpoint IPM and DEM signals to identify where performance breaks down.
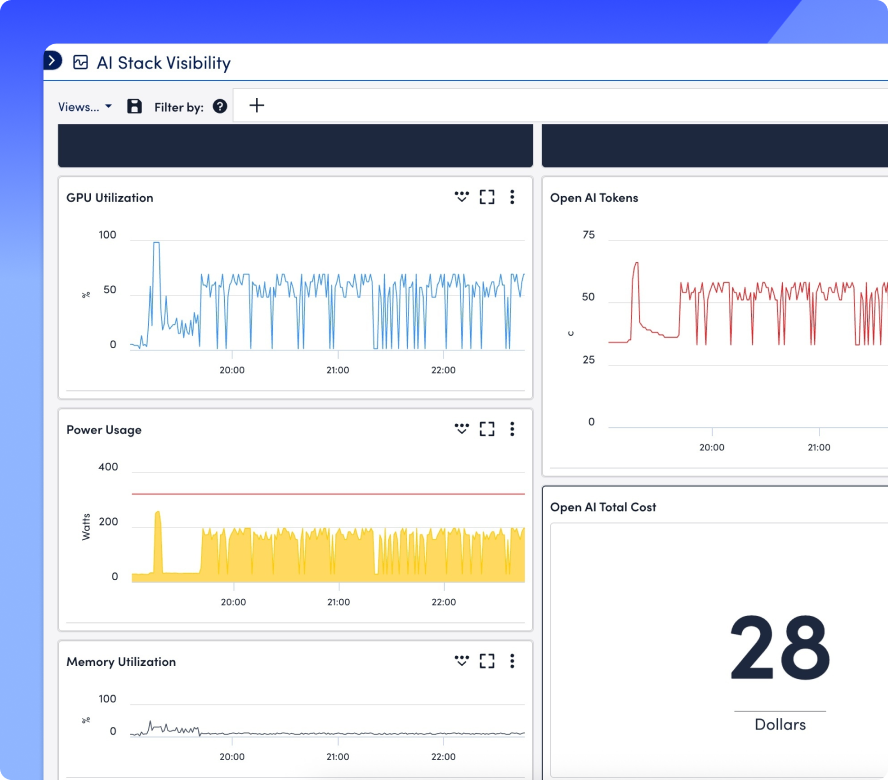
Track GPU, LLM, cloud, and delivery costs for AI workloads
Break down token usage, GPU utilization, cloud spend, and external delivery performance to identify waste and protect AI investments.
-
Token cost breakdown See AI spend by model, application, or team using built-in cost dashboards.
-
Idle resource detection Identify idle or under-utilized GPUs and vector-DB shards to highlight opportunities for consolidation.
-
Forecasting & budget alerts Apply historical metrics to forecast next month’s token spend or GPU usage and configure budget-threshold alerts.
-
Validate AI delivery investments Compare performance across cloud, CDN, network, and third-party providers to ensure AI services are delivered reliably and cost-effectively.
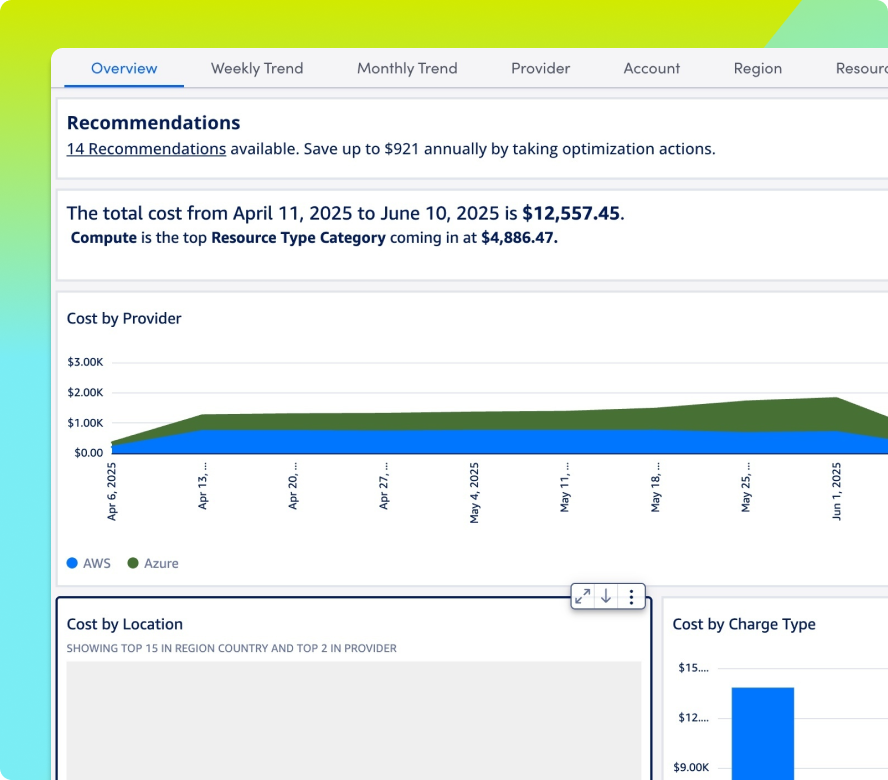
Secure and audit AI workloads across infrastructure, APIs, and access paths
Monitor AI-specific logs, API usage, infrastructure behavior, access patterns, and internet-facing dependencies to detect unusual activity and support audit readiness.
-
Unified security events Ingest security logs and alerts (firewall, VPN, endpoint) alongside AI-service events—flagging unauthorized API calls, unusual container launches, and data-store access anomalies.
-
Audit logging Store and export logs and metric snapshots for any point in time to support compliance (e.g., HIPAA, SOC 2) and audit reporting.
-
Monitor internet-facing AI services Track availability, reachability, and access behavior across public AI applications, APIs, and employee-facing AI tools to identify external exposure and performance risk.
INTEGRATIONS
Connected to everything that powers AI
LM Envision integrates with 3,000+ technologies, from infrastructure and ITSM tools to AI platforms and model frameworks. Ingest metrics from GPUs, LLMs, vector databases, and cloud AI services while syncing enriched incident context with tools like ServiceNow, Jira, and Zendesk automatically.
100%
collector-based and API-friendly
3,000+
integrations and counting
AI agent for ITOps
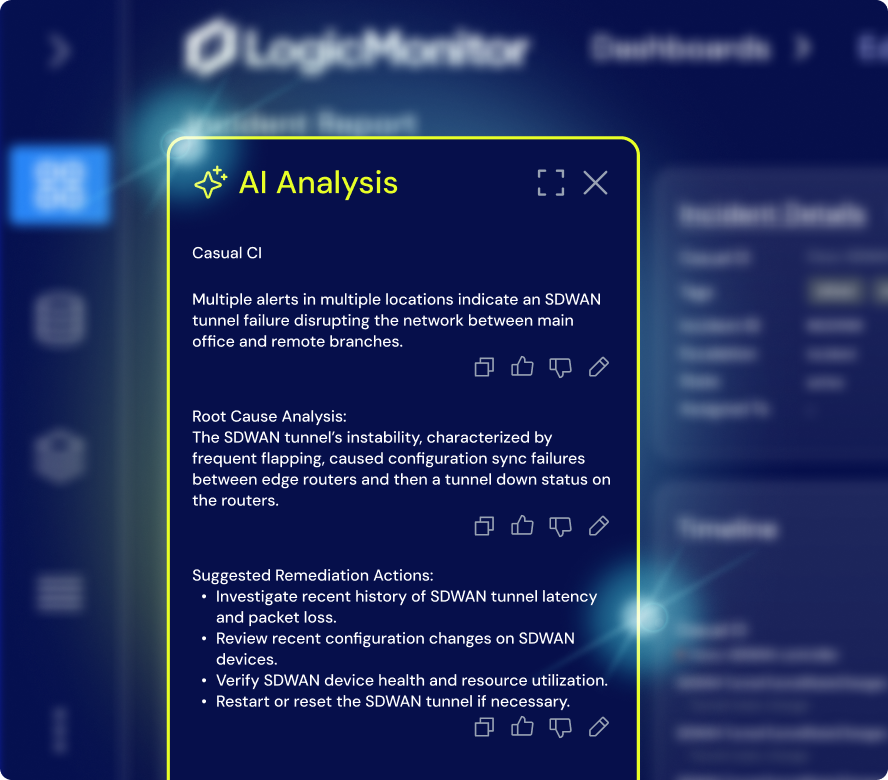
Let Edwin AI detect, explain, and help resolve issues automatically
Edwin AI applies agentic AIOps to streamline ITOps by cutting noise, automating triage, and driving resolution across even the most complex environments. No manual stitching. No swivel-chairing.
67%
ITSM incident reduction
88%
noise reduction
“LogicMonitor is a valuable partner, constantly innovating and adapting to our business needs.”

“Capital Group has 1,000+ alerts/ day. LogicMonitor will eliminate that noise.”

“The sheer power of LogicMonitor’s monitoring capability is amazing.”

“Edwin AI cut noise by 90% & ITSM incidents by 76%, enabling better customer service.”

By the numbers
AI observability that delivers real results
Get anwers
FAQs
Get the answers to the top AI monitoring questions.
What is AI observability?
AI observability gives teams end-to-end visibility into the full AI service stack, from infrastructure, GPUs, APIs, and models to vector databases, data pipelines, and digital experience. It helps teams connect performance, reliability, cost, and user experience signals, so they can detect issues faster, optimize resources, and keep AI services running reliably at scale.
What is AI workload monitoring?
AI workload monitoring gives teams visibility into the full stack behind production AI applications, from infrastructure, GPUs, and containers to APIs, models, vector databases, and data pipelines. It helps ITOps teams connect performance, reliability, and cost signals across these systems, so they can detect issues faster, optimize compute, control costs, and keep AI services running reliably at scale.
How is AI observability different from AI workload monitoring?
AI workload monitoring focuses on the infrastructure, GPUs, containers, APIs, models, vector databases, and pipelines that power AI applications. AI observability is broader. It connects those workload signals with reliability, cost, model and provider behavior, and digital experience data, helping teams understand how issues across the AI service stack affect application performance and user experience.
Why do AI teams need unified observability across infrastructure, LLMs, GPUs, and digital experience?
AI services depend on many moving parts, including infrastructure, GPUs, APIs, models, vector databases, cloud platforms, internet paths, and user-facing applications. When those signals live in separate tools, teams lose time piecing together what happened. Unified AI observability brings those signals into one view, helping teams troubleshoot faster, reduce blind spots, control costs, and understand how backend performance affects the user experience.
What types of AI systems can LogicMonitor help monitor?
LogicMonitor helps teams monitor production AI systems across infrastructure, GPUs, containers, Kubernetes, cloud AI services, APIs, LLM providers, vector databases, data pipelines, and internet-facing user experiences. This gives teams a connected view of the systems that power AI applications, from backend compute to end-user experience.
What is LLM monitoring?
LLM monitoring gives teams visibility into the performance, reliability, and cost of large language model services. By tracking availability, latency, token usage, error rates, provider behavior, and response quality, teams can understand how LLMs affect AI application performance and deliver more reliable AI experiences.
How does LogicMonitor support GPU monitoring?
LogicMonitor monitors GPU utilization, memory, temperature, power draw, and related infrastructure metrics across on-premises and cloud environments, helping teams spot saturation, idle resources, and bottlenecks.
Can LogicMonitor trace AI requests across the full service chain?
Yes. LogicMonitor helps teams trace AI service performance across the full request path, from user interaction to API gateway, LLM framework, vector database, GPU execution, external provider, and response. This helps teams pinpoint where latency, errors, or reliability issues appear across complex AI service chains.
How does Internet Performance Monitoring improve AI workload observability?
Internet Performance Monitoring improves AI workload observability by extending visibility beyond internal infrastructure and application telemetry. It help teams understand whether AI service issues are caused by internet paths, DNS, CDN, cloud platforms, third-party APIs, provider performance, or real user experience, so teams can isolate root cause faster and prioritize the issues that actually affect service delivery.
Can LogicMonitor’s Internet Performance Monitoring help monitor third-party AI providers?
Yes. LogicMonitor monitors AI infrastructure, workloads, and API telemetry, along with third-party APIs, cloud services, DNS, CDN, and internet routes affecting AI performance. The platform helps teams understand whether performance issues come from internal systems, external providers, or the delivery paths between them.
Why do AI services need digital experience monitoring?
AI applications rely on APIs, cloud platforms, CDNs, networks, and user workflows. Digital experience monitoring shows how users experience AI services in the real world, helping teams identify degradation earlier, validate service performance, and prioritize incidents by user impact.
How does AI monitoring help reduce costs?
AI monitoring helps teams identify where spend is being wasted across GPUs, token usage, cloud resources, vector databases, and external delivery paths. By tracking idle resources, usage spikes, inefficient compute, and provider performance, teams can optimize AI services without slowing innovation or compromising reliability.
How does AI observability help reduce alert noise?
AI observability helps teams connect alerts to service impact, user experience, and business risk. Instead of treating every infrastructure, GPU, API, or model issue the same way, teams can prioritize incidents based on what’s actually affecting users, regions, services, and critical AI workflows.
How does LogicMonitor help secure and audit AI workloads?
LogicMonitor helps teams monitor AI-specific logs, API usage, infrastructure behavior, access patterns, and internet-facing dependencies. By bringing security events, audit logs, and performance signals into one operational view, teams can detect unusual activity, investigate risk, and support compliance reporting.
Who uses AI observability?
AI observability is useful for ITOps, CloudOps, DevOps, platform engineering, SRE, and infrastructure teams responsible for keeping AI services reliable, performant, and cost-efficient. It also helps IT leaders understand how AI investments are performing across infrastructure, applications, providers, and user experience.
Own your AI performance
with LM Envision
with LM Envision