3 simple steps to Apache monitoring

What’s new in LogicMonitor? Explore the latest innovations advancing Autonomous IT

Proactively manage modern hybrid environments with predictive insights, intelligent automation, and full-stack observability.
Explore solutionsExplore our resource library for IT pros. Get expert guides, observability strategies, and real-world insights to power smarter, AI-driven operations.
Explore resources
Our observability platform proactively delivers the insights and automation CIOs need to accelerate innovation.
About LogicMonitor
Get the latest blogs, whitepapers, eGuides, and more straight into your inbox.
Your video will begin shortly
If you’re reading this, you already understand the importance of keeping your Apache web servers running smoothly. Whether it’s ensuring you stay within the limits of configured server workers, tracking how many requests are being handled, or guaranteeing maximum uptime, effective Apache monitoring is the key to maintaining server performance and reliability. Fortunately, setting up Apache monitoring is straightforward and can be done in just a few steps.
This guide will take you through a simple, step-by-step process to monitor your Apache servers effectively on operating systems like Windows, covering everything from enabling necessary modules to configuring alerts and integrating with monitoring tools. By the end, you’ll be able to proactively manage your server health, catch potential issues early, and optimize your system for peak performance.
If you are using a version of Apache that was installed by your OS’s package manager, there are OS specific ways to enable modules.
For Ubuntu/Debian:
/usr/sbin/a2enmod status
For Redhat/Centos: Just uncomment the line:
LoadModule status_module modules/mod_status.so
in /etc/httpd/conf/httpd.conf
For Suse derivatives:
add “status” to the list of modules on the line starting with APACHE_MODULES= in /etc/sysconfig/apache2
You want the following to be loaded in your apache configuration files.
ExtendedStatus On
<Location /server-status>
 SetHandler server-status
 Order deny,allow
 Deny from all
#Add LogicMonitor agent addresses here
 Allow from logicmonitor.com 192.168.10.10
</Location>
Where you set that configuration also changes depending on your Linux distribution.
/etc/apache2/mods-available/status.conf on Ubuntu/Debian
/etc/httpd/conf/httpd.conf on Redhat/CentOs
/etc/apache2/mod_status.conf on OpenSuse/SLES
Finally, restart apache using your OS startup script ( /etc/init.d/httpd restart or /etc/init.d/apache2 restart). Note that using the OS startup script is often necessary to allow the OS specific script files to assemble the final apache config. Sending apache signals, or using apache2ctl, does not do this.
If you are using LogicMonitor’s Apache monitoring, then you’re done. LogicMonitor will automatically detect the Apache web server, and apply appropriate monitoring and alerting, as well as alerting and graphing on the rest of the system, so you can correlate CPU, interface and disk load to Apache load.
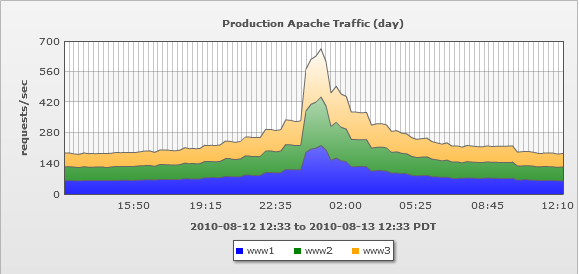
One thing you may want to customize is your dashboards – add a widget that collects all Apache requests/second, from all hosts, or all production hosts, and aggregates them into a single graph. Using LogicMonitor’s flexible graphs, the graph will automatically include new servers as you add them.

Establishing baselines for Apache performance metrics is crucial for effective network monitoring. Baselines help you understand what normal behavior looks like for your servers. By comparing real-time data against these baselines, you can quickly identify anomalies that may indicate issues such as increased traffic or hardware failures.
Automating alerts is a key way to reduce manual monitoring overhead and ensure timely responses to potential problems. By configuring automated alerts for critical metrics such as CPU load, memory usage, and error rates, you can receive notifications as soon as thresholds are exceeded. This proactive approach allows you to address issues before they escalate, minimizing downtime and ensuring consistent server performance.
Regularly analyzing trends in your monitoring data helps with capacity planning and optimizing performance. Use historical data to identify patterns, such as increased traffic during certain times or resource usage spikes. This enables you to make informed decisions about scaling infrastructure, optimizing configurations, and planning for future growth. Trend analysis also allows you to fine-tune alert thresholds to reduce false positives and improve the accuracy of your monitoring system.
Implementing tracing and automation workflows enhances Apache server monitoring by automating alerts and analyzing trends. Tracing tracks request paths, offering insights into response times, errors, and dependencies to identify bottlenecks and optimize performance.
Automation workflows enable you to streamline repetitive tasks such as log analysis, performance testing, and restarts. By automating these processes, you can focus on more critical tasks while ensuring consistency and efficiency in your monitoring efforts. Version pinning specifies exact software versions, reducing compatibility issues and simplifying troubleshooting.
LogicMonitor makes Apache monitoring simple, automating detection, alerts, and visualizations to keep your infrastructure running smoothly.
Monitoring your Apache http servers is essential for maintaining optimal performance, ensuring availability, and preventing issues before they escalate. By understanding key metrics, integrating powerful monitoring tools, and setting up proactive alerts, you can stay ahead of server problems and ensure your infrastructure remains healthy and efficient.
If you’re looking to simplify your Apache monitoring, consider using LogicMonitor. LogicMonitor automates the setup, detection, and visualization of your Apache environment, making it easier to identify issues, set up alerts, and aggregate critical metrics. With LogicMonitor, you can save time, reduce manual effort, and ensure comprehensive coverage of your Apache infrastructure.
© LogicMonitor 2026 | All rights reserved. | All trademarks, trade names, service marks, and logos referenced herein belong to their respective companies.
