


The 2018 Olympic games have proven to be exciting, featuring ground-breaking athletic feats, new world records, and unprecedented diplomacy (two countries that are normally mortal enemies playing under the same flag!).
The 2018 games are coming to a close, but it’s not too late to get in on the action. We created a one stop shop dashboard for Olympic data (using LogicMonitor, of course).
The dashboard includes:
- Medal count by country
- Historical all time medal standings by country
- Pyeongchang temperature and weather conditions
- NBC website performance
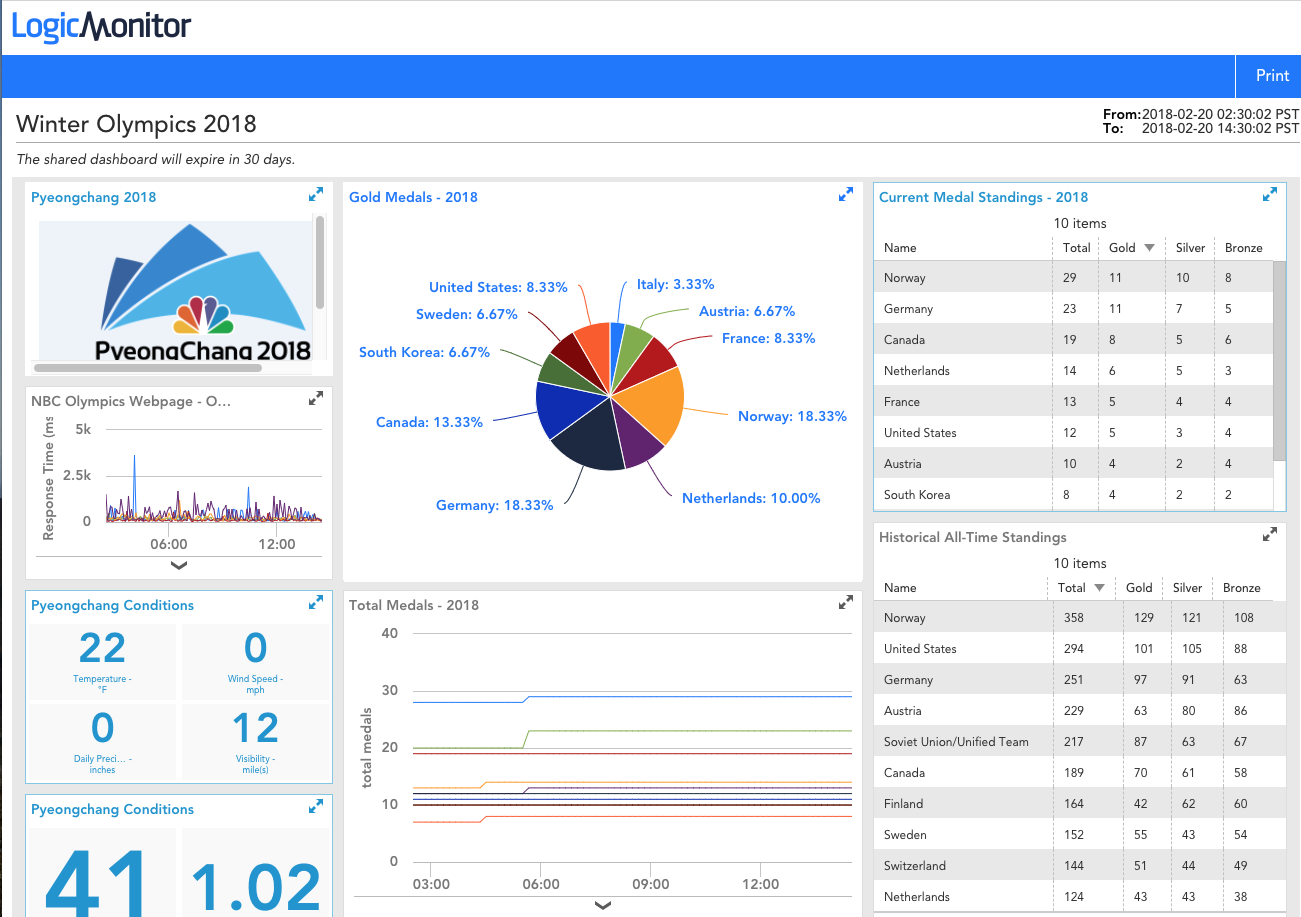
With LogicMonitor, you can monitor data from anywhere and display it in a beautiful, easy to consume dashboard. We’ve used it to monitor the (Star Wars) resistance, BBQs, beer taps and more!
Special thanks to Andrey Kitsen for building the dashboard.


You may also like

Elevate Summit 2024: LogicMonitor CMO on why it’s a must-attend event for IT professionals
LogicMonitor CMO Brooke Cunningham shares why Elevate Summit is a must-attend event for IT professionals, revealing exclusive details about the...

LogicMonitor’s latest innovations to optimize cloud performance and costs
Explore LogicMonitor's cutting-edge solutions revolutionizing cloud performance optimization, cost management, and network infrastructure monitoring. Unlock intelligent insights for efficient cloud...

AIOps strategy guide: How to achieve IT efficiency
Transform your IT operations with AIOps – our strategy guide unveils the keys to efficiency. Explore how AIOps tackles alert...
Subscribe to our blog
Get articles like this delivered straight to your inbox.