Golang Application Instrumentation for Distributed Traces
Use this guide to write a golang application emitting traces using the OpenTelemetry Protocol (OTLP) Specification. All you need is a basic understanding of developing applications in golang.
Use this guide to write a golang application emitting traces using the OpenTelemetry Protocol (OTLP) Specification. All you need is a basic understanding of developing applications in golang.
Init the Project
To get started, create a new directory structure by using the following code snippet and run the command go mod init github.com/<Username>/simple-go-service in the same directory. Replace the “Username” with your github username. This will create a go.mod file, which is used by Go to manage imports. Then, create a new file named main.go where we will place our Go code.
mkdir -p cmd/simple-service
go mod init github.com/USERNAME/simple-go-service
touch cmd/simple-service/main.go
Create Resource Detectors
The resource describes the object that generated the telemetry signals. Essentially, it must be the name of the service or application. OpenTelemetry has defined the standards to describe the service execution env, viz. hostname, hostType (cloud, container, serverless), namespace, cloud-resource-id, etc. These attributes are defined under Semantic Conventions or semcon. OpenTelemetry semantic conventions are agreed upon standardized naming patterns and the golang semantic conventions package can be found here.
In this example, we are defining the resource with a few env var settings of the application. Users can extend this detectResource method to detect resource attributes as per the underlying resource-providing infra (K8s-apiserver, cloud-api, any other discovery).
The exporter is the component in SDK responsible for exporting the telemetry signal (trace) out of the application to a remote backend, log to a file, stream to stdout. etc.
In this example, we are creating a gRPC exporter to send out traces to an OpenTelemetry receiver backend running on localhost:55680. Possibly an OpenTelemetry Collector. Users can extend it to support any application authentication mechanism using either mTLS or Application Auth token in gRPC headers.
Span processors are responsible for CRUD operations, batching of the requests for better QoS, Sampling the span data based on certain conditions. Here we are creating a batch Span Processor for batching the spans before flushing out to network via exporters.
OpenTelemetry propagators are used to extract and inject context data from and into messages exchanged by applications. The default propagator supported by OTEL is the W3C Trace Context encoding and W3C Baggage.
Package OTel provides global access to the OpenTelemetry API. The subpackages of the OTel package provide an implementation of the OpenTelemetry API.
The provided API is used to instrument code and measure data about that code’s performance and operation. The measured data, by default, is not processed or transmitted anywhere.
An implementation of the OpenTelemetry SDK, like the default SDK implementation, and associated exporters are used to process and transport this data – as we discussed in the exporters section.
In the example below, we are creating a tracer from the provider factory, configuring the context propagation for spans across multiple services. Finally, creating the tracer object. The tracer object is responsible for managing and creating spans.
The otel.Tracer creates a named tracer that implements the tracer interface. If the name is an empty string, then the provider uses the default name.
The span is a single execution of an operation. It is identified by a set of attributes, which are sometimes referred to as span tags. Application owners are free to choose the attributes which can capture required information for the spans. There is no limit to the number of span attributes per span.
In this example, we are defining two span attributes for our sample applications.
Here we are asking the tracer to start a span and end it once the execution goes out of scope.
var span trace.Span
ctx, span = tracer.Start(ctx, "HTTP GET /products/{id}")
defer span.End()
Add Events/Logs to Spans
Spans can be enriched with some execution logs/events that happened during the execution of the span. This information will help provide contextual logs tied up with the respective span.
Finally, we run this instrumented application to get traces in the LogicMonitor platform.
go run main.go
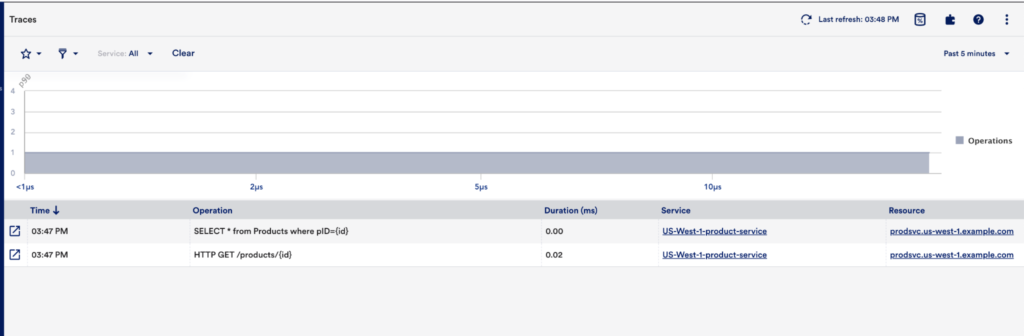
Traces received at LogicMonitor platform.
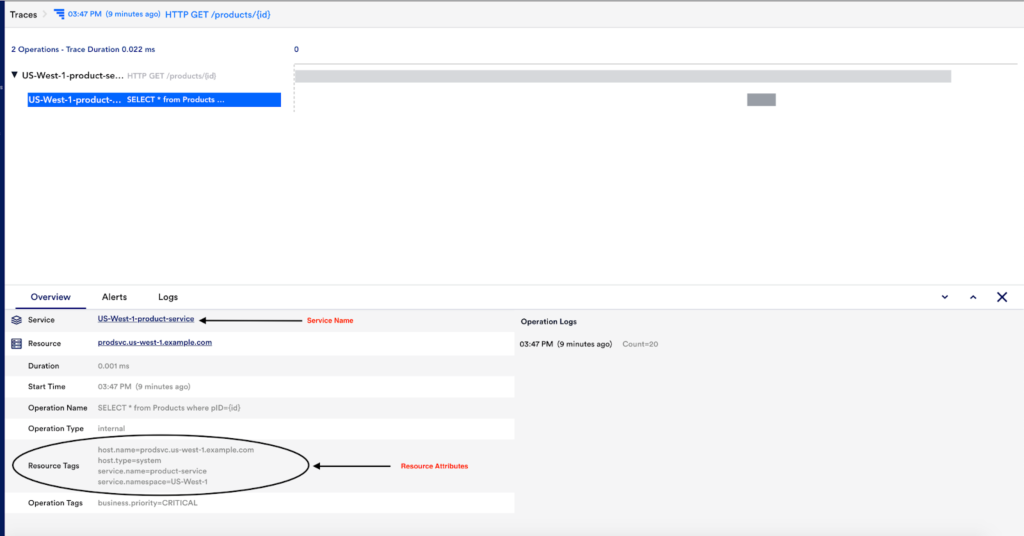
Detailed view of the span.
Constructed Trace
Resource labels:
    -> host.name: STRING(prodsvc.us-west-1.example.com)
    -> host.type: STRING(system)
    -> service.name: STRING(product-service)
    -> service.namespace: STRING(US-West-1)
InstrumentationLibrarySpans #0
InstrumentationLibrary example.com/basictracer
Span #0
    Trace ID   : aadf3c506b66cdbb3bdca3042f531353
    Parent ID  : eaf64b7cf9d4bdb8
    ID         : 45d9025bf40903d3
    Name       : SELECT * from Products where pID={id}
    Kind       : SPAN_KIND_INTERNAL
    Start time : 2021-07-20 09:55:42.609895 +0530 IST
    End time   : 2021-07-20 09:55:42.609896037 +0530 IST
    Status code : STATUS_CODE_OK
    Status message :
Attributes:
    -> business.priority: STRING(CRITICAL)
Events:
SpanEvent #0
    -> Name: Datababse
    -> Timestamp: 1626755142609896000
    -> DroppedAttributesCount: 0
    -> Attributes:
        -> Count: INT(20)
Span #1
    Trace ID   : aadf3c506b66cdbb3bdca3042f531353
    Parent ID  :
    ID         : eaf64b7cf9d4bdb8
    Name       : HTTP GET /products/{id}
    Kind       : SPAN_KIND_INTERNAL
    Start time : 2021-07-20 09:55:42.609884 +0530 IST
    End time   : 2021-07-20 09:55:42.609900603 +0530 IST
    Status code : STATUS_CODE_OK
    Status message :
Attributes:
    -> prod.env: STRING(UAT)
Events:
SpanEvent #0
    -> Name: Authentication
    -> Timestamp: 1626755142609891000
    -> DroppedAttributesCount: 0
    -> Attributes:
        -> Username: STRING(TestUser)
SpanEvent #1
    -> Name: Products
    -> Timestamp: 1626755142609893000
    -> DroppedAttributesCount: 0
    -> Attributes:
        -> ID: INT(100)
Conclusion
Congratulations, you’ve just written a golang application emitting traces using the OpenTelemetry Protocol (OTLP) Specification. You can use this code as a reference when you get started with instrumenting your business application with OTLP specifications. LogicMonitor APM specification is 100% OTLP compliant with no vendor lock-in. To receive and visualize traces of multiple services for troubleshooting with LogicMonitor platform sign up for a free trial account here. Check back for more blogs covering application instrumentation steps for distributed tracing with OpenTelemetry standards across multiple languages.
Disclaimer: The views expressed on this blog are those of the author and do not necessarily reflect the views of LogicMonitor or its affiliates.