Guide to Monitoring Custom Metrics on AWS EC2 Instances
What is the process for monitoring custom metrics on your AWS EC2 (Amazon Elastic Cloud Compute) Linux instances? The easy way is to use a LogicMonitor collector to monitor your Linux servers, which will provide much more detail and metrics than AWS monitoring provides.
4 min read
March 16, 2016
In this article
NEWSLETTER
Subscribe to our newsletter
Get the latest blogs, whitepapers, eGuides, and more straight into your inbox.
Thank you!
Your video will begin shortly
SHARE
In this article
What is the process for monitoring custom metrics on your AWS EC2 (Amazon Elastic Cloud Compute) Linux instances? The easy way is to use a LogicMonitor collector to monitor your Linux servers, which will provide much more detail and metrics than AWS monitoring provides. Using a collector means its easy to write your own datasources to extend what is collected, using all sorts of mechanisms (JMX, snmp, WMI, database queries, JSON or other HTTP output, etc.) – although you probably won’t need to.
However, if you don’t want the complete suite of LogicMonitor monitoring on your devices, and just want the cloudwatch metrics to show in LogicMonitor, LogicMonitor’s AWS integration will automatically pull in all the standard Cloudwatch metrics. But if you want to extend the Cloudwatch metrics – we’re going to use custom EC2 Linux memory metrics as an example (one of the standard metrics the Collector would get automatically for you) – and pull them into LogicMonitor, this step by step guide will show you how to do it.
As background, the default metrics for each of your EC2 instances are comprised of CPU, Disk, Network and Status. AWS provides the option, for a price, to add custom EC2 metrics to CloudWatch. This requires some configuration on the EC2 instance, within AWS itself, and through adding new datapoints to the existing EC2 datasource in your LogicMonitor portal. If you add AWS tags to your EC2 instances that are defined as Linux, it will make it easier to apply multiple EC2 instances to the new datasource that will be created.
To note, this blog post assumes you have taken the time to set tags. For this example we have used the AWS tag, “system.aws.tag.OS,” and set it to “Linux”. Check out this AWS article to learn how to setup the custom metrics for memory on the AWS EC2 Linux, and verify that the new custom metrics are visible within cloudwatch (illustrated in the image below).
Step 1: Setup Your AWS Account in LogicMonitor
LogicMonitor’s AWS monitoring requires an AWS Account and Read Only user to get started.
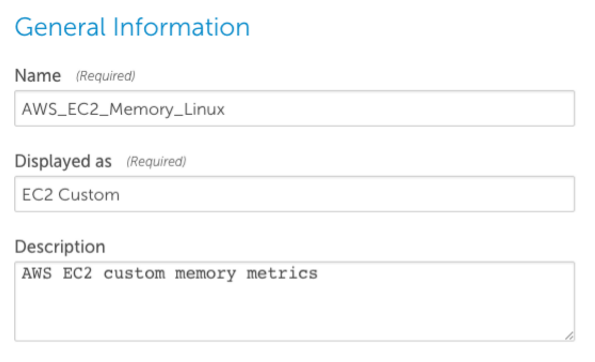
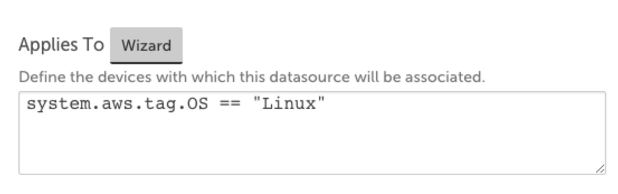
Step 2: Clone the AWS EC2 Datasource in LogicMonitor (see image below)
In Settings → LogicModules → Datasources, type “EC2” in the search.
Select the AWS_EC2 datasource and hit the clone button at the bottom of the page.
Name the new datasource to “AWS_EC2_Memory_Linux”.
Change the Displayed as name to “EC2 Custom”.
Set the Applies to field to match our tag that we set in AWS for Linux systems (in this case: “Linux”).
You can now select a datapoint toward the bottom of the new datasource and clone it.
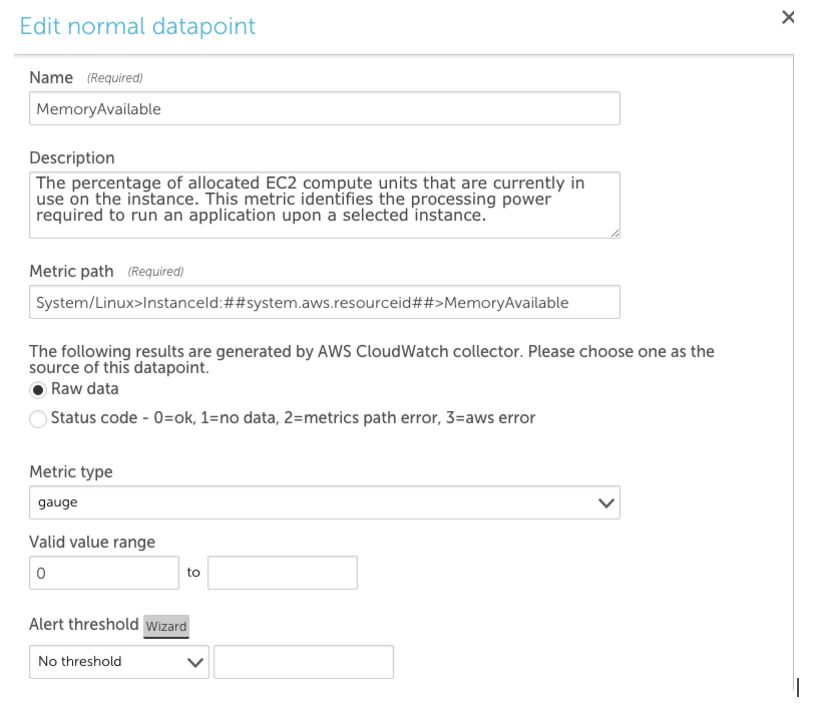
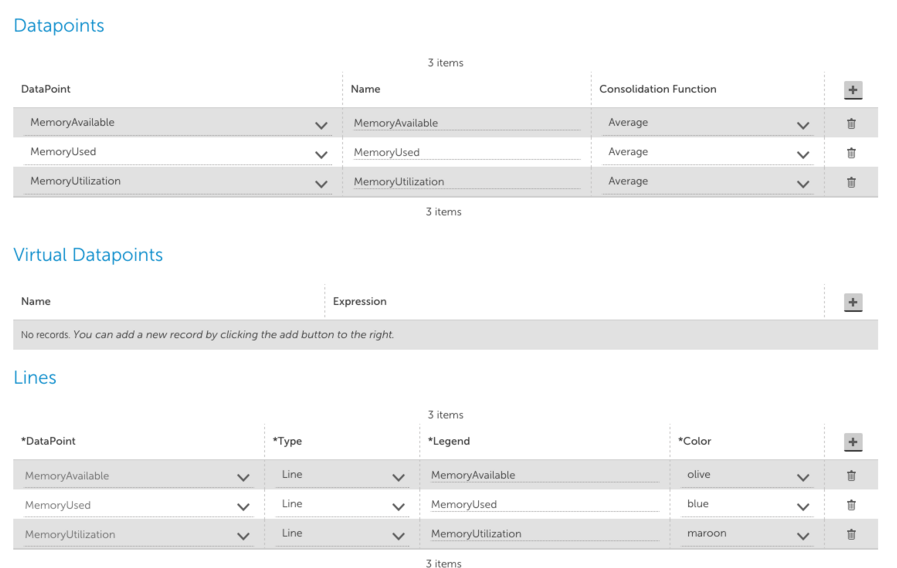
Step 3: Clone the CPU Utilization Datapoint and Change the Metric Path and Name (see image below)
Clone it for each new memory metric: MemoryAvailable, MemoryUsed and MemoryUtilization.
Change the metric paths in each of the new datapoints to match the new names:
Set the Alert Threshold in the data point via the dropdown to “No Threshold”.
Update the Description and save the new datapoint.
Step 4: Add a New Graph for Memory to the Datasource Showing New Values and Existing Graphs (see image below)
In the datasource, click the “Add Graph” button and name the new graph “Memory” (also make sure the graph name field specifically is set as “Memory”).
Set the label name to “Memory Stats”.
Add each of the datapoints and lines to the graph.
Save the datasource.
Step 5: Selecting EC2 Custom Instance in Devices Tab (see images below)
Go to the devices tab and while selecting the name of one of the Linux AWS EC2 instances, click the manage button and run active discovery – you should now see a new EC2 Custom instance.
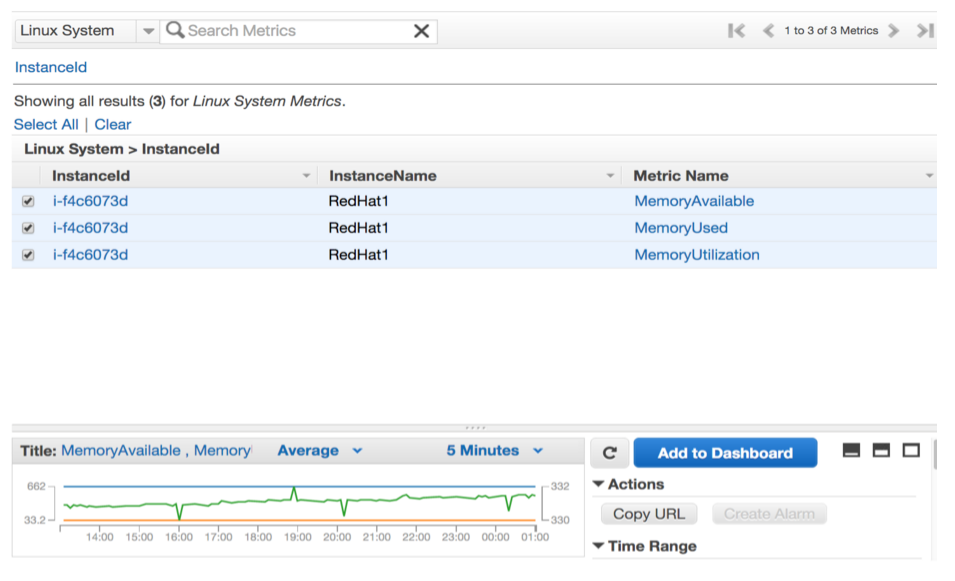
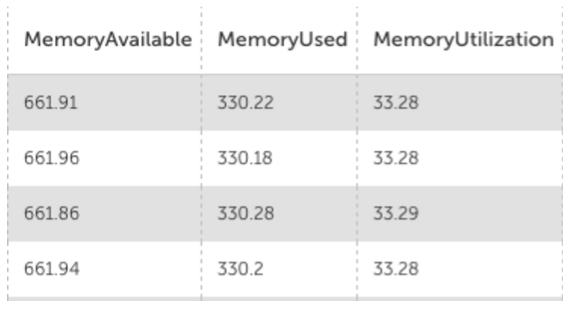
Select the EC2 Custom instance and look in the raw data tab to see the new memory fields (illustrated in the first image below).
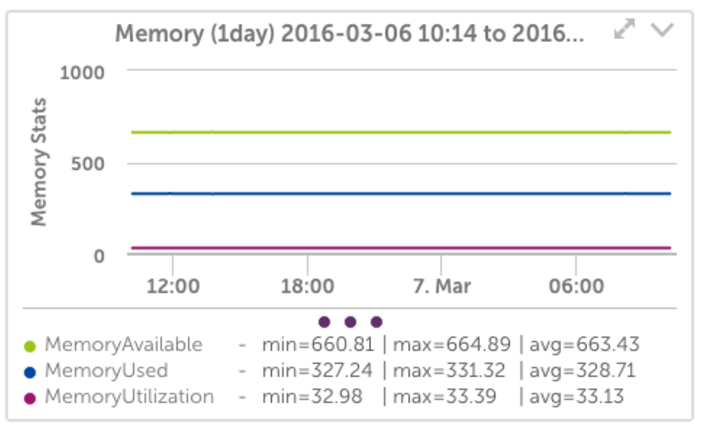
Then, select the graph tab to see the new Memory graph (illustrated in the second image below). To note, the Memory graph will take some time to populate.
That’s it, enjoy your new EC2 memory custom metrics in LogicMonitor!
Disclaimer: The views expressed on this blog are those of the author and do not necessarily reflect the views of LogicMonitor or its affiliates.