


If your technology involves collecting a lot of data, you might be using Elasticsearch. If you are, you will need to monitor your Elasticsearch cluster. Almost everything configurable with Elasticsearch can be managed through its extensive API. Likewise, a wealth of information about cluster and node health, as well as lower level shard and index metrics can be obtained from API calls. With LogicMonitor’s easily customizable datasources, it is simple to create a datasource to monitor this information.
Overall cluster health is one of the first things to look at and be alerted on. Through the Elasticsearch RESTful API endpoint /_cluster/health, the following json output can be obtained:
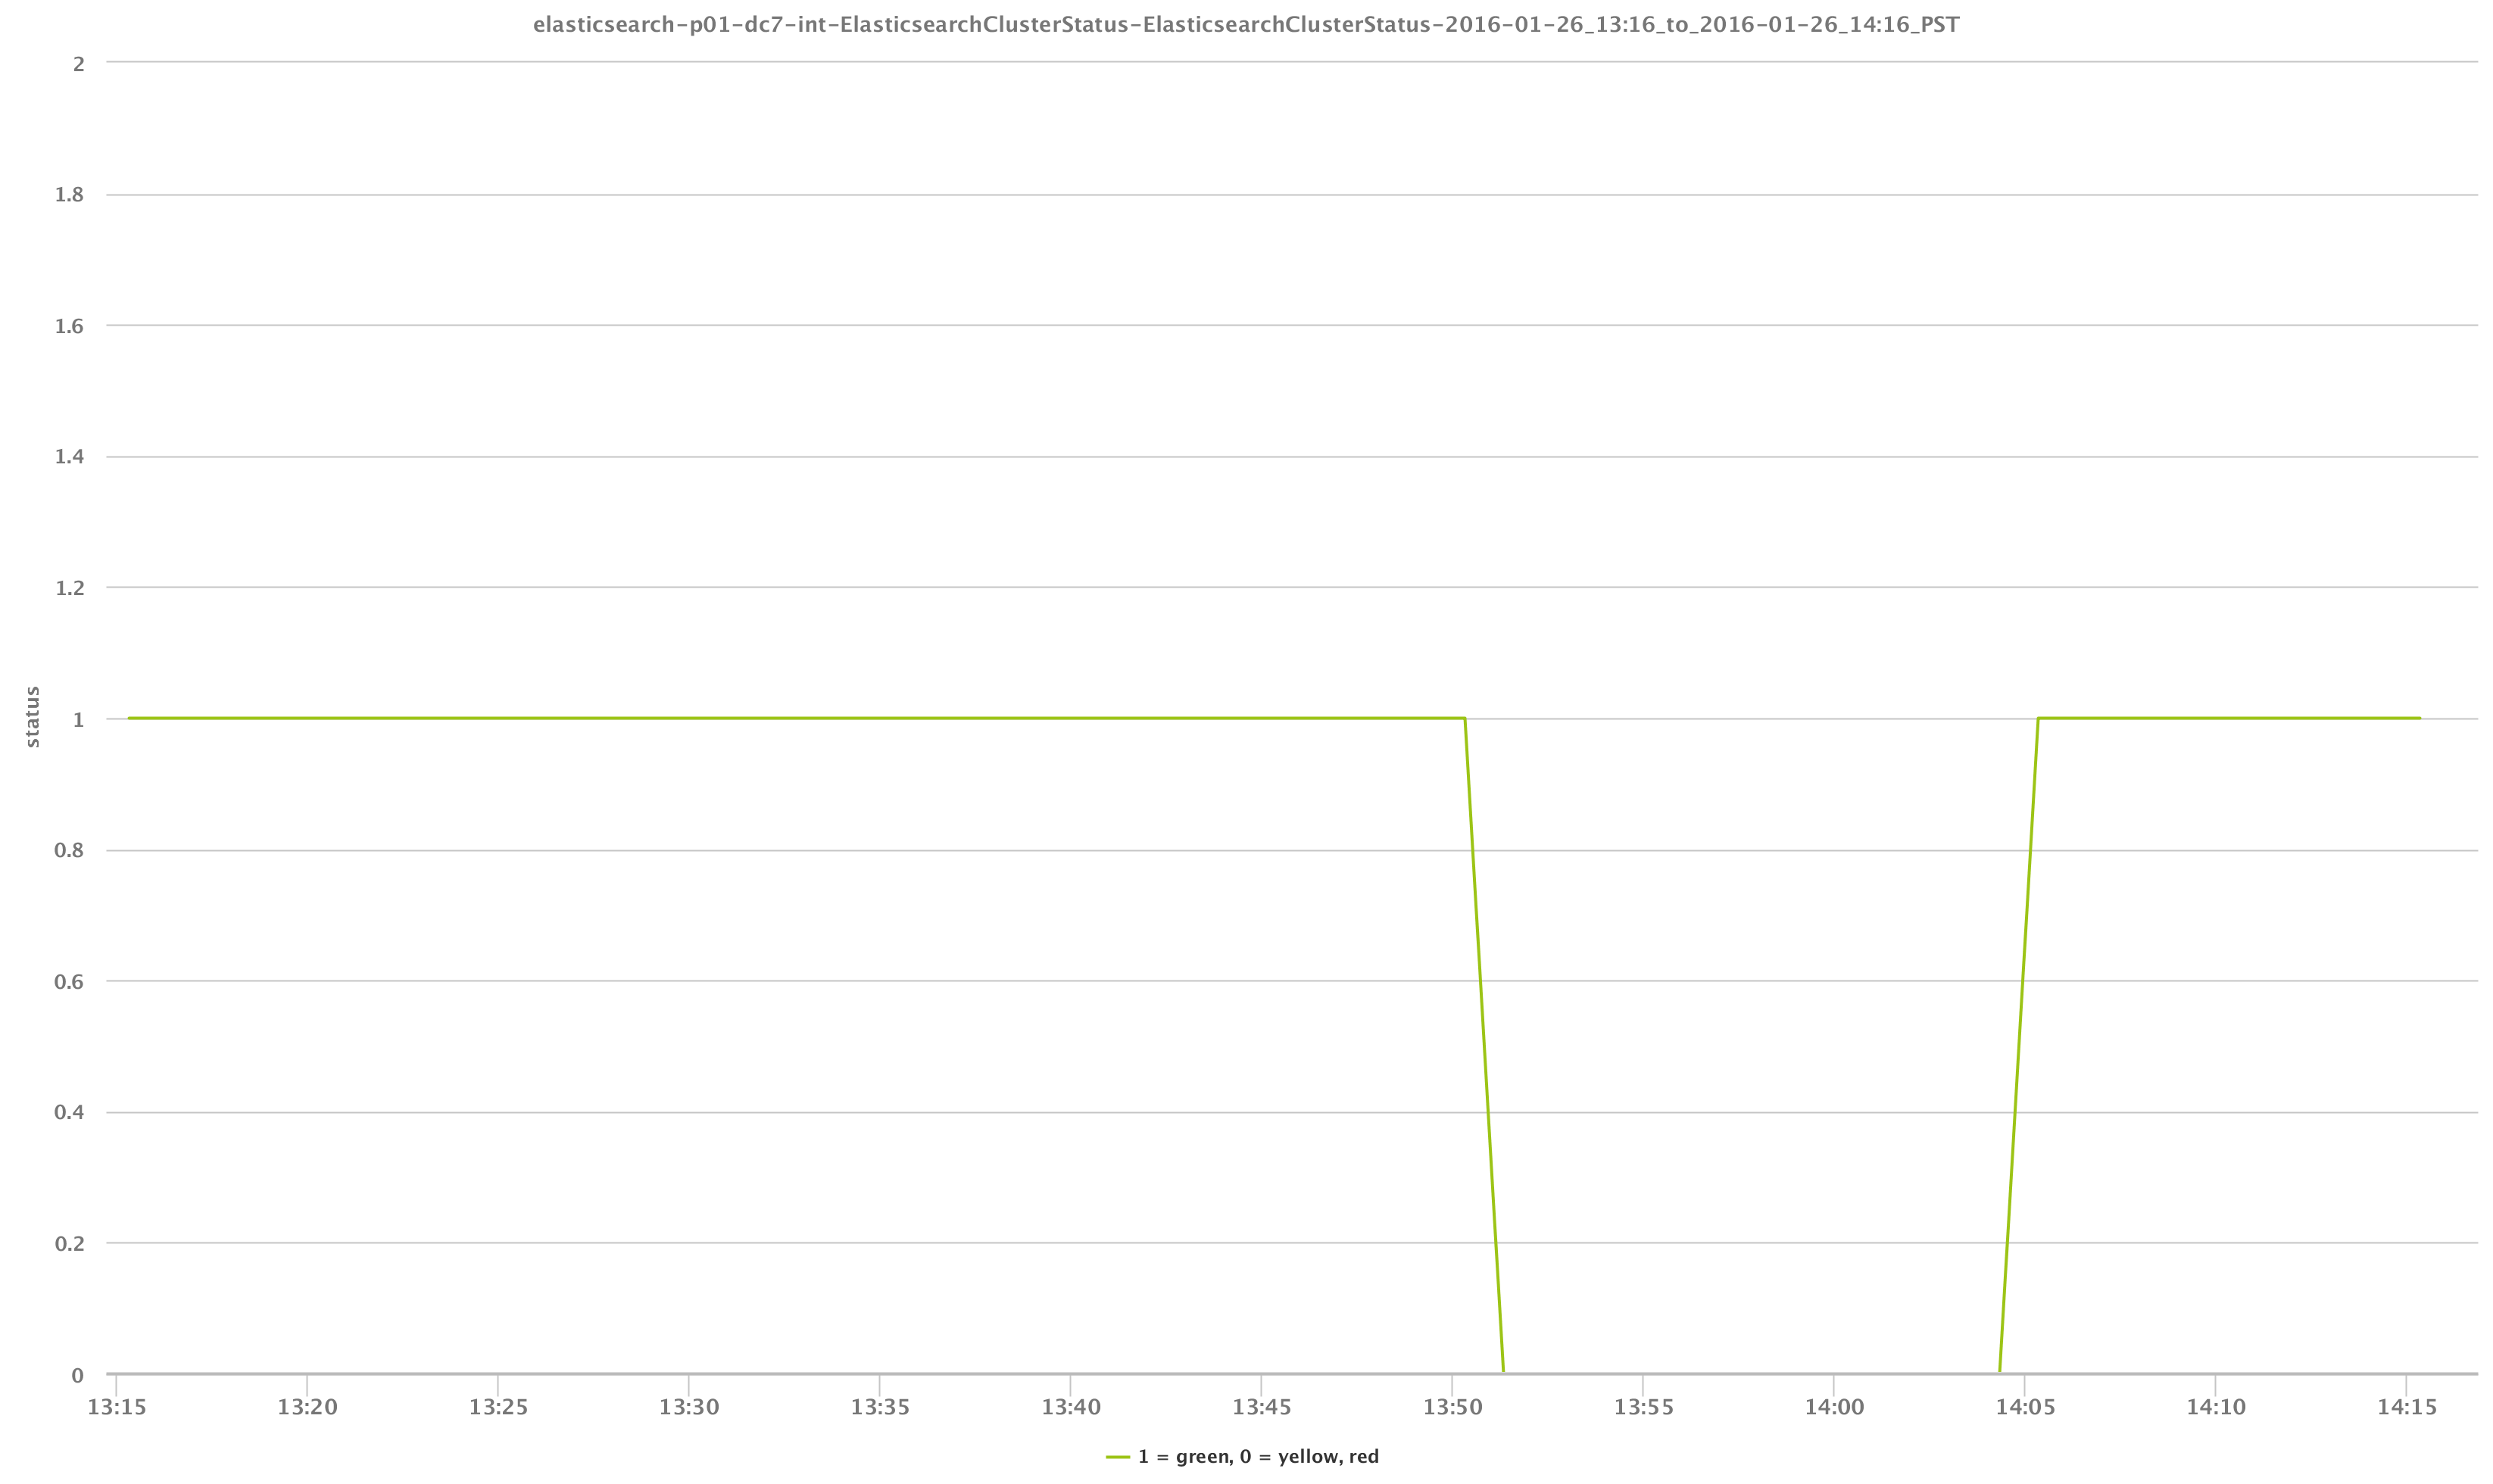
By using a simple GET request in a LogicMonitor datasource, we can match on “status” and easily determine and alert on the health of our cluster. This is demonstrated in the graph below. We can see that due to, in this case, losing one our cluster nodes, the status temporarily was not green:
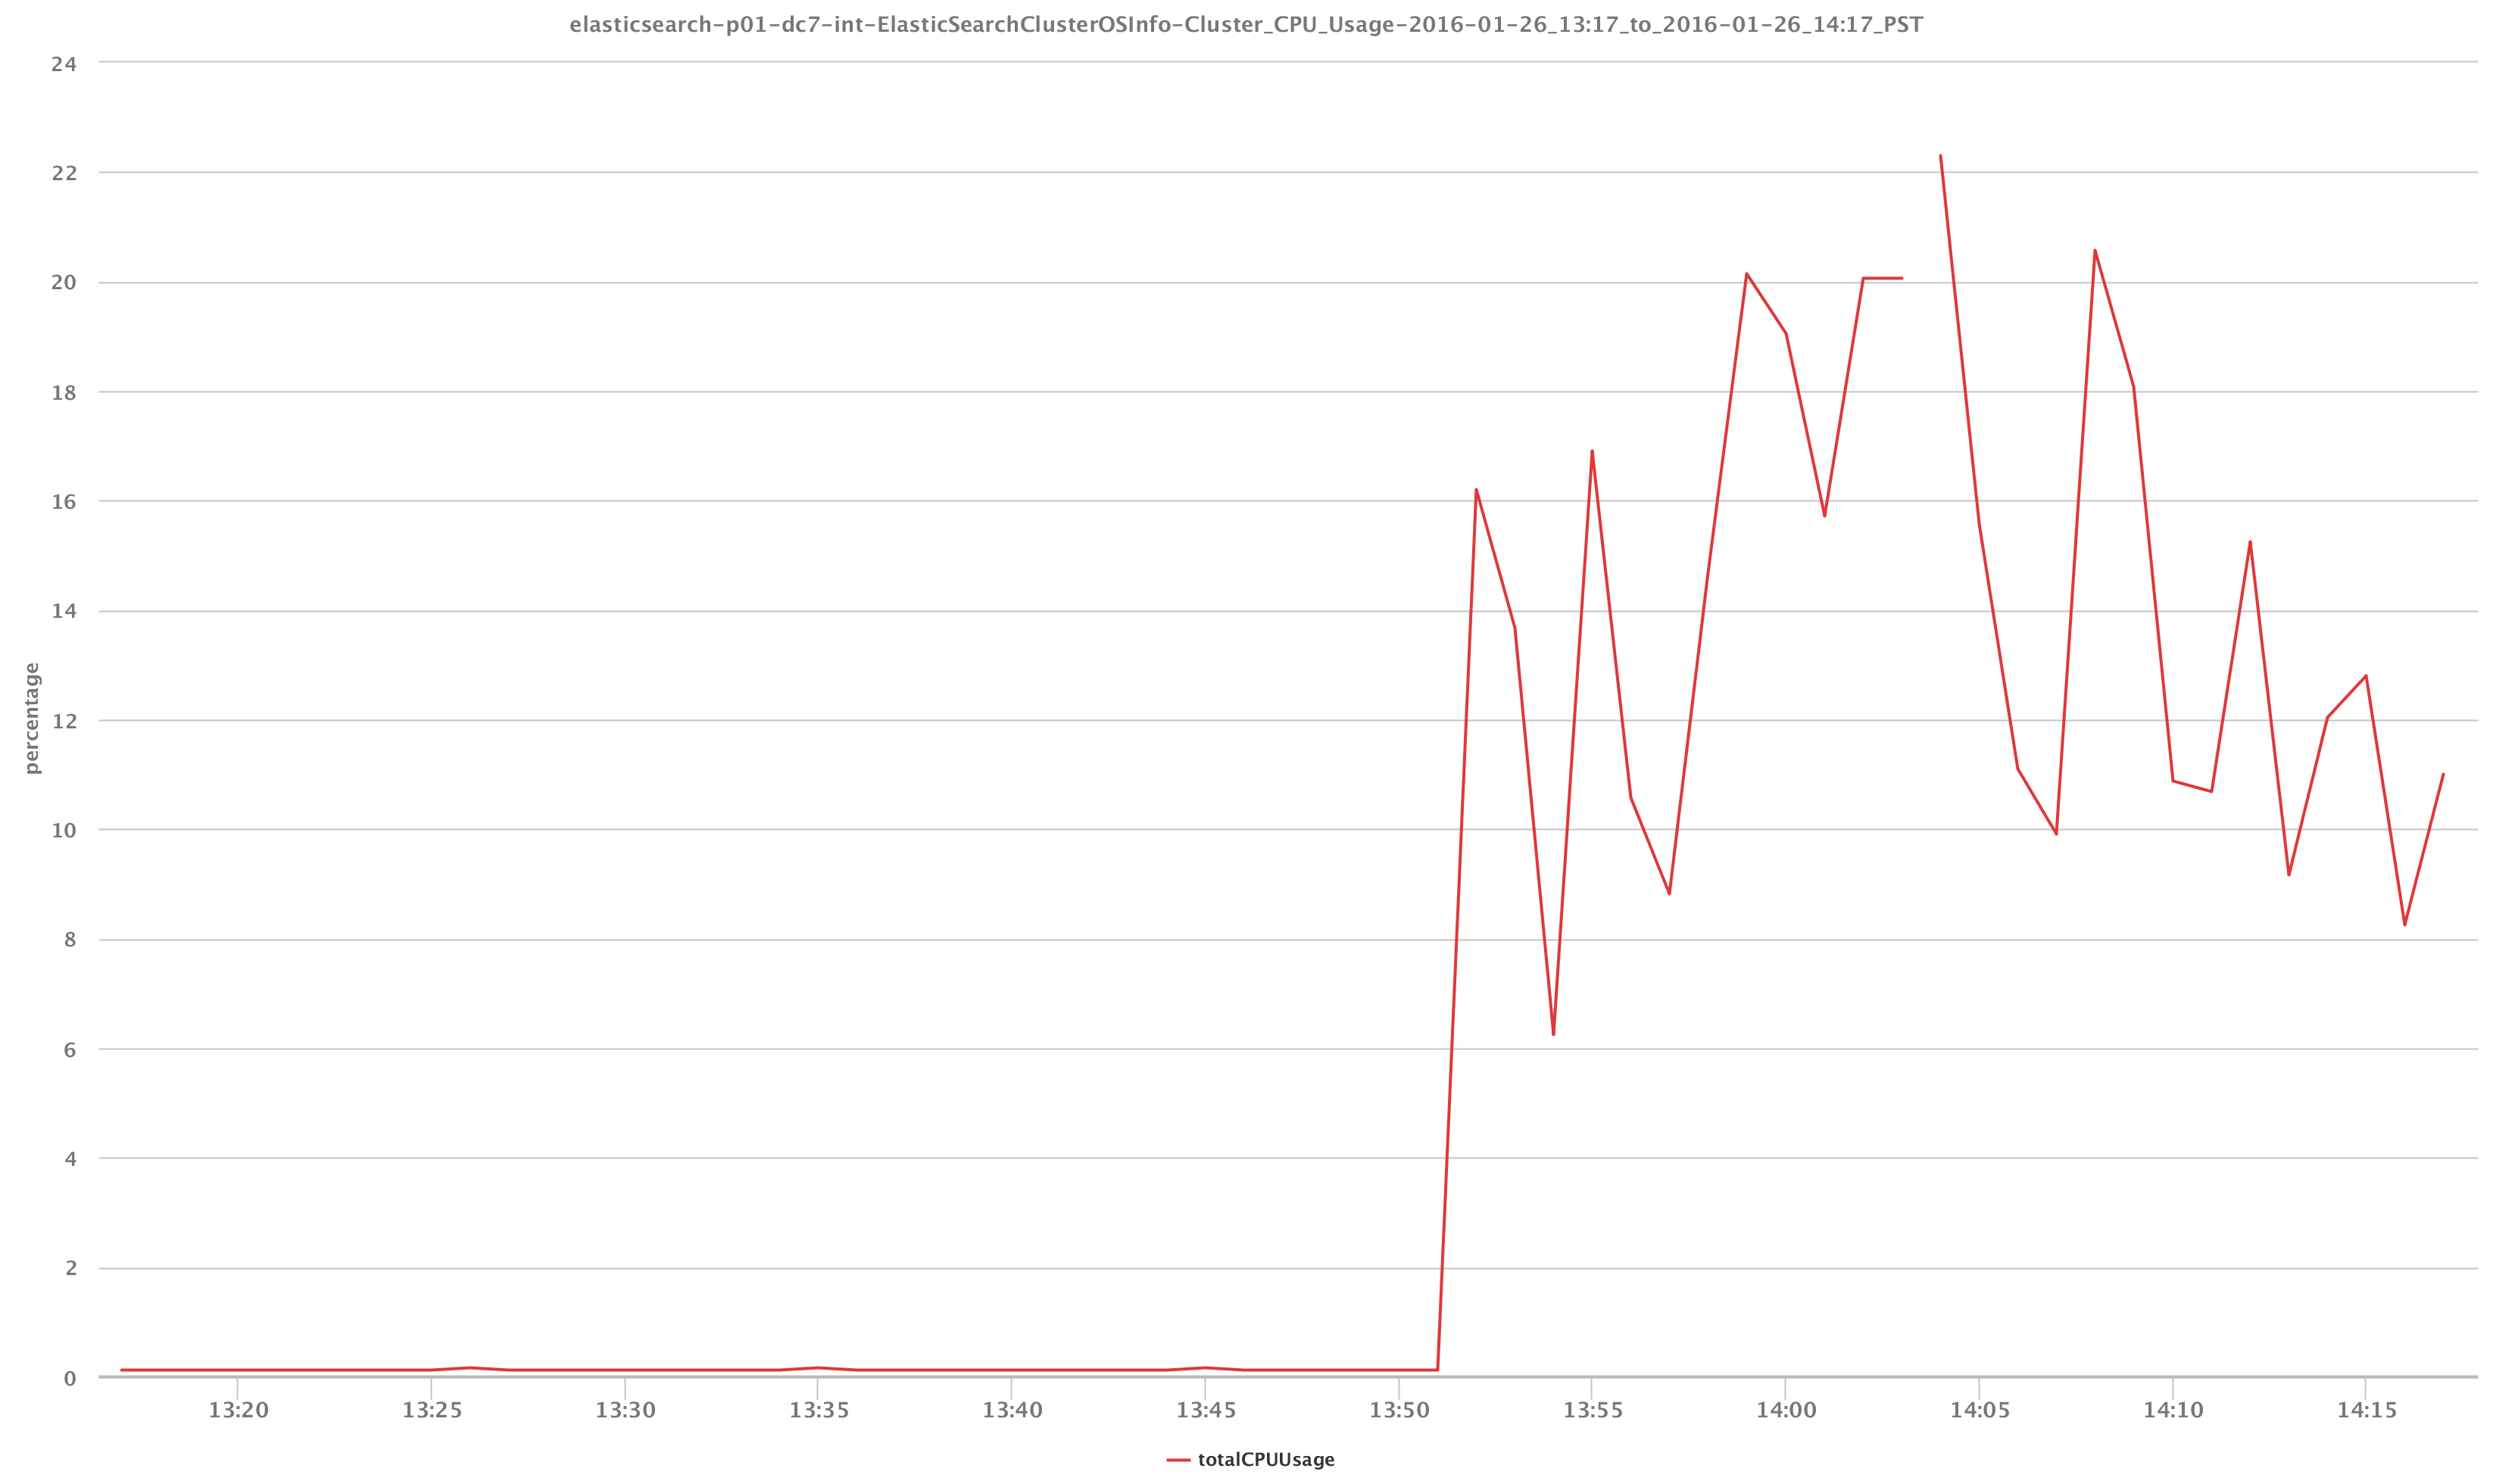
While very important, the status metric is not a very interesting datapoint in terms of visualization. Perhaps a bit more interesting visually, we can see from the graph below the overall CPU capacity and usage of the cluster via the /_cluster/stats API call and how the outage depicted in the graph above impacted our CPU health:

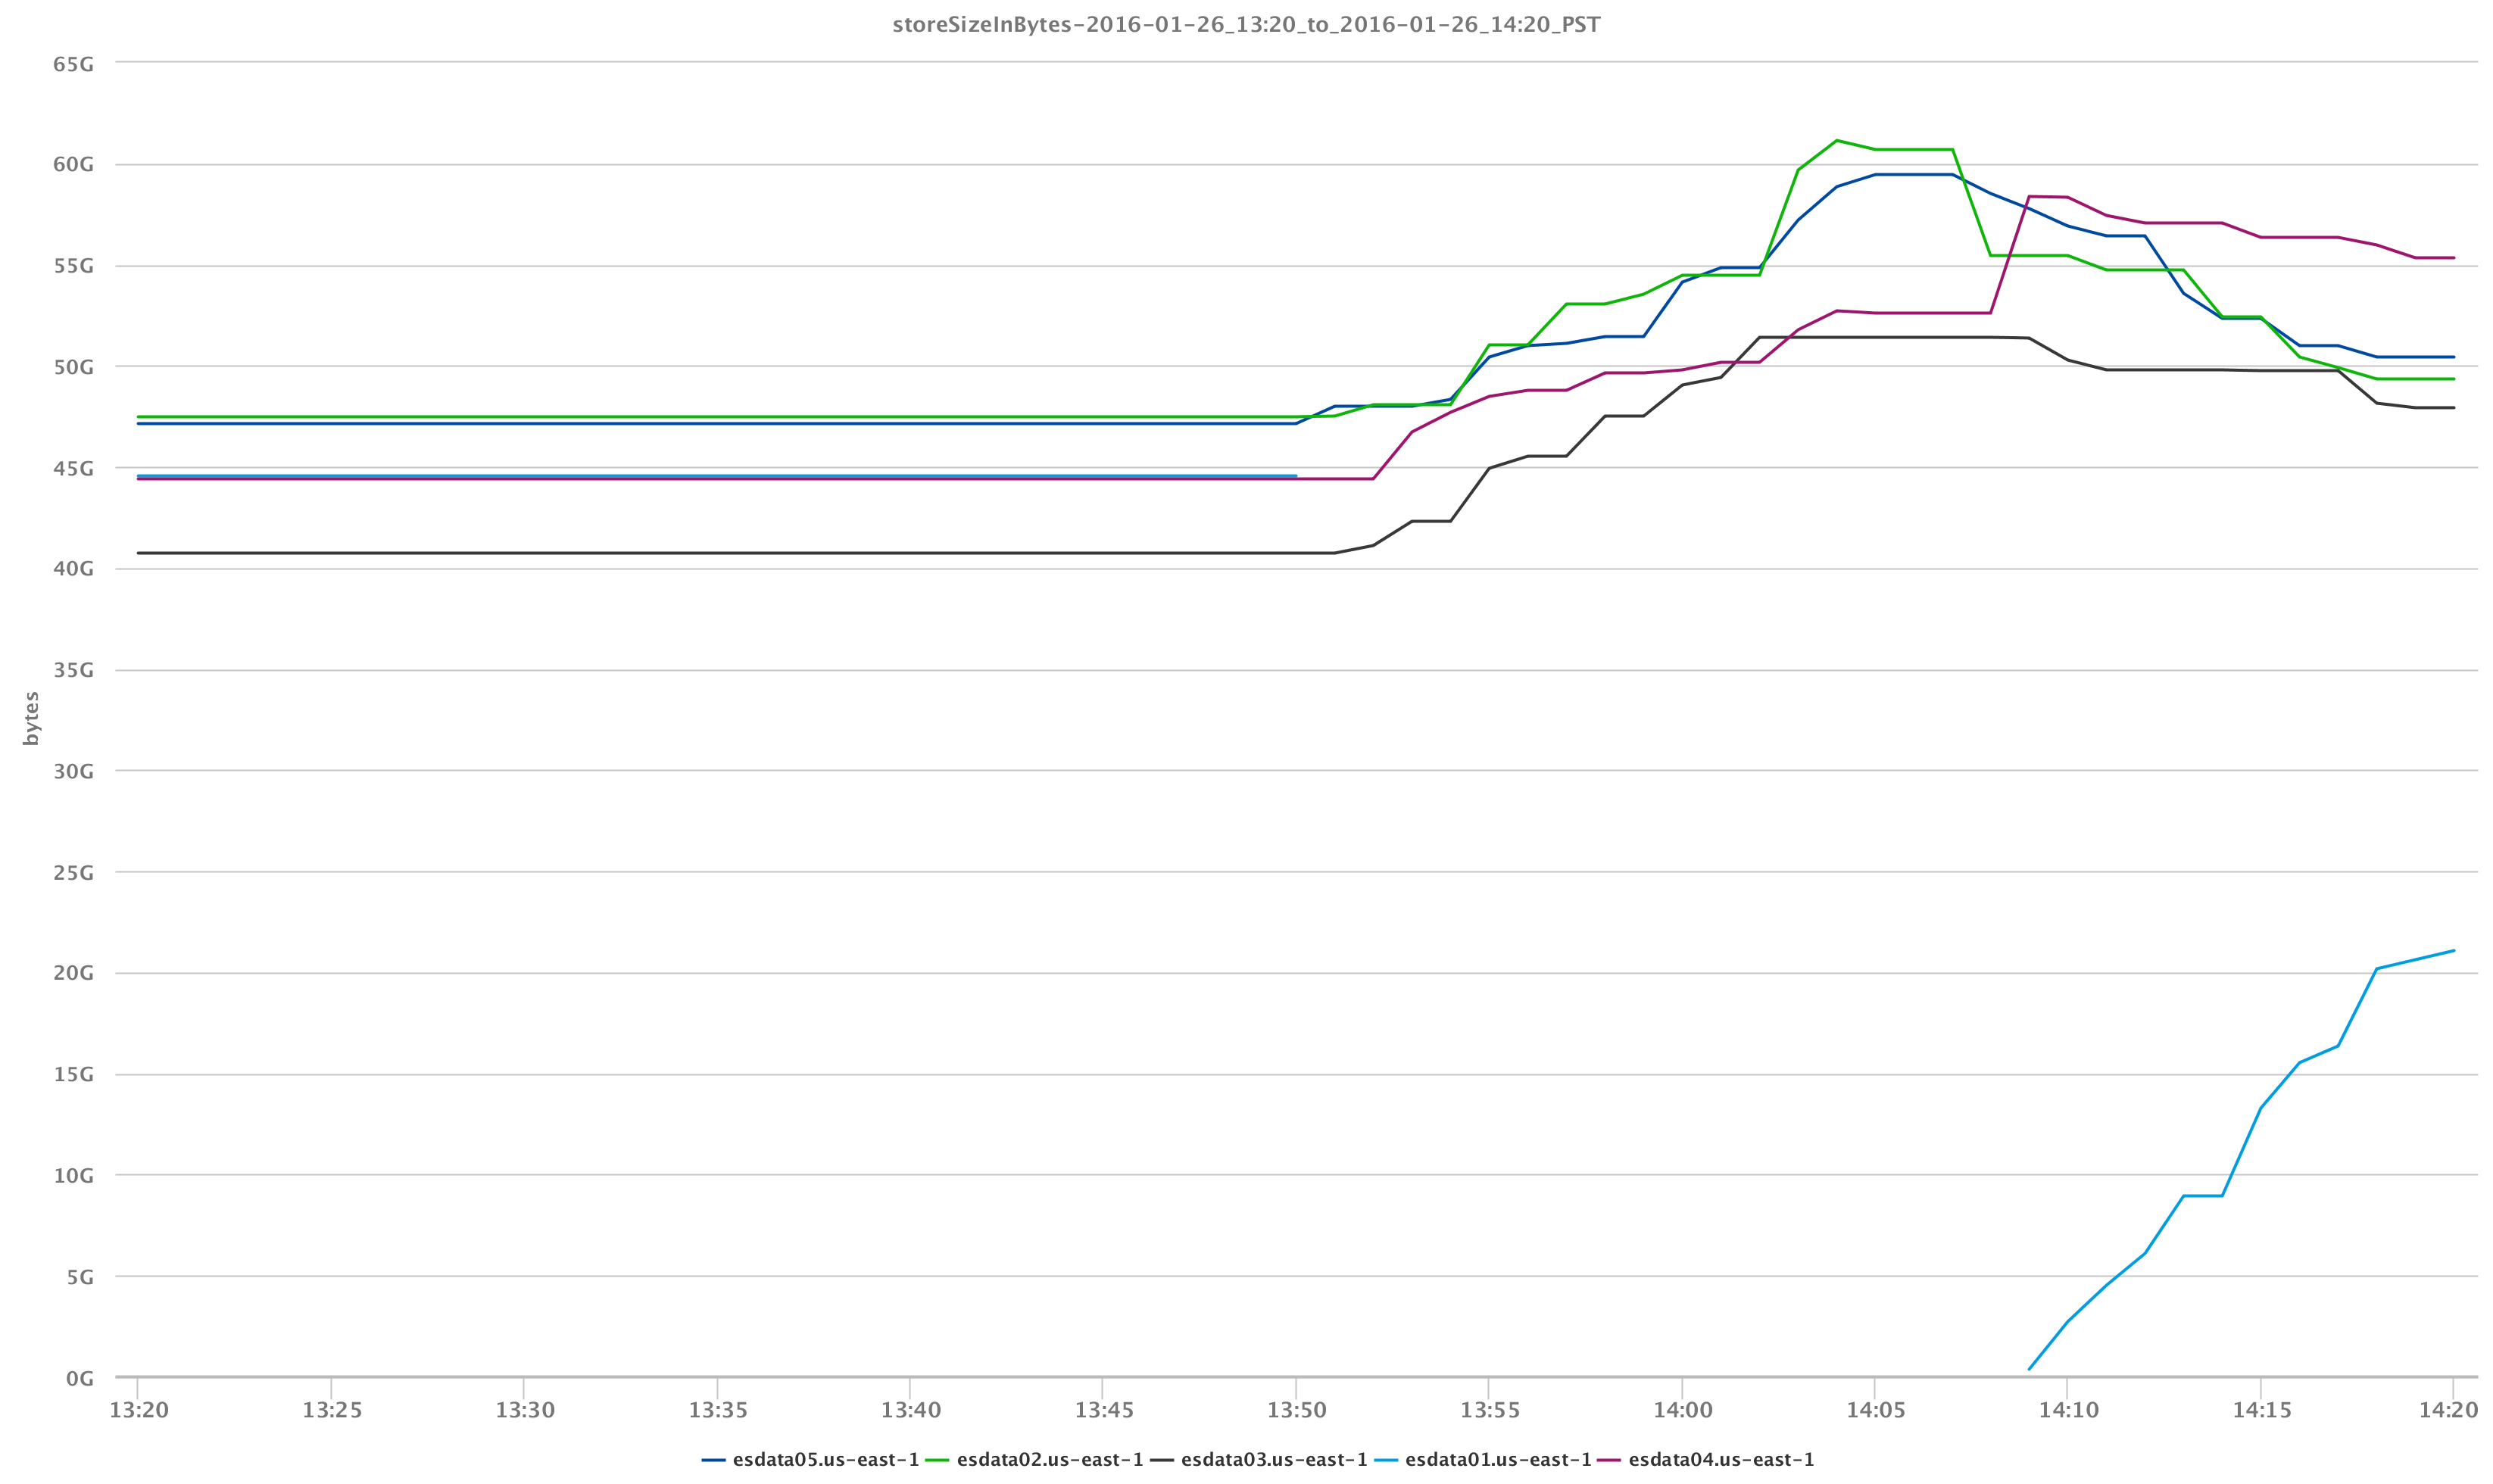
Because we know a little bit about Elasticsearch and given the fact that we lost a node, we can see that the cause of the CPU usage spike is because our cluster was working to reassign shards to other data nodes which directly impacts the storage per node as well.

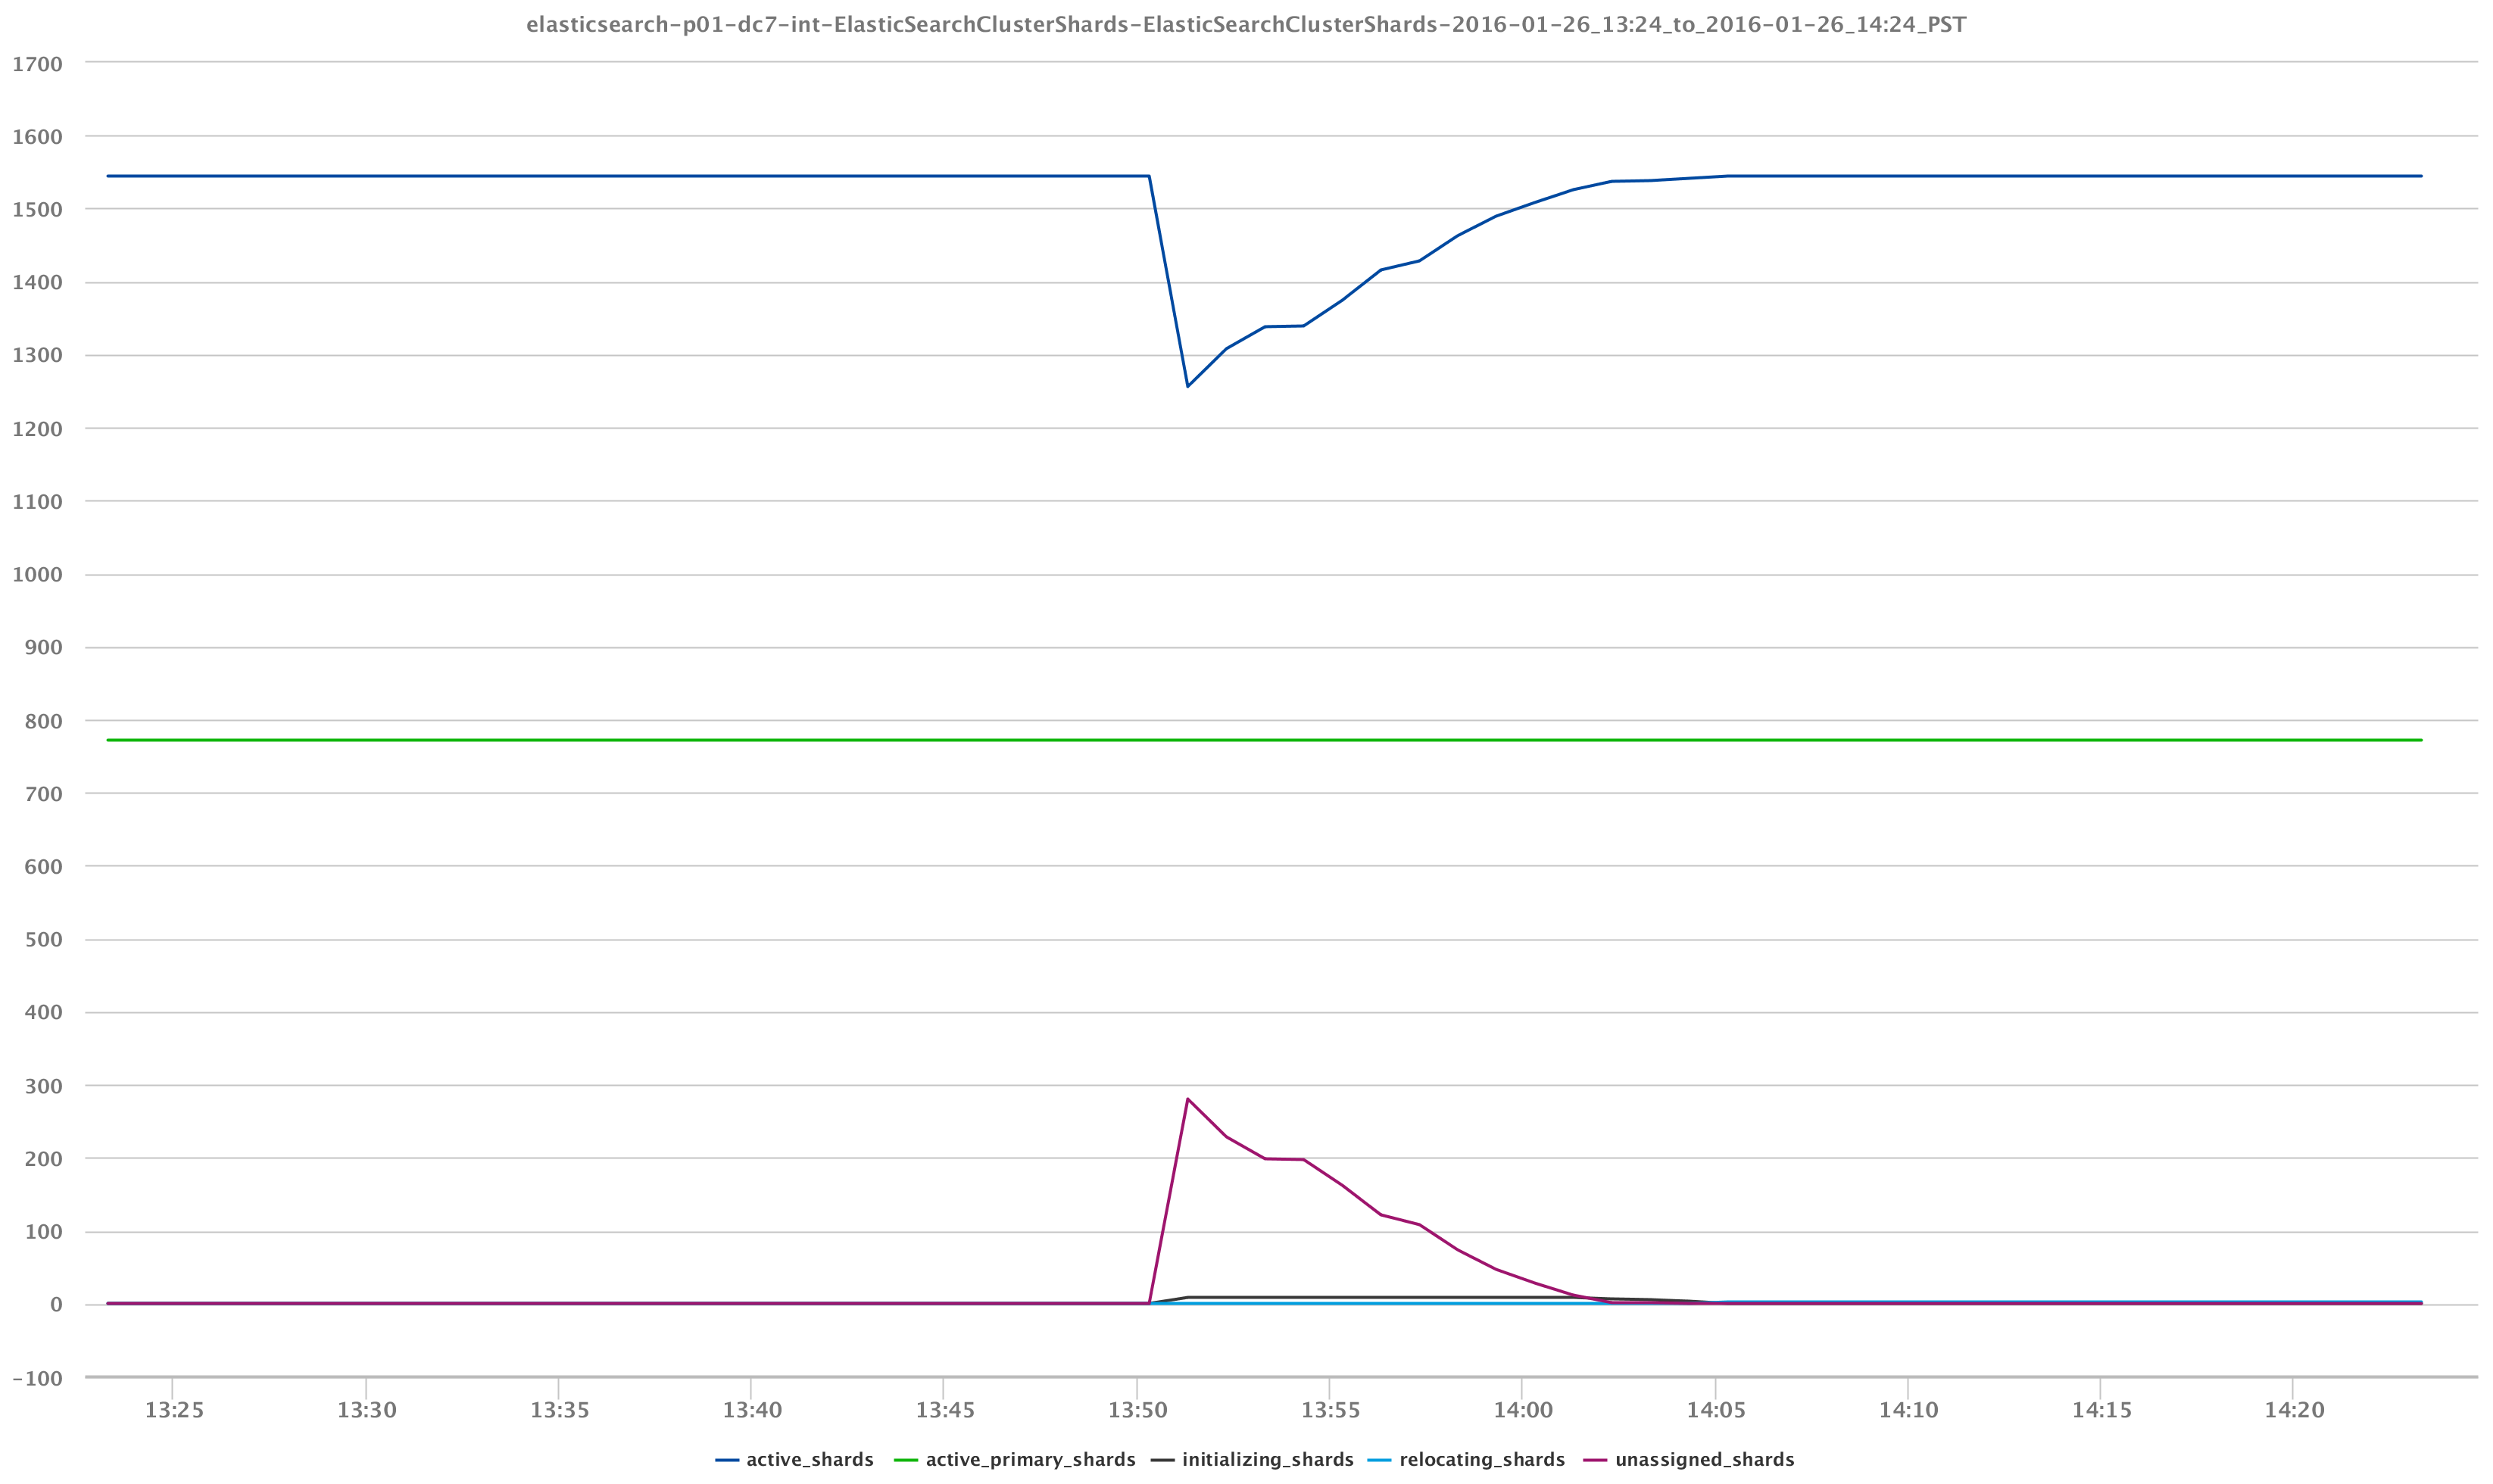
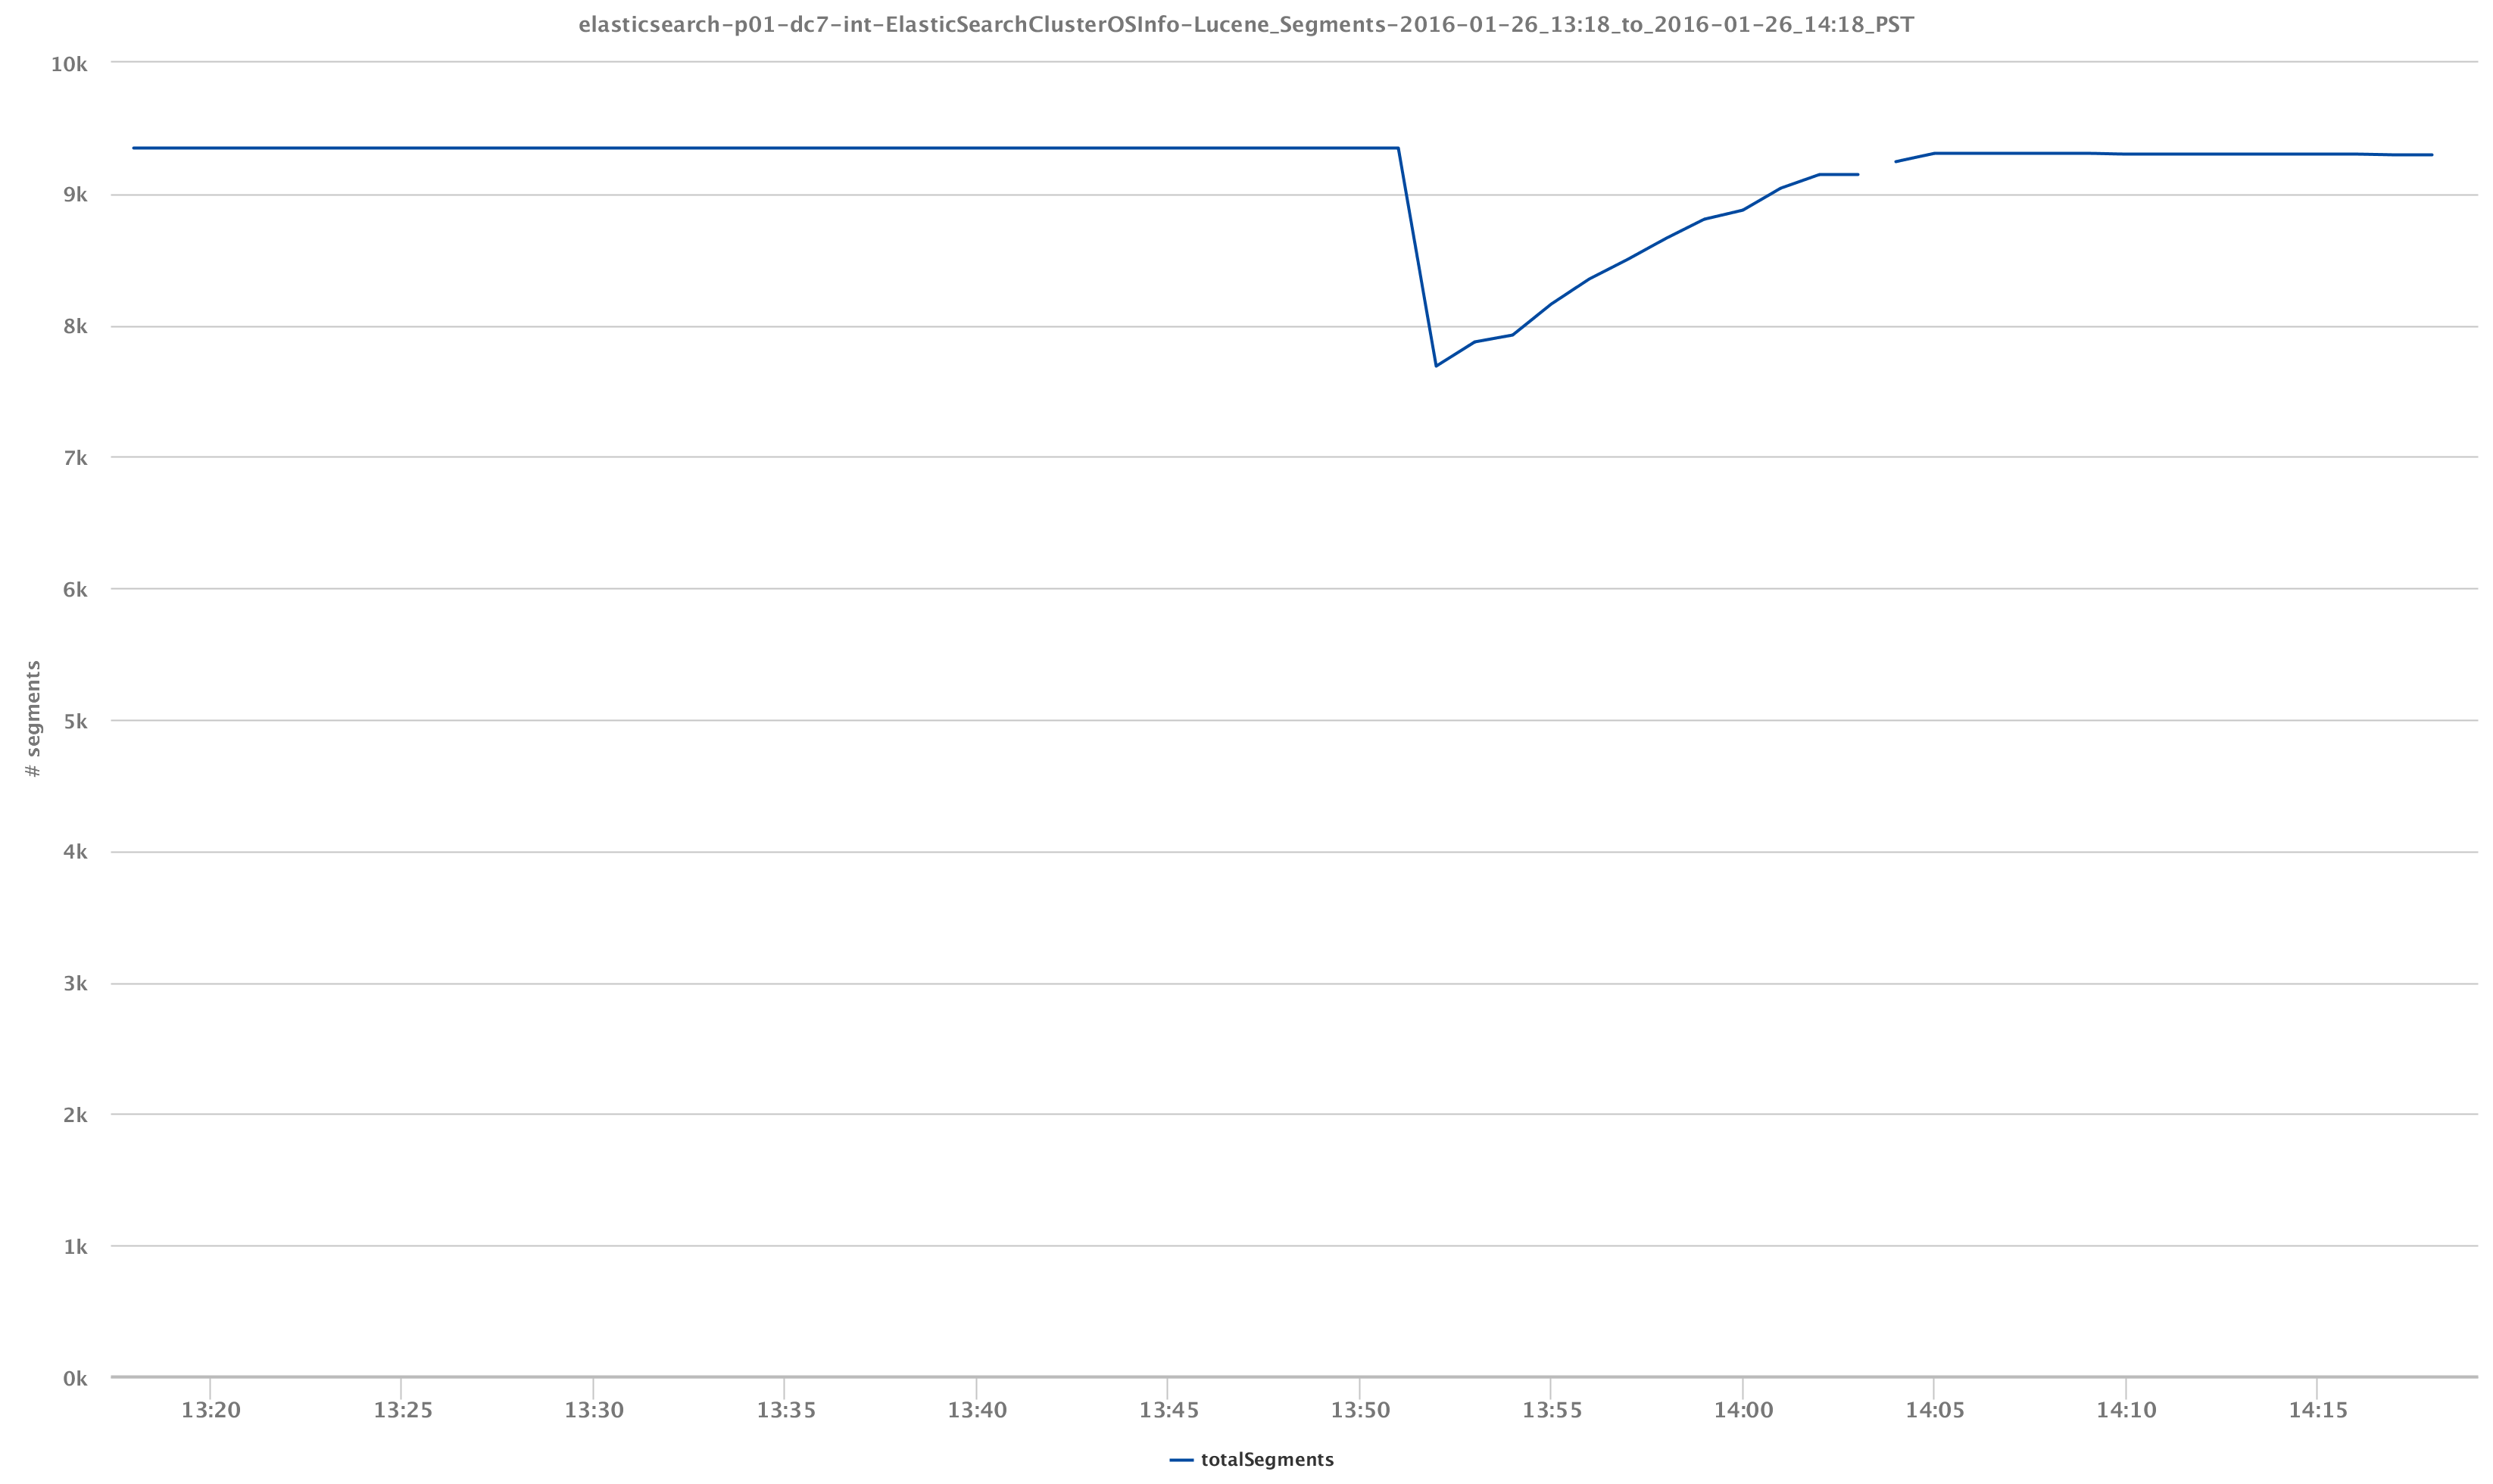
Visualization of our cluster health is just one aspect of what we can achieve. It becomes more exciting when we look into the actual data that we are indexing. For example, again via the /_cluster/stats and /_cluster/health API calls, we can observe the behavior of our Lucene segments and index shards which, again, were impacted by the event of losing a data node:
Sure, elastic has their Elasticsearch-specific monitoring solutions, Marvel and Watcher, but with the flexibility of LogicMonitor, monitoring your entire infrastructure in one pane of glass is possible.
This is a very high level overview of monitoring an Elasticsearch cluster and how it is easily achieved through the flexible datasource framework within LogicMonitor. In my next blog post on monitoring Elasticsearch, I will dive into the details of monitoring the new Amazon Web Services Elasticsearch Service and discuss the differences between monitoring the new service and your own cluster – stay tuned.


You may also like

Elevate Summit 2024: LogicMonitor CMO on why it’s a must-attend event for IT professionals
LogicMonitor CMO Brooke Cunningham shares why Elevate Summit is a must-attend event for IT professionals, revealing exclusive details about the...

LogicMonitor’s latest innovations to optimize cloud performance and costs
Explore LogicMonitor's cutting-edge solutions revolutionizing cloud performance optimization, cost management, and network infrastructure monitoring. Unlock intelligent insights for efficient cloud...

AIOps strategy guide: How to achieve IT efficiency
Transform your IT operations with AIOps – our strategy guide unveils the keys to efficiency. Explore how AIOps tackles alert...
Subscribe to our blog
Get articles like this delivered straight to your inbox.