' fill='%231A31FF'/%3E%3Cpath d='M148.667 101.667H148C142.399 101.667 139.599 101.667 137.46 100.577C135.578 99.618 134.049 98.0882 133.09 96.2066C132 94.0675 132 91.2672 132 85.6667V64.3333C132 58.7328 132 55.9326 133.09 53.7934C134.049 51.9118 135.578 50.382 137.46 49.4233C139.599 48.3333 142.399 48.3333 148 48.3333H148.667M148.667 101.667C148.667 105.349 151.651 108.333 155.333 108.333C159.015 108.333 162 105.349 162 101.667C162 97.9848 159.015 95 155.333 95C151.651 95 148.667 97.9848 148.667 101.667ZM148.667 48.3333C148.667 52.0152 151.651 55 155.333 55C159.015 55 162 52.0152 162 48.3333C162 44.6514 159.015 41.6667 155.333 41.6667C151.651 41.6667 148.667 44.6514 148.667 48.3333ZM115.333 75L148.667 75M115.333 75C115.333 78.6819 112.349 81.6667 108.667 81.6667C104.985 81.6667 102 78.6819 102 75C102 71.3181 104.985 68.3333 108.667 68.3333C112.349 68.3333 115.333 71.3181 115.333 75ZM148.667 75C148.667 78.6819 151.651 81.6667 155.333 81.6667C159.015 81.6667 162 78.6819 162 75C162 71.3181 159.015 68.3333 155.333 68.3333C151.651 68.3333 148.667 71.3181 148.667 75Z' stroke='%235F6FFF' stroke-width='6.66667' stroke-linecap='round' stroke-linejoin='round'/%3E%3Cpath d='M148.667 101.667H148C142.399 101.667 139.599 101.667 137.46 100.577C135.578 99.618 134.049 98.0882 133.09 96.2066C132 94.0675 132 91.2672 132 85.6667V75H115.333M148.667 101.667C148.667 105.349 151.651 108.333 155.333 108.333C159.015 108.333 162 105.349 162 101.667C162 97.9848 159.015 95 155.333 95C151.651 95 148.667 97.9848 148.667 101.667ZM115.333 75C115.333 78.6819 112.349 81.6667 108.667 81.6667C104.985 81.6667 102 78.6819 102 75C102 71.3181 104.985 68.3333 108.667 68.3333C112.349 68.3333 115.333 71.3181 115.333 75Z' stroke='white' stroke-width='6.66667' stroke-linecap='round'/%3E%3Ccircle cx='108.5' cy='74.5' r='5.5' fill='white'/%3E%3C/svg%3E)


'%3E%3Cpath d='M3.375 16.5V12.75M3.375 5.25V1.5M1.5 3.375H5.25M1.5 14.625H5.25M9.75 2.25L8.44937 5.63165C8.23786 6.18157 8.1321 6.45653 7.96765 6.68781C7.82189 6.8928 7.6428 7.07189 7.43781 7.21765C7.20653 7.3821 6.93157 7.48786 6.38165 7.69937L3 9L6.38165 10.3006C6.93157 10.5121 7.20653 10.6179 7.43781 10.7824C7.6428 10.9281 7.82189 11.1072 7.96765 11.3122C8.1321 11.5435 8.23786 11.8184 8.44937 12.3684L9.75 15.75L11.0506 12.3684C11.2621 11.8184 11.3679 11.5435 11.5324 11.3122C11.6781 11.1072 11.8572 10.9281 12.0622 10.7824C12.2935 10.6179 12.5684 10.5121 13.1184 10.3006L16.5 9L13.1184 7.69937C12.5684 7.48786 12.2935 7.3821 12.0622 7.21765C11.8572 7.07189 11.6781 6.8928 11.5324 6.68781C11.3679 6.45653 11.2621 6.18157 11.0506 5.63165L9.75 2.25Z' stroke='%231A31FF' stroke-width='1.25' stroke-linecap='round' stroke-linejoin='round'/%3E%3C/g%3E%3Cdefs%3E%3CclipPath id='clip0_220_1217'%3E%3Crect width='18' height='18' fill='white'/%3E%3C/clipPath%3E%3C/defs%3E%3C/svg%3E)
'%3E%3Cpath d='M4.5 4.5L6 3M6 3L4.5 1.5M6 3H4.5C2.84315 3 1.5 4.34315 1.5 6M13.5 13.5L12 15M12 15L13.5 16.5M12 15H13.5C15.1569 15 16.5 13.6569 16.5 12M7.64177 4.875C8.14132 2.93412 9.90318 1.5 12 1.5C14.4853 1.5 16.5 3.51472 16.5 6C16.5 8.0968 15.0659 9.85865 13.125 10.3582M10.5 12C10.5 14.4853 8.48528 16.5 6 16.5C3.51472 16.5 1.5 14.4853 1.5 12C1.5 9.51472 3.51472 7.5 6 7.5C8.48528 7.5 10.5 9.51472 10.5 12Z' stroke='%231A31FF' stroke-width='1.125' stroke-linecap='round' stroke-linejoin='round'/%3E%3C/g%3E%3Cdefs%3E%3CclipPath id='clip0_121_3926'%3E%3Crect width='18' height='18' fill='white'/%3E%3C/clipPath%3E%3C/defs%3E%3C/svg%3E)
'%3E%3Cpath d='M9 1.5L10.509 5.42331C10.7205 5.97324 10.8262 6.2482 10.9907 6.47948C11.1364 6.68447 11.3155 6.86356 11.5205 7.00931C11.7518 7.17377 12.0268 7.27952 12.5767 7.49103L16.5 9L12.5767 10.509C12.0268 10.7205 11.7518 10.8262 11.5205 10.9907C11.3155 11.1364 11.1364 11.3155 10.9907 11.5205C10.8262 11.7518 10.7205 12.0268 10.509 12.5767L9 16.5L7.49103 12.5767C7.27952 12.0268 7.17377 11.7518 7.00931 11.5205C6.86356 11.3155 6.68447 11.1364 6.47948 10.9907C6.2482 10.8262 5.97324 10.7205 5.42331 10.509L1.5 9L5.42331 7.49103C5.97324 7.27952 6.2482 7.17377 6.47948 7.00931C6.68446 6.86356 6.86356 6.68446 7.00931 6.47948C7.17377 6.2482 7.27952 5.97324 7.49103 5.42331L9 1.5Z' stroke='%231A31FF' stroke-width='1.25' stroke-linecap='round' stroke-linejoin='round'/%3E%3C/g%3E%3Cdefs%3E%3CclipPath id='clip0_121_3938'%3E%3Crect width='18' height='18' fill='white'/%3E%3C/clipPath%3E%3C/defs%3E%3C/svg%3E)
' fill='%231A31FF'/%3E%3Cpath d='M112 55H112.033M112 95H112.033M109.333 68.3334H154.667C158.4 68.3334 160.267 68.3334 161.693 67.6067C162.948 66.9676 163.968 65.9477 164.607 64.6933C165.333 63.2672 165.333 61.4004 165.333 57.6667V52.3334C165.333 48.5997 165.333 46.7328 164.607 45.3068C163.968 44.0523 162.948 43.0325 161.693 42.3933C160.267 41.6667 158.4 41.6667 154.667 41.6667H109.333C105.6 41.6667 103.733 41.6667 102.307 42.3933C101.052 43.0325 100.032 44.0523 99.3933 45.3068C98.6667 46.7328 98.6667 48.5997 98.6667 52.3334V57.6667C98.6667 61.4004 98.6667 63.2672 99.3933 64.6933C100.032 65.9477 101.052 66.9676 102.307 67.6067C103.733 68.3334 105.6 68.3334 109.333 68.3334ZM109.333 108.333H154.667C158.4 108.333 160.267 108.333 161.693 107.607C162.948 106.968 163.968 105.948 164.607 104.693C165.333 103.267 165.333 101.4 165.333 97.6667V92.3334C165.333 88.5997 165.333 86.7328 164.607 85.3067C163.968 84.0523 162.948 83.0325 161.693 82.3933C160.267 81.6667 158.4 81.6667 154.667 81.6667H109.333C105.6 81.6667 103.733 81.6667 102.307 82.3933C101.052 83.0325 100.032 84.0523 99.3933 85.3067C98.6667 86.7328 98.6667 88.5997 98.6667 92.3334V97.6667C98.6667 101.4 98.6667 103.267 99.3933 104.693C100.032 105.948 101.052 106.968 102.307 107.607C103.733 108.333 105.6 108.333 109.333 108.333Z' stroke='%235F6FFF' stroke-width='6.66667' stroke-linecap='round' stroke-linejoin='round'/%3E%3Cpath d='M152.25 95.25L138.75 81.75M143.25 70.5C143.25 79.1985 136.198 86.25 127.5 86.25C118.802 86.25 111.75 79.1985 111.75 70.5C111.75 61.8015 118.802 54.75 127.5 54.75C136.198 54.75 143.25 61.8015 143.25 70.5Z' stroke='white' stroke-width='4.5' stroke-linecap='round' stroke-linejoin='round'/%3E%3Ccircle cx='165' cy='42' r='7' fill='white'/%3E%3C/svg%3E)


'%3E%3Cpath d='M4.58981 14.939L4.94322 15.7526C5.04827 15.9948 5.21972 16.2005 5.43677 16.3449C5.65382 16.4894 5.90715 16.5662 6.16602 16.5662C6.42489 16.5662 6.67822 16.4894 6.89527 16.3449C7.11232 16.2005 7.28377 15.9948 7.38882 15.7526L7.74223 14.939C7.86803 14.6503 8.07965 14.4096 8.34691 14.2512C8.61587 14.0924 8.927 14.0248 9.2358 14.0579L10.1005 14.1522C10.3579 14.18 10.6177 14.1309 10.8483 14.0106C11.0789 13.8904 11.2705 13.7042 11.3999 13.4747C11.5294 13.2454 11.5911 12.9825 11.5775 12.7179C11.5639 12.4534 11.4756 12.1986 11.3233 11.9844L10.8113 11.2643C10.629 11.006 10.5316 10.6951 10.5332 10.3764C10.5331 10.0586 10.6314 9.74901 10.814 9.49199L11.326 8.77191C11.4783 8.55773 11.5666 8.30291 11.5802 8.03836C11.5938 7.77382 11.5321 7.51092 11.4026 7.28156C11.2732 7.05207 11.0816 6.86591 10.851 6.74567C10.6203 6.62543 10.3606 6.57626 10.1032 6.60413L9.23848 6.69835C8.92969 6.73155 8.61855 6.6639 8.3496 6.50509C8.0818 6.34583 7.87013 6.10387 7.74492 5.81391L7.38882 5.0003C7.28377 4.75811 7.11232 4.55233 6.89527 4.40791C6.67822 4.2635 6.42489 4.18665 6.16602 4.18669C5.90715 4.18665 5.65382 4.2635 5.43677 4.40791C5.21972 4.55233 5.04827 4.75811 4.94322 5.0003L4.58981 5.81391C4.4646 6.10387 4.25293 6.34583 3.98513 6.50509C3.71618 6.6639 3.40504 6.73155 3.09624 6.69835L2.22886 6.60413C1.97146 6.57626 1.7117 6.62543 1.48106 6.74567C1.25042 6.86591 1.05881 7.05207 0.929462 7.28156C0.799951 7.51092 0.738251 7.77382 0.751847 8.03836C0.765443 8.30291 0.85375 8.55773 1.00606 8.77191L1.51802 9.49199C1.7006 9.74901 1.79892 10.0586 1.79886 10.3764C1.79892 10.6942 1.7006 11.0039 1.51802 11.2609L1.00606 11.9809C0.85375 12.1951 0.765443 12.4499 0.751847 12.7145C0.738251 12.979 0.799951 13.2419 0.929462 13.4713C1.05893 13.7007 1.25057 13.8867 1.48117 14.007C1.71178 14.1272 1.97148 14.1764 2.22886 14.1487L3.09356 14.0545C3.40235 14.0213 3.71349 14.089 3.98244 14.2478C4.25124 14.4066 4.4639 14.6486 4.58981 14.939Z' stroke='%231A31FF' stroke-width='1.25' stroke-linecap='round' stroke-linejoin='round'/%3E%3Cpath d='M6.16494 12.2334C7.16681 12.2334 7.97899 11.402 7.97899 10.3764C7.97899 9.35088 7.16681 8.51951 6.16494 8.51951C5.16307 8.51951 4.35089 9.35088 4.35089 10.3764C4.35089 11.402 5.16307 12.2334 6.16494 12.2334Z' stroke='%231A31FF' stroke-width='1.25' stroke-linecap='round' stroke-linejoin='round'/%3E%3Cpath d='M14.126 7.98059C14.2161 7.77391 14.3676 7.6016 14.5589 7.48822C14.7515 7.37453 14.9742 7.3261 15.1953 7.34987L15.8143 7.41732C15.9986 7.43727 16.1846 7.40207 16.3497 7.31599C16.5148 7.22991 16.652 7.09664 16.7446 6.93234C16.8373 6.76814 16.8815 6.57993 16.8717 6.39054C16.862 6.20115 16.7988 6.01872 16.6898 5.86538L16.3232 5.34988C16.1927 5.16495 16.123 4.94236 16.1241 4.71423C16.1241 4.48673 16.1945 4.26506 16.3252 4.08105L16.6917 3.56554C16.8007 3.41221 16.8639 3.22978 16.8737 3.04039C16.8834 2.851 16.8392 2.66279 16.7465 2.49859C16.6539 2.33429 16.5167 2.20102 16.3516 2.11494C16.1865 2.02886 16.0005 1.99366 15.8163 2.01361L15.1972 2.08106C14.9762 2.10483 14.7534 2.0564 14.5609 1.94271C14.3691 1.82869 14.2176 1.65547 14.128 1.44788L13.873 0.865412C13.7978 0.692028 13.6751 0.544707 13.5197 0.441317C13.3643 0.337928 13.1829 0.282913 12.9976 0.282944C12.8123 0.282913 12.6309 0.337928 12.4755 0.441317C12.3202 0.544707 12.1974 0.692028 12.1222 0.865412L11.8692 1.44788C11.7796 1.65547 11.628 1.82869 11.4363 1.94271C11.2438 2.0564 11.021 2.10483 10.7999 2.08106L10.179 2.01361C9.9947 1.99366 9.80873 2.02886 9.64361 2.11494C9.47849 2.20102 9.34132 2.33429 9.24872 2.49859C9.156 2.66279 9.11183 2.851 9.12156 3.04039C9.13129 3.22978 9.19452 3.41221 9.30355 3.56554L9.67007 4.08105C9.80078 4.26506 9.87117 4.48673 9.87113 4.71423M14.2955 4.71423C14.2955 5.44843 13.7141 6.04362 12.9968 6.04362C12.2796 6.04362 11.6981 5.44843 11.6981 4.71423C11.6981 3.98003 12.2796 3.38485 12.9968 3.38485C13.7141 3.38485 14.2955 3.98003 14.2955 4.71423Z' stroke='%231A31FF' stroke-width='1.25' stroke-linecap='round' stroke-linejoin='round'/%3E%3C/g%3E%3Cdefs%3E%3CclipPath id='clip0_220_1415'%3E%3Crect width='18' height='18' fill='white'/%3E%3C/clipPath%3E%3C/defs%3E%3C/svg%3E)

' fill='%231A31FF'/%3E%3Cpath d='M113.667 96.3333C105.382 96.3333 98.6667 89.6176 98.6667 81.3333C98.6667 73.5214 104.638 67.1043 112.266 66.3979C113.826 56.9071 122.067 49.6666 132 49.6666C141.933 49.6666 150.174 56.9071 151.734 66.3979C159.362 67.1043 165.333 73.5214 165.333 81.3333C165.333 89.6176 158.618 96.3333 150.333 96.3333C135.701 96.3333 126.478 96.3333 113.667 96.3333Z' stroke='white' stroke-width='6.66667' stroke-linecap='round' stroke-linejoin='round'/%3E%3Ccircle cx='132' cy='75' r='53.4286' stroke='%235F6FFF' stroke-width='3.14286'/%3E%3Ccircle cx='92' cy='40' r='7' fill='white'/%3E%3Ccircle cx='185' cy='75' r='7' fill='white'/%3E%3Ccircle cx='92' cy='111' r='7' fill='white'/%3E%3C/svg%3E)


'%3E%3Cpath d='M12.7271 8.32943C13.5367 8.32943 14.193 7.67312 14.193 6.86352C14.193 6.05392 13.5367 5.39761 12.7271 5.39761C11.9175 5.39761 11.2612 6.05392 11.2612 6.86352C11.2612 7.67312 11.9175 8.32943 12.7271 8.32943Z' stroke='%231A31FF' stroke-width='1.25' stroke-linecap='round' stroke-linejoin='round'/%3E%3Cpath d='M5.39755 14.1932C6.20715 14.1932 6.86346 13.5369 6.86346 12.7273C6.86346 11.9177 6.20715 11.2614 5.39755 11.2614C4.58795 11.2614 3.93164 11.9177 3.93164 12.7273C3.93164 13.5369 4.58795 14.1932 5.39755 14.1932Z' stroke='%231A31FF' stroke-width='1.25' stroke-linecap='round' stroke-linejoin='round'/%3E%3Cpath d='M11.2613 17.1251V11.9944L5.39771 6.1308V1.00012' stroke='%231A31FF' stroke-width='1.25' stroke-linecap='round' stroke-linejoin='round'/%3E%3Cpath d='M5.39771 11.2613V6.13058' stroke='%231A31FF' stroke-width='1.25' stroke-linecap='round' stroke-linejoin='round'/%3E%3Cpath d='M16.392 1H1.73295C1.32815 1 1 1.32815 1 1.73295V16.392C1 16.7968 1.32815 17.125 1.73295 17.125H16.392C16.7968 17.125 17.125 16.7968 17.125 16.392V1.73295C17.125 1.32815 16.7968 1 16.392 1Z' stroke='%231A31FF' stroke-width='1.25' stroke-linecap='round' stroke-linejoin='round'/%3E%3Cpath d='M9.79541 1.00012V3.93194L11.691 5.82754' stroke='%231A31FF' stroke-width='1.25' stroke-linecap='round' stroke-linejoin='round'/%3E%3C/g%3E%3Cdefs%3E%3CclipPath id='clip0_220_930'%3E%3Crect width='18' height='18' fill='white'/%3E%3C/clipPath%3E%3C/defs%3E%3C/svg%3E)


'%3E%3Cpath d='M3.975 3.975L5.5875 2.3625M5.5875 2.3625L3.975 0.75M5.5875 2.3625H3.975C2.19388 2.3625 0.75 3.80638 0.75 5.5875M13.65 13.65L12.0375 15.2625M12.0375 15.2625L13.65 16.875M12.0375 15.2625H13.65C15.4311 15.2625 16.875 13.8186 16.875 12.0375' stroke='%231A31FF' stroke-width='1.25' stroke-linecap='round' stroke-linejoin='round'/%3E%3Cpath d='M4.33618 15.0599L4.61676 15.7059C4.70017 15.8981 4.8363 16.0615 5.00862 16.1762C5.18094 16.2908 5.38207 16.3518 5.5876 16.3518C5.79313 16.3518 5.99425 16.2908 6.16658 16.1762C6.3389 16.0615 6.47502 15.8981 6.55843 15.7059L6.83901 15.0599C6.93889 14.8307 7.1069 14.6396 7.3191 14.5139C7.53263 14.3878 7.77966 14.3341 8.02482 14.3604L8.71134 14.4352C8.91569 14.4574 9.12193 14.4183 9.30505 14.3229C9.48817 14.2274 9.64029 14.0796 9.74298 13.8974C9.84581 13.7153 9.89479 13.5066 9.884 13.2965C9.8732 13.0865 9.80309 12.8842 9.68217 12.7141L9.2757 12.1425C9.13097 11.9374 9.05363 11.6905 9.05486 11.4375C9.05482 11.1852 9.13288 10.9394 9.27784 10.7353L9.68431 10.1636C9.80523 9.99359 9.87534 9.79127 9.88613 9.58124C9.89693 9.3712 9.84794 9.16248 9.74512 8.98038C9.64242 8.79818 9.4903 8.65038 9.30718 8.55492C9.12407 8.45945 8.91783 8.42041 8.71347 8.44254L8.02695 8.51735C7.78179 8.5437 7.53476 8.49 7.32123 8.36391C7.10862 8.23747 6.94056 8.04537 6.84115 7.81515L6.55843 7.16919C6.47502 6.97691 6.3389 6.81353 6.16658 6.69888C5.99425 6.58422 5.79313 6.5232 5.5876 6.52324C5.38207 6.5232 5.18094 6.58422 5.00862 6.69888C4.8363 6.81353 4.70017 6.97691 4.61676 7.16919L4.33618 7.81515C4.23677 8.04537 4.06871 8.23747 3.8561 8.36391C3.64257 8.49 3.39554 8.5437 3.15038 8.51735L2.46172 8.44254C2.25737 8.42041 2.05113 8.45945 1.86801 8.55492C1.6849 8.65038 1.53277 8.79818 1.43008 8.98038C1.32726 9.16248 1.27827 9.3712 1.28906 9.58124C1.29986 9.79127 1.36997 9.99359 1.49089 10.1636L1.89736 10.7353C2.04232 10.9394 2.12038 11.1852 2.12033 11.4375C2.12038 11.6898 2.04232 11.9357 1.89736 12.1397L1.49089 12.7114C1.36997 12.8815 1.29986 13.0838 1.28906 13.2938C1.27827 13.5038 1.32726 13.7126 1.43008 13.8947C1.53287 14.0768 1.68502 14.2245 1.86811 14.3199C2.0512 14.4154 2.25738 14.4545 2.46172 14.4325L3.14824 14.3577C3.39341 14.3313 3.64043 14.3851 3.85397 14.5111C4.06738 14.6372 4.23621 14.8294 4.33618 15.0599Z' stroke='%231A31FF' stroke-width='1.25' stroke-linecap='round' stroke-linejoin='round'/%3E%3Cpath d='M5.58674 12.9118C6.38217 12.9118 7.02699 12.2518 7.02699 11.4375C7.02699 10.6233 6.38217 9.96324 5.58674 9.96324C4.79131 9.96324 4.14649 10.6233 4.14649 11.4375C4.14649 12.2518 4.79131 12.9118 5.58674 12.9118Z' stroke='%231A31FF' stroke-width='1.25' stroke-linecap='round' stroke-linejoin='round'/%3E%3Cpath d='M13.7396 8.55338C13.8379 8.32775 14.0033 8.13965 14.2122 8.01588C14.4224 7.89176 14.6655 7.8389 14.9069 7.86484L15.5826 7.93848C15.7838 7.96026 15.9868 7.92183 16.1671 7.82786C16.3473 7.73388 16.4971 7.5884 16.5982 7.40904C16.6994 7.22979 16.7476 7.02432 16.737 6.81757C16.7264 6.61082 16.6573 6.41166 16.5383 6.24428L16.1382 5.68151C15.9957 5.47964 15.9196 5.23664 15.9208 4.9876C15.9208 4.73924 15.9976 4.49725 16.1403 4.29638L16.5404 3.73361C16.6594 3.56622 16.7285 3.36707 16.7391 3.16032C16.7497 2.95357 16.7015 2.7481 16.6003 2.56885C16.4992 2.38949 16.3494 2.24401 16.1692 2.15003C15.9889 2.05606 15.7859 2.01763 15.5847 2.03941L14.909 2.11305C14.6676 2.13899 14.4245 2.08613 14.2143 1.96201C14.005 1.83754 13.8395 1.64845 13.7417 1.42183L13.4634 0.785963C13.3813 0.596685 13.2473 0.435859 13.0776 0.322992C12.908 0.210126 12.71 0.150067 12.5077 0.150101C12.3054 0.150067 12.1074 0.210126 11.9378 0.322992C11.7682 0.435859 11.6342 0.596685 11.5521 0.785963L11.2759 1.42183C11.178 1.64845 11.0126 1.83754 10.8033 1.96201C10.5931 2.08613 10.3499 2.13899 10.1086 2.11305L9.43068 2.03941C9.22952 2.01763 9.0265 2.05606 8.84625 2.15003C8.666 2.24401 8.51625 2.38949 8.41516 2.56885C8.31394 2.7481 8.26572 2.95357 8.27635 3.16032C8.28697 3.36707 8.35599 3.56622 8.47502 3.73361L8.87514 4.29638C9.01783 4.49725 9.09467 4.73924 9.09463 4.9876M13.9246 4.9876C13.9246 5.7891 13.2899 6.43885 12.5069 6.43885C11.7239 6.43885 11.0891 5.7891 11.0891 4.9876C11.0891 4.1861 11.7239 3.53635 12.5069 3.53635C13.2899 3.53635 13.9246 4.1861 13.9246 4.9876Z' stroke='%231A31FF' stroke-width='1.25' stroke-linecap='round' stroke-linejoin='round'/%3E%3C/g%3E%3Cdefs%3E%3CclipPath id='clip0_220_78'%3E%3Crect width='18' height='18' fill='white'/%3E%3C/clipPath%3E%3C/defs%3E%3C/svg%3E)
' fill='%231A31FF'/%3E%3Cpath d='M162.001 105V78.75M132.001 105V67.5M102.001 105L102.001 90M137.276 48.8531L156.657 56.1213M127.496 50.2535L106.502 65.9994M165.978 54.1475C168.175 56.3442 168.175 59.9058 165.978 62.1025C163.782 64.2992 160.22 64.2992 158.023 62.1025C155.827 59.9058 155.827 56.3442 158.023 54.1475C160.22 51.9508 163.782 51.9508 165.978 54.1475ZM105.978 65.3975C108.175 67.5942 108.175 71.1558 105.978 73.3525C103.782 75.5492 100.22 75.5492 98.0233 73.3525C95.8266 71.1558 95.8266 67.5942 98.0233 65.3975C100.22 63.2008 103.782 63.2008 105.978 65.3975ZM135.978 42.8975C138.175 45.0942 138.175 48.6558 135.978 50.8525C133.782 53.0492 130.22 53.0492 128.023 50.8525C125.827 48.6558 125.827 45.0942 128.023 42.8975C130.22 40.7008 133.782 40.7008 135.978 42.8975Z' stroke='%235F6FFF' stroke-width='7.5' stroke-linecap='round' stroke-linejoin='round'/%3E%3Cpath d='M137.276 48.8531L156.657 56.1213M127.496 50.2535L106.502 65.9994M165.978 54.1475C168.175 56.3442 168.175 59.9058 165.978 62.1025C163.782 64.2992 160.22 64.2992 158.023 62.1025C155.827 59.9058 155.827 56.3442 158.023 54.1475C160.22 51.9508 163.782 51.9508 165.978 54.1475ZM105.978 65.3975C108.175 67.5942 108.175 71.1558 105.978 73.3525C103.782 75.5492 100.22 75.5492 98.0233 73.3525C95.8266 71.1558 95.8266 67.5942 98.0233 65.3975C100.22 63.2008 103.782 63.2008 105.978 65.3975ZM135.978 42.8975C138.175 45.0942 138.175 48.6558 135.978 50.8525C133.782 53.0492 130.22 53.0492 128.023 50.8525C125.827 48.6558 125.827 45.0942 128.023 42.8975C130.22 40.7008 133.782 40.7008 135.978 42.8975Z' stroke='white' stroke-width='7.5' stroke-linecap='round' stroke-linejoin='round'/%3E%3C/svg%3E)


'%3E%3Cpath d='M2.01506 11.7338L3.44621 10.9077C3.52373 10.8629 3.6147 10.8474 3.70268 10.8638L6.51855 11.3908C6.74996 11.4341 6.96358 11.256 6.96254 11.0206L6.95157 8.55334C6.95127 8.4863 6.96895 8.42042 7.00276 8.36253L8.4238 5.92966C8.49776 5.80304 8.49113 5.64494 8.40684 5.52495L6.01419 2.11926M14.2502 3.64429C10.1252 5.62503 12.375 8.25003 13.1252 8.62503C14.533 9.32881 16.4907 9.37499 16.4907 9.37499C16.4969 9.25076 16.5 9.12575 16.5 9C16.5 4.85786 13.1421 1.5 9 1.5C4.85786 1.5 1.5 4.85786 1.5 9C1.5 13.1421 4.85786 16.5 9 16.5C9.12575 16.5 9.25077 16.4969 9.375 16.4908M12.5683 16.4548L10.1933 10.1933L16.4548 12.5683L13.6782 13.6782L12.5683 16.4548Z' stroke='%231A31FF' stroke-width='1.25' stroke-linecap='round' stroke-linejoin='round'/%3E%3C/g%3E%3Cdefs%3E%3CclipPath id='clip0_528_18011'%3E%3Crect width='18' height='18' fill='white'/%3E%3C/clipPath%3E%3C/defs%3E%3C/svg%3E%0A)
' fill='%231A31FF'/%3E%3Cg clip-path='url(%23clip0_1139_22951)'%3E%3Cpath d='M167.062 42.625H96.9375C95.1771 42.625 93.75 44.0521 93.75 45.8125V103.188C93.75 104.948 95.1771 106.375 96.9375 106.375H167.062C168.823 106.375 170.25 104.948 170.25 103.188V45.8125C170.25 44.0521 168.823 42.625 167.062 42.625Z' stroke='%235F6FFF' stroke-width='6.375' stroke-linecap='round' stroke-linejoin='round'/%3E%3Cpath d='M108.094 61.75C110.734 61.75 112.875 59.6094 112.875 56.9688C112.875 54.3281 110.734 52.1875 108.094 52.1875C105.453 52.1875 103.312 54.3281 103.312 56.9688C103.312 59.6094 105.453 61.75 108.094 61.75Z' fill='%235F6FFF'/%3E%3Cpath d='M124.031 61.75C126.672 61.75 128.812 59.6094 128.812 56.9688C128.812 54.3281 126.672 52.1875 124.031 52.1875C121.391 52.1875 119.25 54.3281 119.25 56.9688C119.25 59.6094 121.391 61.75 124.031 61.75Z' fill='%235F6FFF'/%3E%3C/g%3E%3Cpath d='M169.695 82.7879C170.576 82.3134 171.017 82.0762 171.128 81.7908C171.225 81.5431 171.197 81.2642 171.055 81.0399C170.89 80.7816 170.412 80.6343 169.455 80.3397L150.742 74.5752C149.961 74.3346 149.57 74.2143 149.306 74.3111C149.077 74.3954 148.895 74.5765 148.811 74.8063C148.714 75.0701 148.835 75.4608 149.075 76.242L154.84 94.9554C155.134 95.9117 155.282 96.3899 155.54 96.5545C155.764 96.6974 156.043 96.7247 156.291 96.628C156.576 96.5166 156.813 96.0761 157.288 95.195L161.441 87.4825C161.511 87.3516 161.547 87.2861 161.592 87.2288C161.632 87.178 161.678 87.132 161.729 87.0918C161.786 87.0465 161.852 87.0112 161.983 86.9407L169.695 82.7879Z' fill='white'/%3E%3Cpath d='M150 66.3333V63.8333M143.434 68.9344L141.667 67.1666M143.434 82.1666L141.667 83.9344M156.667 68.9344L158.434 67.1666M140.833 75.4999H138.333M161.441 87.4825L157.288 95.195C156.813 96.0761 156.576 96.5166 156.291 96.628C156.043 96.7247 155.764 96.6974 155.54 96.5545C155.282 96.3899 155.134 95.9117 154.84 94.9554L149.075 76.242C148.835 75.4608 148.714 75.0701 148.811 74.8063C148.895 74.5765 149.077 74.3954 149.306 74.3111C149.57 74.2143 149.961 74.3346 150.742 74.5752L169.455 80.3397C170.412 80.6343 170.89 80.7816 171.055 81.0399C171.197 81.2642 171.225 81.5431 171.128 81.7908C171.017 82.0762 170.576 82.3134 169.695 82.7879L161.983 86.9407C161.852 87.0112 161.786 87.0465 161.729 87.0918C161.678 87.132 161.632 87.178 161.592 87.2288C161.547 87.2861 161.511 87.3516 161.441 87.4825Z' stroke='white' stroke-width='3.33333' stroke-linecap='round' stroke-linejoin='round'/%3E%3Cdefs%3E%3CclipPath id='clip0_1139_22951'%3E%3Crect width='102' height='102' fill='white' transform='translate(81 23.5)'/%3E%3C/clipPath%3E%3C/defs%3E%3C/svg%3E)


'%3E%3Cpath d='M15.9 16.5C16.11 16.5 16.215 16.5 16.2952 16.4591C16.3658 16.4232 16.4232 16.3658 16.4591 16.2952C16.5 16.215 16.5 16.11 16.5 15.9V8.1C16.5 7.88998 16.5 7.78497 16.4591 7.70475C16.4232 7.63419 16.3658 7.57683 16.2952 7.54087C16.215 7.5 16.11 7.5 15.9 7.5L14.1 7.5C13.89 7.5 13.785 7.5 13.7048 7.54087C13.6342 7.57683 13.5768 7.63419 13.5409 7.70475C13.5 7.78497 13.5 7.88998 13.5 8.1V9.9C13.5 10.11 13.5 10.215 13.4591 10.2952C13.4232 10.3658 13.3658 10.4232 13.2952 10.4591C13.215 10.5 13.11 10.5 12.9 10.5H11.1C10.89 10.5 10.785 10.5 10.7048 10.5409C10.6342 10.5768 10.5768 10.6342 10.5409 10.7048C10.5 10.785 10.5 10.89 10.5 11.1V12.9C10.5 13.11 10.5 13.215 10.4591 13.2952C10.4232 13.3658 10.3658 13.4232 10.2952 13.4591C10.215 13.5 10.11 13.5 9.9 13.5H8.1C7.88998 13.5 7.78497 13.5 7.70475 13.5409C7.63419 13.5768 7.57683 13.6342 7.54087 13.7048C7.5 13.785 7.5 13.89 7.5 14.1V15.9C7.5 16.11 7.5 16.215 7.54087 16.2952C7.57683 16.3658 7.63419 16.4232 7.70475 16.4591C7.78497 16.5 7.88998 16.5 8.1 16.5L15.9 16.5Z' stroke='%231A31FF' stroke-width='1.25' stroke-linecap='round' stroke-linejoin='round'/%3E%3Cpath d='M7.5 5.1C7.5 4.88998 7.5 4.78497 7.54087 4.70475C7.57683 4.63419 7.63419 4.57683 7.70475 4.54087C7.78497 4.5 7.88998 4.5 8.1 4.5H9.9C10.11 4.5 10.215 4.5 10.2952 4.54087C10.3658 4.57683 10.4232 4.63419 10.4591 4.70475C10.5 4.78497 10.5 4.88998 10.5 5.1V6.9C10.5 7.11002 10.5 7.21503 10.4591 7.29525C10.4232 7.36581 10.3658 7.42317 10.2952 7.45913C10.215 7.5 10.11 7.5 9.9 7.5H8.1C7.88998 7.5 7.78497 7.5 7.70475 7.45913C7.63419 7.42317 7.57683 7.36581 7.54087 7.29525C7.5 7.21503 7.5 7.11002 7.5 6.9V5.1Z' stroke='%231A31FF' stroke-width='1.25' stroke-linecap='round' stroke-linejoin='round'/%3E%3Cpath d='M2.25 9.6C2.25 9.38998 2.25 9.28497 2.29087 9.20475C2.32683 9.13419 2.38419 9.07683 2.45475 9.04087C2.53497 9 2.63998 9 2.85 9H4.65C4.86002 9 4.96503 9 5.04525 9.04087C5.11581 9.07683 5.17317 9.13419 5.20913 9.20475C5.25 9.28497 5.25 9.38998 5.25 9.6V11.4C5.25 11.61 5.25 11.715 5.20913 11.7952C5.17317 11.8658 5.11581 11.9232 5.04525 11.9591C4.96503 12 4.86002 12 4.65 12H2.85C2.63998 12 2.53497 12 2.45475 11.9591C2.38419 11.9232 2.32683 11.8658 2.29087 11.7952C2.25 11.715 2.25 11.61 2.25 11.4V9.6Z' stroke='%231A31FF' stroke-width='1.25' stroke-linecap='round' stroke-linejoin='round'/%3E%3Cpath d='M1.5 2.1C1.5 1.88998 1.5 1.78497 1.54087 1.70475C1.57683 1.63419 1.63419 1.57683 1.70475 1.54087C1.78497 1.5 1.88998 1.5 2.1 1.5H3.9C4.11002 1.5 4.21503 1.5 4.29525 1.54087C4.36581 1.57683 4.42317 1.63419 4.45913 1.70475C4.5 1.78497 4.5 1.88998 4.5 2.1V3.9C4.5 4.11002 4.5 4.21503 4.45913 4.29525C4.42317 4.36581 4.36581 4.42317 4.29525 4.45913C4.21503 4.5 4.11002 4.5 3.9 4.5H2.1C1.88998 4.5 1.78497 4.5 1.70475 4.45913C1.63419 4.42317 1.57683 4.36581 1.54087 4.29525C1.5 4.21503 1.5 4.11002 1.5 3.9V2.1Z' stroke='%231A31FF' stroke-width='1.25' stroke-linecap='round' stroke-linejoin='round'/%3E%3C/g%3E%3Cdefs%3E%3CclipPath id='clip0_441_6429'%3E%3Crect width='18' height='18' fill='white'/%3E%3C/clipPath%3E%3C/defs%3E%3C/svg%3E%0A)

' fill='%231A31FF'/%3E%3Cpath d='M162 67.8333H102M162 94.5H102M162 54.5H102M162 81.1667H102' stroke='%235F6FFF' stroke-width='6.66667' stroke-linecap='round' stroke-linejoin='round'/%3E%3Cpath d='M162 54.5H102' stroke='white' stroke-width='6.66667' stroke-linecap='round' stroke-linejoin='round'/%3E%3Cpath d='M79.9993 59.0839C79.9993 60.023 79.9994 60.4926 80.1933 60.7403C80.362 60.9558 80.6186 61.0841 80.8923 61.0898C81.2067 61.0963 81.5824 60.8146 82.3338 60.2511L89.3856 54.9622C89.9136 54.5662 90.1776 54.3682 90.272 54.1255C90.3547 53.9129 90.3547 53.677 90.272 53.4644C90.1776 53.2217 89.9136 53.0237 89.3856 52.6277L82.3338 47.3388C81.5824 46.7753 81.2067 46.4936 80.8923 46.5001C80.6186 46.5058 80.362 46.6341 80.1933 46.8496C79.9994 47.0973 79.9993 47.5669 79.9993 48.506V59.0839Z' fill='white' stroke='white' stroke-width='3.64752' stroke-linecap='round' stroke-linejoin='round'/%3E%3C/svg%3E)


'%3E%3Cpath d='M4.5 4.5L6 3M6 3L4.5 1.5M6 3H4.5C2.84315 3 1.5 4.34315 1.5 6M13.5 13.5L12 15M12 15L13.5 16.5M12 15H13.5C15.1569 15 16.5 13.6569 16.5 12M7.64177 4.875C8.14132 2.93412 9.90318 1.5 12 1.5C14.4853 1.5 16.5 3.51472 16.5 6C16.5 8.0968 15.0659 9.85865 13.125 10.3582M10.5 12C10.5 14.4853 8.48528 16.5 6 16.5C3.51472 16.5 1.5 14.4853 1.5 12C1.5 9.51472 3.51472 7.5 6 7.5C8.48528 7.5 10.5 9.51472 10.5 12Z' stroke='%231A31FF' stroke-width='1.25' stroke-linecap='round' stroke-linejoin='round'/%3E%3C/g%3E%3Cdefs%3E%3CclipPath id='clip0_220_357'%3E%3Crect width='18' height='18' fill='white'/%3E%3C/clipPath%3E%3C/defs%3E%3C/svg%3E)


'%3E%3Cpath d='M8.25 3.375H13.725C14.5651 3.375 14.9851 3.375 15.306 3.53849C15.5882 3.6823 15.8177 3.91177 15.9615 4.19401C16.125 4.51488 16.125 4.93492 16.125 5.775V6.75C16.125 7.44891 16.125 7.79837 16.0108 8.07403C15.8586 8.44157 15.5666 8.73358 15.199 8.88582C14.9234 9 14.5739 9 13.875 9M9.75 14.625H4.275C3.43492 14.625 3.01488 14.625 2.69401 14.4615C2.41177 14.3177 2.1823 14.0882 2.03849 13.806C1.875 13.4851 1.875 13.0651 1.875 12.225V11.25C1.875 10.5511 1.875 10.2016 1.98918 9.92598C2.14142 9.55843 2.43343 9.26642 2.80097 9.11418C3.07663 9 3.42609 9 4.125 9M7.725 10.875H10.275C10.485 10.875 10.59 10.875 10.6702 10.8341C10.7408 10.7982 10.7982 10.7408 10.8341 10.6702C10.875 10.59 10.875 10.485 10.875 10.275V7.725C10.875 7.51498 10.875 7.40997 10.8341 7.32975C10.7982 7.25919 10.7408 7.20183 10.6702 7.16587C10.59 7.125 10.485 7.125 10.275 7.125H7.725C7.51498 7.125 7.40997 7.125 7.32975 7.16587C7.25919 7.20183 7.20183 7.25919 7.16587 7.32975C7.125 7.40997 7.125 7.51498 7.125 7.725V10.275C7.125 10.485 7.125 10.59 7.16587 10.6702C7.20183 10.7408 7.25919 10.7982 7.32975 10.8341C7.40997 10.875 7.51498 10.875 7.725 10.875ZM13.35 16.5H15.9C16.11 16.5 16.215 16.5 16.2952 16.4591C16.3658 16.4232 16.4232 16.3658 16.4591 16.2952C16.5 16.215 16.5 16.11 16.5 15.9V13.35C16.5 13.14 16.5 13.035 16.4591 12.9548C16.4232 12.8842 16.3658 12.8268 16.2952 12.7909C16.215 12.75 16.11 12.75 15.9 12.75H13.35C13.14 12.75 13.035 12.75 12.9548 12.7909C12.8842 12.8268 12.8268 12.8842 12.7909 12.9548C12.75 13.035 12.75 13.14 12.75 13.35V15.9C12.75 16.11 12.75 16.215 12.7909 16.2952C12.8268 16.3658 12.8842 16.4232 12.9548 16.4591C13.035 16.5 13.14 16.5 13.35 16.5ZM2.1 5.25H4.65C4.86002 5.25 4.96503 5.25 5.04525 5.20913C5.11581 5.17317 5.17317 5.11581 5.20913 5.04525C5.25 4.96503 5.25 4.86002 5.25 4.65V2.1C5.25 1.88998 5.25 1.78497 5.20913 1.70475C5.17317 1.63419 5.11581 1.57683 5.04525 1.54087C4.96503 1.5 4.86002 1.5 4.65 1.5H2.1C1.88998 1.5 1.78497 1.5 1.70475 1.54087C1.63419 1.57683 1.57683 1.63419 1.54087 1.70475C1.5 1.78497 1.5 1.88998 1.5 2.1V4.65C1.5 4.86002 1.5 4.96503 1.54087 5.04525C1.57683 5.11581 1.63419 5.17317 1.70475 5.20913C1.78497 5.25 1.88998 5.25 2.1 5.25Z' stroke='%231A31FF' stroke-width='1.25' stroke-linecap='round' stroke-linejoin='round'/%3E%3C/g%3E%3Cdefs%3E%3CclipPath id='clip0_220_448'%3E%3Crect width='18' height='18' fill='white'/%3E%3C/clipPath%3E%3C/defs%3E%3C/svg%3E)


'%3E%3Cpath d='M4.58981 14.939L4.94322 15.7526C5.04827 15.9948 5.21972 16.2005 5.43677 16.3449C5.65382 16.4894 5.90715 16.5662 6.16602 16.5662C6.42489 16.5662 6.67822 16.4894 6.89527 16.3449C7.11232 16.2005 7.28377 15.9948 7.38882 15.7526L7.74223 14.939C7.86803 14.6503 8.07965 14.4096 8.34691 14.2512C8.61587 14.0924 8.927 14.0248 9.2358 14.0579L10.1005 14.1522C10.3579 14.18 10.6177 14.1309 10.8483 14.0106C11.0789 13.8904 11.2705 13.7042 11.3999 13.4747C11.5294 13.2454 11.5911 12.9825 11.5775 12.7179C11.5639 12.4534 11.4756 12.1986 11.3233 11.9844L10.8113 11.2643C10.629 11.006 10.5316 10.6951 10.5332 10.3764C10.5331 10.0586 10.6314 9.74901 10.814 9.49199L11.326 8.77191C11.4783 8.55773 11.5666 8.30291 11.5802 8.03836C11.5938 7.77382 11.5321 7.51092 11.4026 7.28156C11.2732 7.05207 11.0816 6.86591 10.851 6.74567C10.6203 6.62543 10.3606 6.57626 10.1032 6.60413L9.23848 6.69835C8.92969 6.73155 8.61855 6.6639 8.3496 6.50509C8.0818 6.34583 7.87013 6.10387 7.74492 5.81391L7.38882 5.0003C7.28377 4.75811 7.11232 4.55233 6.89527 4.40791C6.67822 4.2635 6.42489 4.18665 6.16602 4.18669C5.90715 4.18665 5.65382 4.2635 5.43677 4.40791C5.21972 4.55233 5.04827 4.75811 4.94322 5.0003L4.58981 5.81391C4.4646 6.10387 4.25293 6.34583 3.98513 6.50509C3.71618 6.6639 3.40504 6.73155 3.09624 6.69835L2.22886 6.60413C1.97146 6.57626 1.7117 6.62543 1.48106 6.74567C1.25042 6.86591 1.05881 7.05207 0.929462 7.28156C0.799951 7.51092 0.738251 7.77382 0.751847 8.03836C0.765443 8.30291 0.85375 8.55773 1.00606 8.77191L1.51802 9.49199C1.7006 9.74901 1.79892 10.0586 1.79886 10.3764C1.79892 10.6942 1.7006 11.0039 1.51802 11.2609L1.00606 11.9809C0.85375 12.1951 0.765443 12.4499 0.751847 12.7145C0.738251 12.979 0.799951 13.2419 0.929462 13.4713C1.05893 13.7007 1.25057 13.8867 1.48117 14.007C1.71178 14.1272 1.97148 14.1764 2.22886 14.1487L3.09356 14.0545C3.40235 14.0213 3.71349 14.089 3.98244 14.2478C4.25124 14.4066 4.4639 14.6486 4.58981 14.939Z' stroke='%231A31FF' stroke-width='1.25' stroke-linecap='round' stroke-linejoin='round'/%3E%3Cpath d='M6.16494 12.2334C7.16681 12.2334 7.97899 11.402 7.97899 10.3764C7.97899 9.35088 7.16681 8.51951 6.16494 8.51951C5.16307 8.51951 4.35089 9.35088 4.35089 10.3764C4.35089 11.402 5.16307 12.2334 6.16494 12.2334Z' stroke='%231A31FF' stroke-width='1.25' stroke-linecap='round' stroke-linejoin='round'/%3E%3Cpath d='M14.1262 7.98059C14.2162 7.77391 14.3677 7.6016 14.5591 7.48822C14.7516 7.37453 14.9744 7.3261 15.1954 7.34987L15.8145 7.41732C15.9987 7.43727 16.1847 7.40207 16.3498 7.31599C16.5149 7.22991 16.6521 7.09664 16.7447 6.93234C16.8374 6.76814 16.8816 6.57993 16.8719 6.39054C16.8621 6.20115 16.7989 6.01872 16.6899 5.86538L16.3234 5.34988C16.1929 5.16495 16.1231 4.94236 16.1242 4.71423C16.1242 4.48673 16.1946 4.26506 16.3253 4.08105L16.6918 3.56554C16.8008 3.41221 16.8641 3.22978 16.8738 3.04039C16.8835 2.851 16.8394 2.66279 16.7466 2.49859C16.654 2.33429 16.5169 2.20102 16.3517 2.11494C16.1866 2.02886 16.0007 1.99366 15.8164 2.01361L15.1973 2.08106C14.9763 2.10483 14.7535 2.0564 14.561 1.94271C14.3693 1.82869 14.2177 1.65547 14.1281 1.44788L13.8732 0.865412C13.7979 0.692028 13.6752 0.544707 13.5198 0.441317C13.3644 0.337928 13.1831 0.282913 12.9977 0.282944C12.8124 0.282913 12.6311 0.337928 12.4757 0.441317C12.3203 0.544707 12.1975 0.692028 12.1223 0.865412L11.8693 1.44788C11.7797 1.65547 11.6281 1.82869 11.4364 1.94271C11.2439 2.0564 11.0211 2.10483 10.8001 2.08106L10.1791 2.01361C9.99482 1.99366 9.80885 2.02886 9.64373 2.11494C9.47861 2.20102 9.34144 2.33429 9.24884 2.49859C9.15612 2.66279 9.11195 2.851 9.12168 3.04039C9.13142 3.22978 9.19464 3.41221 9.30367 3.56554L9.67019 4.08105C9.8009 4.26506 9.87129 4.48673 9.87125 4.71423M14.2957 4.71423C14.2957 5.44843 13.7142 6.04362 12.997 6.04362C12.2797 6.04362 11.6983 5.44843 11.6983 4.71423C11.6983 3.98003 12.2797 3.38485 12.997 3.38485C13.7142 3.38485 14.2957 3.98003 14.2957 4.71423Z' stroke='%231A31FF' stroke-width='1.25' stroke-linecap='round' stroke-linejoin='round'/%3E%3C/g%3E%3Cdefs%3E%3CclipPath id='clip0_220_424'%3E%3Crect width='18' height='18' fill='white'/%3E%3C/clipPath%3E%3C/defs%3E%3C/svg%3E)


'%3E%3Cpath d='M12.7271 8.32943C13.5367 8.32943 14.193 7.67312 14.193 6.86352C14.193 6.05392 13.5367 5.39761 12.7271 5.39761C11.9175 5.39761 11.2612 6.05392 11.2612 6.86352C11.2612 7.67312 11.9175 8.32943 12.7271 8.32943Z' stroke='%231A31FF' stroke-width='1.25' stroke-linecap='round' stroke-linejoin='round'/%3E%3Cpath d='M5.39755 14.1932C6.20715 14.1932 6.86346 13.5369 6.86346 12.7273C6.86346 11.9177 6.20715 11.2614 5.39755 11.2614C4.58795 11.2614 3.93164 11.9177 3.93164 12.7273C3.93164 13.5369 4.58795 14.1932 5.39755 14.1932Z' stroke='%231A31FF' stroke-width='1.25' stroke-linecap='round' stroke-linejoin='round'/%3E%3Cpath d='M11.2613 17.1251V11.9944L5.39771 6.1308V1.00012' stroke='%231A31FF' stroke-width='1.25' stroke-linecap='round' stroke-linejoin='round'/%3E%3Cpath d='M5.39771 11.2613V6.13058' stroke='%231A31FF' stroke-width='1.25' stroke-linecap='round' stroke-linejoin='round'/%3E%3Cpath d='M16.392 1H1.73295C1.32815 1 1 1.32815 1 1.73295V16.392C1 16.7968 1.32815 17.125 1.73295 17.125H16.392C16.7968 17.125 17.125 16.7968 17.125 16.392V1.73295C17.125 1.32815 16.7968 1 16.392 1Z' stroke='%231A31FF' stroke-width='1.25' stroke-linecap='round' stroke-linejoin='round'/%3E%3Cpath d='M9.79541 1.00012V3.93194L11.691 5.82754' stroke='%231A31FF' stroke-width='1.25' stroke-linecap='round' stroke-linejoin='round'/%3E%3C/g%3E%3Cdefs%3E%3CclipPath id='clip0_220_242'%3E%3Crect width='18' height='18' fill='white'/%3E%3C/clipPath%3E%3C/defs%3E%3C/svg%3E)


' fill='%231A31FF'/%3E%3Cpath d='M29.7152 27.4452C29.7152 24.0541 29.7152 22.3585 30.3752 21.0633C30.9557 19.924 31.882 18.9977 33.0213 18.4172C34.3165 17.7573 36.0121 17.7573 39.4032 17.7573H40.0087C41.7042 17.7573 42.552 17.7573 43.1996 18.0872C43.7692 18.3775 44.2324 18.8406 44.5226 19.4103C44.8526 20.0579 44.8526 20.9057 44.8526 22.6012V35.6194C44.8526 37.3149 44.8526 38.1627 44.5226 38.8103C44.2324 39.3799 43.7692 39.8431 43.1996 40.1333C42.552 40.4633 41.7042 40.4633 40.0087 40.4633H37.9275C36.0319 40.4633 35.0841 40.4633 34.2238 40.7246C33.4621 40.9559 32.7535 41.3351 32.1386 41.8405C31.444 42.4114 30.9182 43.2001 29.8667 44.7773L29.7152 45.0045L29.5638 44.7773C28.5123 43.2001 27.9865 42.4114 27.2919 41.8405C26.677 41.3351 25.9684 40.9559 25.2067 40.7246C24.3464 40.4633 23.3986 40.4633 21.503 40.4633H19.4218C17.7263 40.4633 16.8785 40.4633 16.2309 40.1333C15.6613 39.8431 15.1981 39.3799 14.9079 38.8103C14.5779 38.1627 14.5779 37.3149 14.5779 35.6194V22.6012C14.5779 20.9057 14.5779 20.0579 14.9079 19.4103C15.1981 18.8406 15.6613 18.3775 16.2309 18.0872C16.8785 17.7573 17.7263 17.7573 19.4218 17.7573H20.0273C23.4184 17.7573 25.114 17.7573 26.4092 18.4172C27.5485 18.9977 28.4748 19.924 29.0553 21.0633C29.7152 22.3585 29.7152 24.0541 29.7152 27.4452ZM29.7152 45.0045V27.4452' stroke='%235F6FFF' stroke-width='3.02747' stroke-linecap='round' stroke-linejoin='round'/%3E%3Cpath d='M38.7512 26.8681C38.8545 26.5994 38.9061 26.4651 38.9736 26.3394C39.0335 26.2278 39.1027 26.1214 39.1803 26.0213C39.2678 25.9086 39.3695 25.8069 39.5731 25.6033L48.1104 17.0661C48.9464 16.2301 50.3018 16.2301 51.1378 17.0661C51.9738 17.9021 51.9738 19.2575 51.1378 20.0936L42.6005 28.6308C42.397 28.8343 42.2953 28.9361 42.1826 29.0235C42.0825 29.1012 41.9761 29.1704 41.8644 29.2303C41.7388 29.2977 41.6045 29.3494 41.3358 29.4527L37.1357 31.0681L38.7512 26.8681Z' fill='white'/%3E%3Cpath d='M38.6935 27.0181C38.8049 26.7283 38.8607 26.5834 38.9563 26.517C39.0398 26.459 39.1432 26.4371 39.2431 26.4561C39.3574 26.478 39.4672 26.5878 39.6868 26.8073L41.3966 28.5172C41.6162 28.7367 41.7259 28.8465 41.7478 28.9608C41.7668 29.0607 41.7449 29.1641 41.6869 29.2476C41.6205 29.3432 41.4756 29.399 41.1858 29.5104L37.1357 31.0681L38.6935 27.0181Z' fill='white'/%3E%3Cpath d='M37.1357 31.0681L41.3358 29.4527C41.6045 29.3494 41.7388 29.2977 41.8644 29.2303C41.9761 29.1704 42.0825 29.1012 42.1826 29.0235C42.2953 28.9361 42.397 28.8343 42.6005 28.6308L51.1378 20.0936C51.9738 19.2575 51.9738 17.9021 51.1378 17.0661C50.3018 16.2301 48.9464 16.2301 48.1104 17.0661L39.5731 25.6033C39.3695 25.8069 39.2678 25.9086 39.1803 26.0213C39.1027 26.1214 39.0335 26.2278 38.9736 26.3394C38.9061 26.4651 38.8545 26.5994 38.7512 26.8681L37.1357 31.0681ZM37.1357 31.0681L38.6935 27.0181C38.8049 26.7283 38.8607 26.5834 38.9563 26.517C39.0398 26.459 39.1432 26.4371 39.2431 26.4561C39.3574 26.478 39.4672 26.5878 39.6868 26.8073L41.3966 28.5172C41.6162 28.7367 41.7259 28.8465 41.7478 28.9608C41.7668 29.0607 41.7449 29.1641 41.6869 29.2476C41.6205 29.3432 41.4756 29.399 41.1858 29.5104L37.1357 31.0681Z' stroke='white' stroke-width='1.51374' stroke-linecap='round' stroke-linejoin='round'/%3E%3C/svg%3E)
' fill='white'/%3E%3Crect width='110.56' height='62.19' transform='translate(-25.0007 -0.999786)' fill='%231A31FF'/%3E%3Cpath d='M23.0388 38.8807H37.5169M23.0388 33.8134H30.4847M25.3139 18.6114H22.3149H20.1432C18.544 18.6114 17.2476 19.9078 17.2476 21.507V41.7763C17.2476 43.3755 18.544 44.672 20.1432 44.672H40.4125C42.0117 44.672 43.3081 43.3755 43.3081 41.7763V21.507C43.3081 19.9078 42.0117 18.6114 40.4125 18.6114H38.2408H35.2418' stroke='%235F6FFF' stroke-width='2.89562' stroke-linecap='round' stroke-linejoin='round'/%3E%3Cpath d='M30.2776 23.5756C32.6764 23.5756 34.621 21.6309 34.621 19.2321C34.621 16.8333 32.6764 14.8887 30.2776 14.8887C27.8788 14.8887 25.9341 16.8333 25.9341 19.2321C25.9341 21.6309 27.8788 23.5756 30.2776 23.5756ZM30.2776 23.5756L30.3086 23.5753L25.6861 28.1978L21.5911 24.1028L25.9626 19.7312M30.2776 23.5756L34.9002 28.1978L38.9952 24.1028L34.6236 19.7312' stroke='white' stroke-width='2.89562' stroke-linecap='round' stroke-linejoin='round'/%3E%3C/svg%3E)
' fill='%231A31FF'/%3E%3Cg clip-path='url(%23clip0_1146_27749)'%3E%3Cpath d='M27.1519 22.8457C27.1519 22.249 27.1519 21.9506 27.2766 21.784C27.3853 21.6388 27.5517 21.548 27.7325 21.5351C27.9401 21.5202 28.1911 21.6816 28.6931 22.0043L34.5957 25.7988C35.0313 26.0788 35.2491 26.2189 35.3243 26.3969C35.39 26.5525 35.39 26.728 35.3243 26.8836C35.2491 27.0616 35.0313 27.2016 34.5957 27.4817L28.6931 31.2762C28.1911 31.5989 27.9401 31.7602 27.7325 31.7454C27.5517 31.7325 27.3853 31.6417 27.2766 31.4965C27.1519 31.3299 27.1519 31.0315 27.1519 30.4347V22.8457Z' stroke='%235F6FFF' stroke-width='2.50076' stroke-linecap='round' stroke-linejoin='round'/%3E%3Cpath d='M16.6553 21.3886C16.6553 19.2878 16.6553 18.2374 17.0641 17.435C17.4238 16.7291 17.9976 16.1553 18.7034 15.7957C19.5058 15.3868 20.5563 15.3868 22.6571 15.3868L37.8986 15.3868C39.9994 15.3868 41.0498 15.3868 41.8523 15.7957C42.5581 16.1553 43.1319 16.7291 43.4916 17.435C43.9004 18.2374 43.9004 19.2878 43.9004 21.3886V31.8918C43.9004 33.9927 43.9004 35.0431 43.4916 35.8455C43.1319 36.5513 42.5581 37.1252 41.8523 37.4848C41.0498 37.8937 39.9994 37.8937 37.8986 37.8937H22.6571C20.5563 37.8937 19.5058 37.8937 18.7034 37.4848C17.9976 37.1252 17.4238 36.5513 17.0641 35.8455C16.6553 35.0431 16.6553 33.9927 16.6553 31.8918V21.3886Z' stroke='%235F6FFF' stroke-width='2.50076' stroke-linecap='round' stroke-linejoin='round'/%3E%3C/g%3E%3Cpath d='M27.1519 22.8456C27.1519 22.2488 27.1519 21.9504 27.2766 21.7839C27.3853 21.6387 27.5516 21.5479 27.7325 21.5349C27.9401 21.5201 28.1911 21.6815 28.6931 22.0042L34.5956 25.7987C35.0312 26.0787 35.249 26.2187 35.3243 26.3968C35.39 26.5523 35.39 26.7279 35.3243 26.8834C35.249 27.0615 35.0312 27.2015 34.5956 27.4815L28.6931 31.276C28.1911 31.5988 27.9401 31.7601 27.7325 31.7453C27.5516 31.7324 27.3853 31.6415 27.2766 31.4964C27.1519 31.3298 27.1519 31.0314 27.1519 30.4346V22.8456Z' stroke='white' stroke-width='2.50076' stroke-linecap='round' stroke-linejoin='round'/%3E%3Ccircle cx='21.5908' cy='46.3831' r='2.36914' fill='white'/%3E%3Ccircle cx='38.9648' cy='46.3831' r='2.36914' fill='white'/%3E%3Ccircle cx='30.3062' cy='46.3831' r='2.36914' fill='white'/%3E%3Cdefs%3E%3CclipPath id='clip0_1146_27749'%3E%3Crect width='30.0091' height='30.0091' fill='white' transform='translate(15.2739 11.6358)'/%3E%3C/clipPath%3E%3C/defs%3E%3C/svg%3E)
' fill='%231A31FF'/%3E%3Cpath d='M33.0079 26.4509C33.4977 26.2876 33.7426 26.206 33.9055 26.2641C34.0472 26.3146 34.1587 26.4261 34.2092 26.5679C34.2673 26.7307 34.1857 26.9756 34.0224 27.4654L32.5311 31.9392C32.4846 32.0787 32.4614 32.1485 32.4218 32.2064C32.3867 32.2577 32.3424 32.302 32.2911 32.3371C32.2331 32.3767 32.1634 32.4 32.0239 32.4465L27.55 33.9378C27.0603 34.101 26.8154 34.1827 26.6525 34.1246C26.5108 34.074 26.3993 33.9625 26.3487 33.8208C26.2907 33.658 26.3723 33.4131 26.5356 32.9233L28.0268 28.4494C28.0733 28.3099 28.0966 28.2402 28.1362 28.1823C28.1713 28.131 28.2156 28.0866 28.2669 28.0516C28.3248 28.0119 28.3946 27.9887 28.5341 27.9422L33.0079 26.4509Z' fill='white' stroke='white' stroke-width='1.3534' stroke-linecap='round' stroke-linejoin='round'/%3E%3Cpath d='M30.2793 15.716C38.2752 15.7161 44.7568 22.1986 44.7568 30.1945C44.7567 38.1904 38.2752 44.6719 30.2793 44.6721C22.2833 44.6721 15.8009 38.1905 15.8008 30.1945C15.8008 22.1985 22.2833 15.716 30.2793 15.716ZM28.9629 19.6652V18.4211C26.6783 18.6736 24.5908 19.5775 22.8867 20.9406L23.7646 21.8185C24.2783 22.3326 24.2785 23.166 23.7646 23.6799C23.2508 24.1937 22.4174 24.1935 21.9033 23.6799L21.0254 22.8019C19.6623 24.5061 18.7584 26.5935 18.5059 28.8781H19.75C20.4767 28.8783 21.0654 29.4678 21.0654 30.1945C21.0653 30.9212 20.4766 31.5107 19.75 31.5109H18.5059C18.7585 33.7952 19.6625 35.8822 21.0254 37.5861L21.9033 36.7092C22.4173 36.1953 23.2507 36.1952 23.7646 36.7092C24.2784 37.2231 24.2784 38.0565 23.7646 38.5705L22.8867 39.4474C24.5908 40.8107 26.6782 41.7134 28.9629 41.966V40.7238C28.9629 39.9969 29.5524 39.4074 30.2793 39.4074C31.0061 39.4075 31.5957 39.997 31.5957 40.7238V41.966C33.8801 41.7134 35.9669 40.8104 37.6709 39.4474L36.7939 38.5705C36.2799 38.0565 36.2799 37.2232 36.7939 36.7092C37.3079 36.1952 38.1413 36.1952 38.6553 36.7092L39.5322 37.5861C40.8952 35.8821 41.7991 33.7953 42.0518 31.5109H40.8086C40.0818 31.5109 39.4923 30.9213 39.4922 30.1945C39.4922 29.4676 40.0817 28.8781 40.8086 28.8781H42.0518C41.7992 26.5934 40.8955 24.5061 39.5322 22.8019L38.6553 23.6799C38.1413 24.1936 37.3079 24.1936 36.7939 23.6799C36.28 23.1659 36.2801 22.3326 36.7939 21.8185L37.6709 20.9406C35.9669 19.5777 33.88 18.6737 31.5957 18.4211V19.6652C31.5955 20.3919 31.006 20.9805 30.2793 20.9807C29.5525 20.9807 28.9631 20.3919 28.9629 19.6652Z' fill='%235F6FFF'/%3E%3C/svg%3E)

' fill='%231A31FF'/%3E%3Cpath d='M39.5734 29.6799V21.1819C39.5734 20.0446 39.5724 19.2711 39.5236 18.6735C39.4761 18.0913 39.3896 17.7934 39.2837 17.5857C39.0291 17.0859 38.6227 16.6795 38.123 16.4249C37.9153 16.3191 37.6171 16.2325 37.0351 16.185C36.4375 16.1362 35.6639 16.1352 34.5267 16.1352H26.0287C24.8914 16.1352 24.118 16.1362 23.5203 16.185C22.9382 16.2325 22.6402 16.3191 22.4325 16.4249C21.9328 16.6795 21.5264 17.0859 21.2717 17.5857C21.1659 17.7933 21.0794 18.0914 21.0318 18.6735C20.983 19.2711 20.9821 20.0446 20.9821 21.1819V29.6799C20.9821 30.4133 20.3878 31.0087 19.6544 31.0087C18.921 31.0087 18.3267 30.4133 18.3267 29.6799V21.1819C18.3267 20.0882 18.3255 19.1877 18.3853 18.4568C18.4462 17.7104 18.5765 17.024 18.9048 16.3796C19.4141 15.3801 20.2269 14.5672 21.2264 14.058C21.8709 13.7296 22.5573 13.5994 23.3036 13.5384C24.0346 13.4787 24.9351 13.4798 26.0287 13.4798H34.5267C35.6203 13.4798 36.5209 13.4787 37.2518 13.5384C37.9982 13.5994 38.6846 13.7297 39.3291 14.058C40.3285 14.5672 41.1414 15.3801 41.6506 16.3796C41.979 17.024 42.1092 17.7104 42.1702 18.4568C42.2299 19.1877 42.2288 20.0882 42.2288 21.1819V29.6799C42.2288 30.4133 41.6345 31.0087 40.9011 31.0087C40.1678 31.0086 39.5734 30.4132 39.5734 29.6799ZM32.9337 25.4314C33.6671 25.4314 34.2614 26.0257 34.2614 26.7591C34.2613 27.4925 33.667 28.0869 32.9337 28.0869H24.9663C24.233 28.0869 23.6387 27.4925 23.6386 26.7591C23.6386 26.0257 24.2329 25.4314 24.9663 25.4314H32.9337ZM35.5891 20.1195C36.3225 20.1195 36.9179 20.7138 36.918 21.4472C36.918 22.1806 36.3225 22.7749 35.5891 22.7749H24.9663C24.2329 22.7749 23.6386 22.1806 23.6386 21.4472C23.6386 20.7138 24.2329 20.1195 24.9663 20.1195H35.5891Z' fill='white'/%3E%3Cpath d='M42.2296 30.6789C42.0173 30.8239 41.7844 30.9761 41.5408 31.1344L35.9381 34.7748L42.2229 40.4516C42.2275 40.072 42.2296 39.6365 42.2296 39.1283V30.6789ZM33.3181 36.4784C32.565 36.9679 31.9193 37.41 31.1878 37.5817C30.5894 37.7221 29.9665 37.7221 29.3681 37.5817C28.6366 37.41 27.9919 36.9679 27.2389 36.4784L26.9205 36.2717L19.0725 43.3624C19.2758 43.5729 19.5128 43.7508 19.7767 43.8853C19.9844 43.9911 20.2826 44.0765 20.8646 44.1241C21.4622 44.1729 22.2356 44.1749 23.373 44.1749H37.1829C38.3202 44.1749 39.0937 44.1729 39.6913 44.1241C40.2733 44.0765 40.5715 43.991 40.7791 43.8853C41.0428 43.7509 41.2792 43.5726 41.4822 43.3624L33.6343 36.2717L33.3181 36.4784ZM18.3319 40.4516L24.6178 34.7748L19.0151 31.1344C18.7715 30.9761 18.5386 30.8239 18.3263 30.6789V39.1283C18.3263 39.6365 18.3273 40.072 18.3319 40.4516ZM44.885 39.1283C44.885 40.2219 44.8861 41.1224 44.8264 41.8534C44.7654 42.5994 44.6349 43.2853 44.3068 43.9295C43.7976 44.9289 42.9846 45.7418 41.9853 46.2511C41.3408 46.5794 40.6544 46.7108 39.908 46.7718C39.1771 46.8315 38.2766 46.8303 37.1829 46.8303H23.373C22.2793 46.8303 21.3788 46.8315 20.6479 46.7718C19.9015 46.7108 19.2151 46.5794 18.5706 46.2511C17.5713 45.7418 16.7583 44.9289 16.2491 43.9295C15.921 43.2853 15.7905 42.5994 15.7295 41.8534C15.6698 41.1224 15.6709 40.2219 15.6709 39.1283V29.1201C15.6732 28.8316 15.6898 28.4992 15.7881 28.1794C15.8919 27.8417 16.0623 27.5274 16.2889 27.2563C16.575 26.9141 16.9591 26.6817 17.2418 26.4979L17.3679 26.4249L18.3263 25.941V27.2563C21.6804 29.7399 25.1831 31.9749 28.686 34.2519C29.6093 34.8521 29.8034 34.9556 29.975 34.9959C30.1745 35.0426 30.3825 35.0427 30.582 34.9959C30.7535 34.9555 30.9475 34.8514 31.8699 34.2519L40.0926 28.9068C41.3686 28.0774 42.2296 27.5983 42.2296 27.5983V25.9407L43.1891 26.4249L43.3141 26.4979C43.5968 26.6817 43.9809 26.9141 44.267 27.2563C44.437 27.4596 44.576 27.6872 44.6783 27.9306L44.7678 28.1794L44.8109 28.3397C44.8718 28.6085 44.8831 28.8796 44.885 29.1201V39.1283Z' fill='%235F6FFF'/%3E%3C/svg%3E%0A)


' fill='%231A31FF'/%3E%3Cpath d='M148 32.5C149.657 32.5 151 33.8431 151 35.5V38.5H160C163.314 38.5 166 41.1863 166 44.5V104.5C166 107.814 163.314 110.5 160 110.5H100C96.6863 110.5 94 107.814 94 104.5V44.5C94 41.1863 96.6863 38.5 100 38.5H109V35.5C109 33.8431 110.343 32.5 112 32.5C113.657 32.5 115 33.8431 115 35.5V38.5H145V35.5C145 33.8431 146.343 32.5 148 32.5ZM100 62.5V104.5H160V62.5H100ZM100 56.5H160V44.5H151V47.5C151 49.1569 149.657 50.5 148 50.5C146.343 50.5 145 49.1569 145 47.5V44.5H115V47.5C115 49.1569 113.657 50.5 112 50.5C110.343 50.5 109 49.1569 109 47.5V44.5H100V56.5Z' fill='%235F6FFF'/%3E%3Cg clip-path='url(%23clip0_1146_28342)'%3E%3Cpath d='M130 80.5C132.485 80.5 134.5 78.4853 134.5 76C134.5 73.5147 132.485 71.5 130 71.5C127.515 71.5 125.5 73.5147 125.5 76C125.5 78.4853 127.515 80.5 130 80.5Z' fill='%235F6FFF'/%3E%3Cpath d='M146.5 80.5C148.985 80.5 151 78.4853 151 76C151 73.5147 148.985 71.5 146.5 71.5C144.015 71.5 142 73.5147 142 76C142 78.4853 144.015 80.5 146.5 80.5Z' fill='white'/%3E%3Cpath d='M113.5 95.5C115.985 95.5 118 93.4853 118 91C118 88.5147 115.985 86.5 113.5 86.5C111.015 86.5 109 88.5147 109 91C109 93.4853 111.015 95.5 113.5 95.5Z' fill='%235F6FFF'/%3E%3Cpath d='M130 95.5C132.485 95.5 134.5 93.4853 134.5 91C134.5 88.5147 132.485 86.5 130 86.5C127.515 86.5 125.5 88.5147 125.5 91C125.5 93.4853 127.515 95.5 130 95.5Z' fill='%235F6FFF'/%3E%3Cpath d='M146.5 95.5C148.985 95.5 151 93.4853 151 91C151 88.5147 148.985 86.5 146.5 86.5C144.015 86.5 142 88.5147 142 91C142 93.4853 144.015 95.5 146.5 95.5Z' fill='%235F6FFF'/%3E%3C/g%3E%3Cdefs%3E%3CclipPath id='clip0_1146_28342'%3E%3Crect width='96' height='96' fill='white' transform='translate(82 26.5)'/%3E%3C/clipPath%3E%3C/defs%3E%3C/svg%3E)
' fill='%231A31FF'/%3E%3Cpath d='M120.215 63.2149L108.43 51.4298M108.43 98.5703L120.215 86.7851M143.785 86.7851L155.57 98.5701M155.57 51.4297L143.785 63.2148' stroke='white' stroke-width='6.66667' stroke-linejoin='round'/%3E%3Cpath d='M132 108.333C150.409 108.333 165.333 93.4095 165.333 75C165.333 56.5905 150.409 41.6666 132 41.6666C113.59 41.6666 98.6665 56.5905 98.6665 75C98.6665 93.4095 113.59 108.333 132 108.333Z' stroke='%235F6FFF' stroke-width='6.66667' stroke-linecap='round' stroke-linejoin='round'/%3E%3Cpath d='M132 91.6666C141.205 91.6666 148.667 84.2047 148.667 75C148.667 65.7952 141.205 58.3333 132 58.3333C122.795 58.3333 115.333 65.7952 115.333 75C115.333 84.2047 122.795 91.6666 132 91.6666Z' stroke='%235F6FFF' stroke-width='6.66667' stroke-linecap='round' stroke-linejoin='round'/%3E%3C/svg%3E)
' fill='%231A31FF'/%3E%3Cpath d='M123.333 85L113.082 95.3789C111.652 96.8267 110.938 97.5505 110.323 97.6016C109.79 97.6459 109.268 97.4316 108.92 97.0254C108.518 96.5573 108.518 95.5399 108.518 93.5051V88.3053C108.518 86.4798 107.023 85.1589 105.217 84.8944C100.846 84.254 97.4124 80.8208 96.7721 76.4493C96.6665 75.7285 96.6665 74.8683 96.6665 73.1481V57.6666C96.6665 52.0661 96.6665 49.2658 97.7564 47.1267C98.7152 45.2451 100.245 43.7153 102.127 42.7566C104.266 41.6666 107.066 41.6666 112.667 41.6666H137.333C142.934 41.6666 145.734 41.6666 147.873 42.7566C149.755 43.7153 151.284 45.2451 152.243 47.1267C153.333 49.2658 153.333 52.0661 153.333 57.6666V71.6666M153.333 108.333L146.078 103.29C145.059 102.581 144.549 102.226 143.994 101.975C143.501 101.752 142.983 101.589 142.452 101.491C141.853 101.381 141.232 101.381 139.99 101.381H134C130.266 101.381 128.399 101.381 126.973 100.654C125.719 100.015 124.699 98.9953 124.06 97.7408C123.333 96.3148 123.333 94.4479 123.333 90.7142V82.3333C123.333 78.5996 123.333 76.7328 124.06 75.3067C124.699 74.0523 125.719 73.0324 126.973 72.3932C128.399 71.6666 130.266 71.6666 134 71.6666H152.667C156.4 71.6666 158.267 71.6666 159.693 72.3932C160.948 73.0324 161.967 74.0523 162.607 75.3067C163.333 76.7328 163.333 78.5996 163.333 82.3333V91.3809C163.333 94.4872 163.333 96.0403 162.826 97.2655C162.149 98.899 160.851 100.197 159.218 100.873C157.993 101.381 156.439 101.381 153.333 101.381V108.333Z' stroke='%235F6FFF' stroke-width='6.66667' stroke-linecap='round' stroke-linejoin='round'/%3E%3Cpath d='M163.333 82.3333C163.333 78.5996 163.333 76.7328 162.607 75.3067C161.968 74.0523 160.948 73.0324 159.693 72.3932C158.267 71.6666 156.401 71.6666 152.667 71.6666H134C130.266 71.6666 128.4 71.6666 126.974 72.3932C125.719 73.0324 124.699 74.0523 124.06 75.3067C123.333 76.7328 123.333 78.5996 123.333 82.3333V90.7142C123.333 94.4479 123.333 96.3148 124.06 97.7408C124.699 98.9953 125.719 100.015 126.974 100.654C128.4 101.381 130.266 101.381 134 101.381H139.99C141.232 101.381 141.853 101.381 142.452 101.491C142.984 101.589 143.502 101.752 143.994 101.975C144.549 102.226 145.059 102.581 146.079 103.29L153.333 108.333V101.381C156.44 101.381 157.993 101.381 159.218 100.873C160.852 100.197 162.149 98.899 162.826 97.2655C163.333 96.0403 163.333 94.4872 163.333 91.3809V82.3333Z' stroke='white' stroke-width='6.66667' stroke-linecap='round' stroke-linejoin='round'/%3E%3C/svg%3E)
' fill='%231A31FF'/%3E%3Cpath d='M149.167 84.5834V73.062C149.167 72.374 149.167 72.03 149.062 71.7263C148.969 71.4577 148.818 71.2131 148.619 71.0101C148.394 70.7806 148.087 70.6268 147.471 70.3191L130 61.5834M99.3332 65.4167V91.5087C99.3332 92.9344 99.3332 93.6472 99.5556 94.2714C99.7522 94.8231 100.073 95.3225 100.492 95.7311C100.967 96.1933 101.615 96.4903 102.911 97.0843L127.444 108.329C128.384 108.76 128.854 108.975 129.344 109.06C129.778 109.135 130.222 109.135 130.656 109.06C131.145 108.975 131.615 108.76 132.555 108.329L157.089 97.0843C158.385 96.4903 159.033 96.1933 159.507 95.7311C159.927 95.3225 160.247 94.8231 160.444 94.2714C160.667 93.6472 160.667 92.9344 160.667 91.5087V65.4167M91.6665 61.5834L128.628 43.1024C129.131 42.851 129.383 42.7253 129.646 42.6758C129.88 42.632 130.12 42.632 130.353 42.6758C130.617 42.7253 130.868 42.851 131.371 43.1024L168.333 61.5834L131.371 80.0643C130.868 80.3157 130.617 80.4415 130.353 80.4909C130.12 80.5348 129.88 80.5348 129.646 80.4909C129.383 80.4415 129.131 80.3157 128.628 80.0643L91.6665 61.5834Z' stroke='%235F6FFF' stroke-width='7.66667' stroke-linecap='round' stroke-linejoin='round'/%3E%3Cpath d='M149.167 84.5834V73.062C149.167 72.374 149.167 72.03 149.062 71.7263C148.969 71.4577 148.818 71.2131 148.619 71.0101C148.395 70.7806 148.087 70.6268 147.471 70.3191L130 61.5834' stroke='white' stroke-width='7.66667' stroke-linecap='round' stroke-linejoin='round'/%3E%3C/svg%3E)


'%3E%3Cpath d='M3.98722 14.5788C4.44347 13.5039 5.50869 12.75 6.75 12.75H11.25C12.4913 12.75 13.5565 13.5039 14.0128 14.5788M12 7.125C12 8.78185 10.6569 10.125 9 10.125C7.34315 10.125 6 8.78185 6 7.125C6 5.46815 7.34315 4.125 9 4.125C10.6569 4.125 12 5.46815 12 7.125ZM16.5 9C16.5 13.1421 13.1421 16.5 9 16.5C4.85786 16.5 1.5 13.1421 1.5 9C1.5 4.85786 4.85786 1.5 9 1.5C13.1421 1.5 16.5 4.85786 16.5 9Z' stroke='%231A31FF' stroke-width='1.25' stroke-linecap='round' stroke-linejoin='round'/%3E%3C/g%3E%3Cdefs%3E%3CclipPath id='clip0_220_713'%3E%3Crect width='18' height='18' fill='white'/%3E%3C/clipPath%3E%3C/defs%3E%3C/svg%3E)



The quick download:
A smart alerting strategy protects both your systems and your team by turning raw signals into fast, credible action.
-
The 7-stage alerting lifecycle (Detect, Validate, Prioritize, Enrich, Route, Escalate, Review) gives you a structured place to cut noise at every step.
-
False positives erode trust: set thresholds against real behavior and require problems to persist before alerts fire.
-
Edwin AI deduplicates related events, correlates them into incidents, prioritizes them using available context, and can route them automatically based on configured ownership and impact.
-
Track actionable-alert rate, MTTD, and MTTR to prove your strategy works and improve it over time.
A monitoring and alerting strategy decides how quickly your team learns about a problem and how confidently it responds. Done well, it turns raw signals into fast, credible action.
Poor alerting carries real cost. Missed or buried alerts extend downtime and degrade the customer experience. They also wear down responders who chase false alarms night after night.
Teams often overcorrect. They add tests, wire up more notifications, and tighten thresholds past the point of usefulness. The result is noise that buries the few alerts that matter.
Faster detection shortens the time before investigation begins and can help reduce mean time to resolve (MTTR), though it doesn’t guarantee a faster fix.
This guide builds a monitoring and alerting strategy that shortens mean time to detect (MTTD) without drowning your team in false positives.
What is a monitoring and alerting strategy?
A monitoring and alerting strategy is the set of rules behind your alerts. It decides which signals fire, how each alert is validated, who gets notified, and how each notification is handled. Together, those rules turn telemetry into action that responders can trust.
The strategy covers more than thresholds. It defines the signals you collect and the conditions that fire a page. It also sets the priority you assign, the context you attach, and the routing that gets an incident to the right owner.
For example, a checkout service might page on-call only after four consecutive failed checks across three regions. The same rule routes the page to the payments team in PagerDuty and attaches the last deployment plus a runbook link. That one rule reflects every part of the strategy at once.
What stages make up the alerting lifecycle?
A durable monitoring and alerting strategy follows a repeatable lifecycle of seven stages. Each stage builds on the one before it, and each gives you a place to cut noise.
- Detect: catch real issues with trustworthy signals.
- Validate: confirm a problem before paging anyone.
- Prioritize: rank alerts by business impact.
- Enrich: attach the context responders need.
- Route: send each incident to the team that owns it.
- Escalate: keep response moving when a responder is unavailable.
- Review: measure results and refine the strategy.
How do you detect issues with trustworthy signals?
To detect issues with trustworthy signals, get the underlying telemetry right before you tune any alert. You can’t respond to a problem you haven’t seen, and a weak signal produces a weak alert.
Modern teams work with more than synthetic tests. Metrics, logs, events, and traces all feed the same queue. Each signal and test should yield a result someone can act on.
Google’s Site Reliability Engineering guidance makes the same point: a page should be urgent, actionable, and user-visible. A signal that can’t change what someone does should stay in a dashboard instead of triggering a page.
What makes a sound test methodology?
A sound test methodology reflects how users actually reach your services. Three practical choices carry most of the weight.
- Test type: match it to what you measure, such as availability, response time, or a full transaction path.
- Locations: test from where your users are, not from a single vantage point.
- Frequency: run tests often enough to catch issues without generating redundant data.
Outside-in visibility helps here. LogicMonitor Digital Experience tests from a global agent network, so you see performance the way users experience it across the Internet path.
Pair that with the infrastructure, cloud, and log telemetry in LM Envision. Together they show whether a slowdown starts in your systems, in transit, or at the user’s edge.
How do you prevent false positives?
You prevent false positives with two design choices: evaluate the right metrics within reasonable thresholds, and require a problem to persist before an alert fires. False positives erode trust, and responders soon start to ignore an alert that turns out to be nothing.
Set thresholds against real behavior. A threshold set too tight fires on normal variance, and one set too loose misses the incident. Anchor the value to how the metric moves on a healthy day.
Tune persistence so an alert fires only after a problem holds. A common pattern requires several consecutive failed data points within a set window. Four failed checks in a row is one example, and the right number depends on your service.
Appropriate values depend on service criticality, test frequency, geographic coverage, and your error budget. AI can’t compensate for an invalid threshold, so the design work still falls to you.
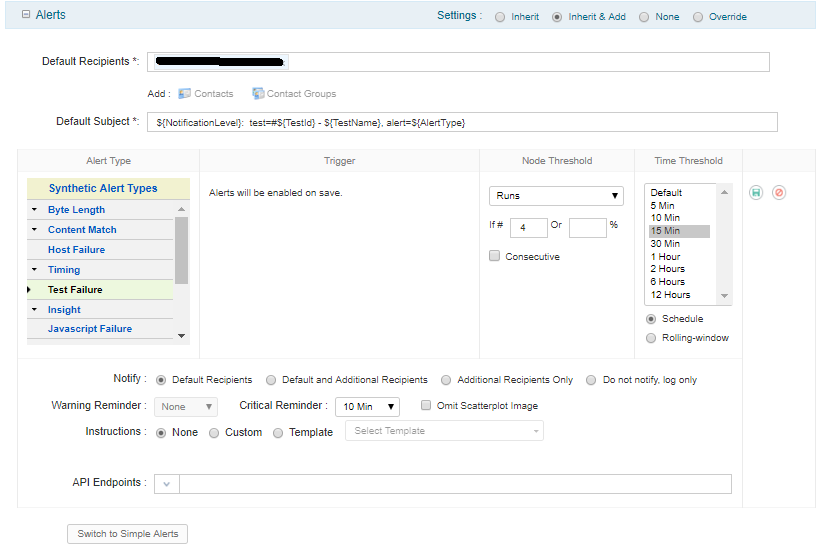
You can also tie thresholds to user-facing reliability targets. Google’s SRE workbook describes alerting on service level objectives, which keeps alerts anchored to real user impact rather than raw metric movement.
How should you prioritize alerts by business impact?
You prioritize alerts by business impact by assigning each one a severity level. The level reflects reach, duration, service criticality, transaction impact, and whether redundancy is already exhausted. A priority scheme tells responders whether to drop everything or queue the item.
The number of failed monitoring locations is only one input. For a globally used service, a team might require failures from several independent locations before assigning critical severity. Failures across locations suggest broader impact, though they don’t automatically prove an issue is critical.
A severity scale gives responders a shared vocabulary. The table below shows one workable scheme with an example trigger and response for each level.
| Severity | Example trigger | Response |
| Critical | Checkout fails from three independent locations for 5 minutes | Page on-call now and open an incident |
| High | Login latency doubles in one region | Page during business hours, investigate within 30 minutes |
| Medium | A non-critical test fails intermittently | Queue for the next business day |
| Low | Informational threshold crossed with no user impact | Log for trend review, no page |
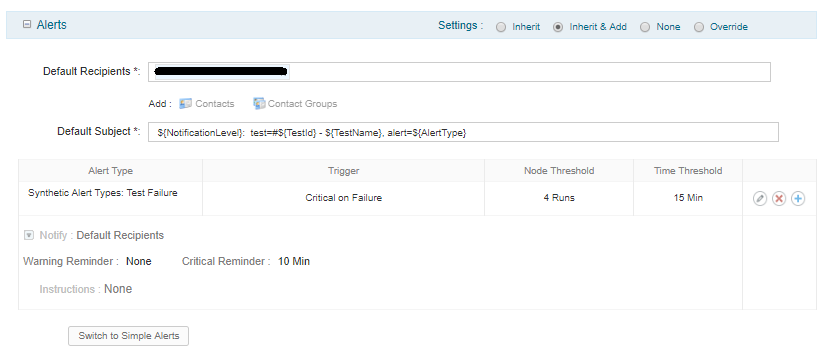
Combining outside-in and inside-out data sharpens these calls. When an Internet-layer alert lines up with infrastructure telemetry on the same service, you can prioritize by real impact. That beats prioritizing by whichever tool fired first.
What should an alert notification include?
An alert notification should include enough context for a responder to act without hunting for it. A useful alert answers what broke, where, how badly, and what to do next.
Include the following in each notification:
- Affected service and business impact.
- Severity and current scope.
- Service owner and escalation path.
- Runbook or dashboard link.
- Related alerts and known dependencies.
- Recent changes or deployments.
- Time, duration, and affected locations.
- Failed data point details.
- Diagnostic evidence, such as traceroute results.
For example, a payments-service page might name the owning team, link the deployment from 10 minutes earlier, and show failures in three regions. That context lets a responder start work in seconds rather than minutes.
How do you route alerts to the right team?
You route alerts to the right team by correlating related events into a single incident. From there, deliver each incident through channels the team already watches, and give every page a defined owner. Set a clear hierarchy for who receives which notifications.
Correlate related alerts into incidents
To correlate related alerts, group the many events a single incident triggers into one record. Edwin AI deduplicates related events, correlates them into incidents, prioritizes them using available context, and can route them automatically based on configured ownership and impact
That consolidation cuts the noise of overlapping pages. LogicMonitor’s platform processes more than two trillion metrics each day, so grouping related signals keeps responders focused on one incident rather than a dozen alerts.
Use appropriate delivery channels
Use the channels your teams already monitor, so alerts land where people are working. LogicMonitor’s notification integrations connect to the on-call and incident-management platforms teams rely on:
- Slack: coordinate in team chat and threads.
- PagerDuty: schedule on-call rotations and page responders.
- Custom HTTP delivery: send alerts to your own endpoints.
- Jira Service Management and similar platforms: manage incidents end to end.
Page someone when needed
Page someone only when the alert has a defined owner and a response action. Each page should map to an owner, a runbook, an escalation path, or a vendor-response action.
Some failures fall outside your control. For DNS, CDN, cloud, SaaS, or ISP problems, your team may not own the fix. It can still invoke vendor escalation, failover, traffic shifting, or customer communications.
When should alerts escalate?
Alerts should escalate when the first responder doesn’t acknowledge within a set window, so incidents keep moving. Back your routing with an escalation policy that names who gets the alert next and how quickly.
Match escalation speed to severity. Reserve aggressive escalation for high-priority incidents, and let lower-severity alerts wait in a queue without waking anyone.
How do you measure whether your alerting strategy works?
You measure whether your alerting strategy works by tracking a small set of metrics through regular review. Concrete numbers show whether tuning improves operations or merely reduces volume.
| Metric | What it tells you | Healthy direction |
| Actionable-alert rate | How many alerts lead to real action | Higher |
| Duplicate-alert rate | How often one incident generates repeat pages | Lower |
| Alerts per incident | How tightly related signals are grouped | Lower |
| Acknowledgment time | How fast responders pick up alerts | Lower |
| Escalation rate | How often alerts pass the first responder | Lower |
| MTTD and MTTR | How fast you detect and resolve issues | Lower |
How should you handle recovery and closure?
Handle recovery and closure by deciding what happens when the condition clears and who owns the wrap-up. The lifecycle doesn’t end when an alert fires.
Control flapping so a metric hovering near a threshold doesn’t page repeatedly. Use hysteresis or a clear recovery window before an alert reopens.
Decide whether recovery notifications are sent and to whom. Assign who closes the incident, then review it afterward. A post-incident review turns each event into better thresholds, routing, and runbooks.
Bring Internet and infrastructure visibility together
A strong monitoring and alerting strategy protects both your systems and the people who run them. The lifecycle keeps noise down while shortening the time to detect.
LogicMonitor combines digital experience signals with infrastructure and cloud telemetry. Edwin AI then correlates and routes the resulting evidence.
See how unified Internet and infrastructure visibility transforms your alerting strategy.
LogicMonitor combines digital experience insights with infrastructure telemetry. Edwin AI correlates the signals and routes incidents to the right team, so your responders act faster with full context.
FAQs
What is the alerting lifecycle and why does it matter?
The alerting lifecycle is a seven-stage process: Detect, Validate, Prioritize, Enrich, Route, Escalate, and Review. Each stage builds on the previous one and gives teams a specific point to reduce noise. Following this lifecycle turns raw telemetry into trusted, actionable alerts that responders can act on confidently.
How can I reduce false positives in my alerting strategy?
Reduce false positives by setting thresholds against real metric behavior on a healthy day, and by requiring a problem to persist before an alert fires. A common pattern requires several consecutive failed data points (such as four in a row) before triggering a page. AI can help, but valid thresholds still require thoughtful design.
How does Edwin AI improve alert routing and incident response?
Edwin AI deduplicates related events, correlates them into a single incident, prioritizes by business impact, and routes the incident to the right team. This consolidation cuts overlapping pages, letting responders focus on one incident rather than chasing a flood of related alerts.