Citrix NetScaler
Forrester Total Economic Impact™ study finds Edwin AI delivered a 313% ROI for composite organization.
Proactively manage modern hybrid environments with predictive insights, intelligent automation, and full-stack observability.
Explore solutionsExplore our resource library for IT pros. Get expert guides, observability strategies, and real-world insights to power smarter, AI-driven operations.
Explore resources
Our observability platform proactively delivers the insights and automation CIOs need to accelerate innovation.
About LogicMonitor
LogicMonitor’s unique hosted monitoring makes Netscaler monitoring effortless. It will allow you to easily answer questions such as:
Intelligent alert thresholds will be set, alerting you to any issues in hardware, performance or configuration. All with no configuration on your part.
The CPU load of a Netscaler is an important metric to monitor, but LogicMonitor doesn’t stop there. It detects and monitors all the individual CPUs in a multi-processor system, tracks consistency point and interrupt activity, and lets you correlate whether the CPU load is impacting your request latency, or not.
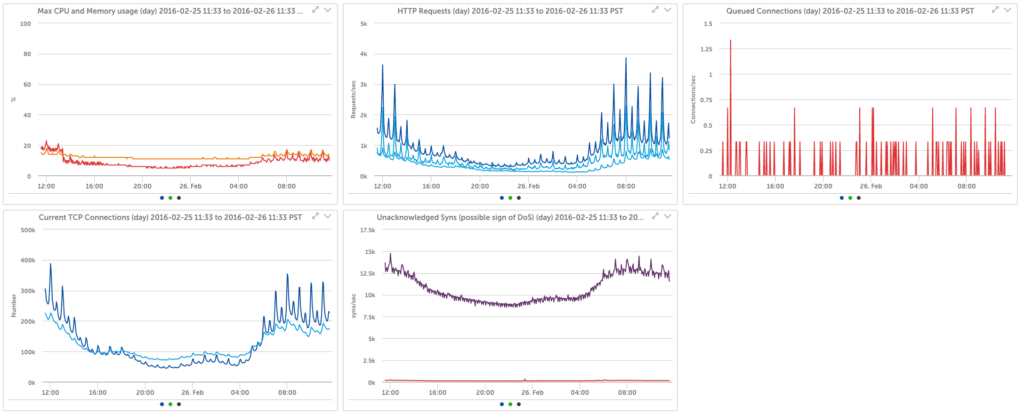
Automatically generated overview graphs of requests, connections, and throughput make it easy to isolate performance issues.
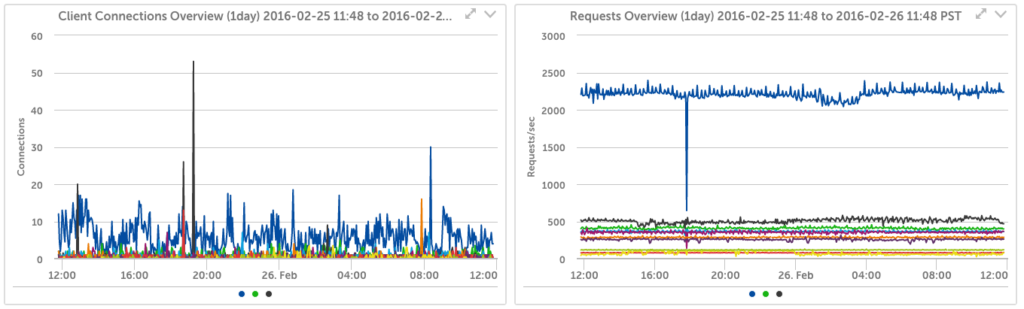
Dive into the details of every load balancing and content switching VIP – see traffic, requests, performance and connections for any period from 10 minutes to a year. Be alerted if backed servers are down. All automatically.
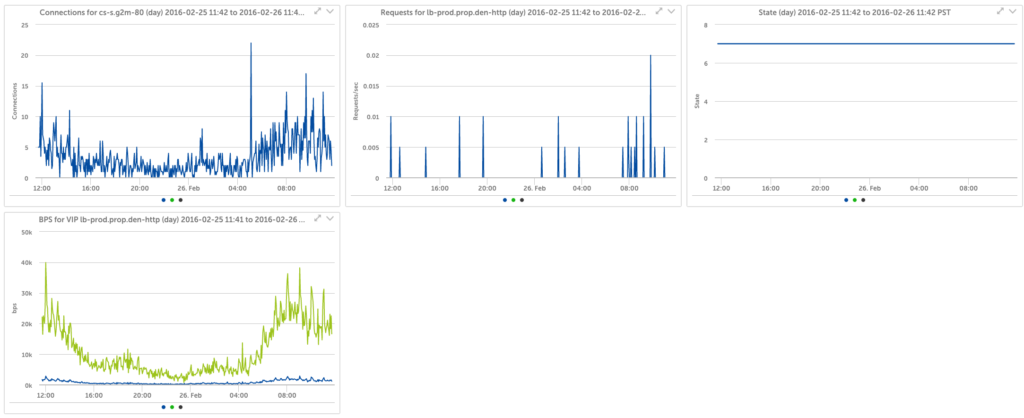
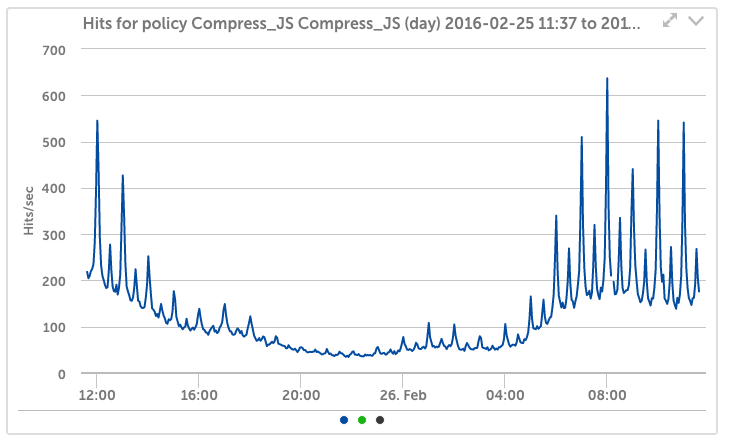
Turning on policies? Compression? Integrated Caching? LogicMonitor will detect it, monitor it, alert you to issues, and trend the performance metrics of the feature – all automatically.
And like all devices monitored by LogicMonitor, the configuration is automatically kept up to date. Eliminate the chance of your customers knowing about outages before you, because a VIP was not added to the monitoring system. Get monitoring that frees up time, and keeps up with your dynamic environment – LogicMonitor.
