Fill out the form to watch our retail demo

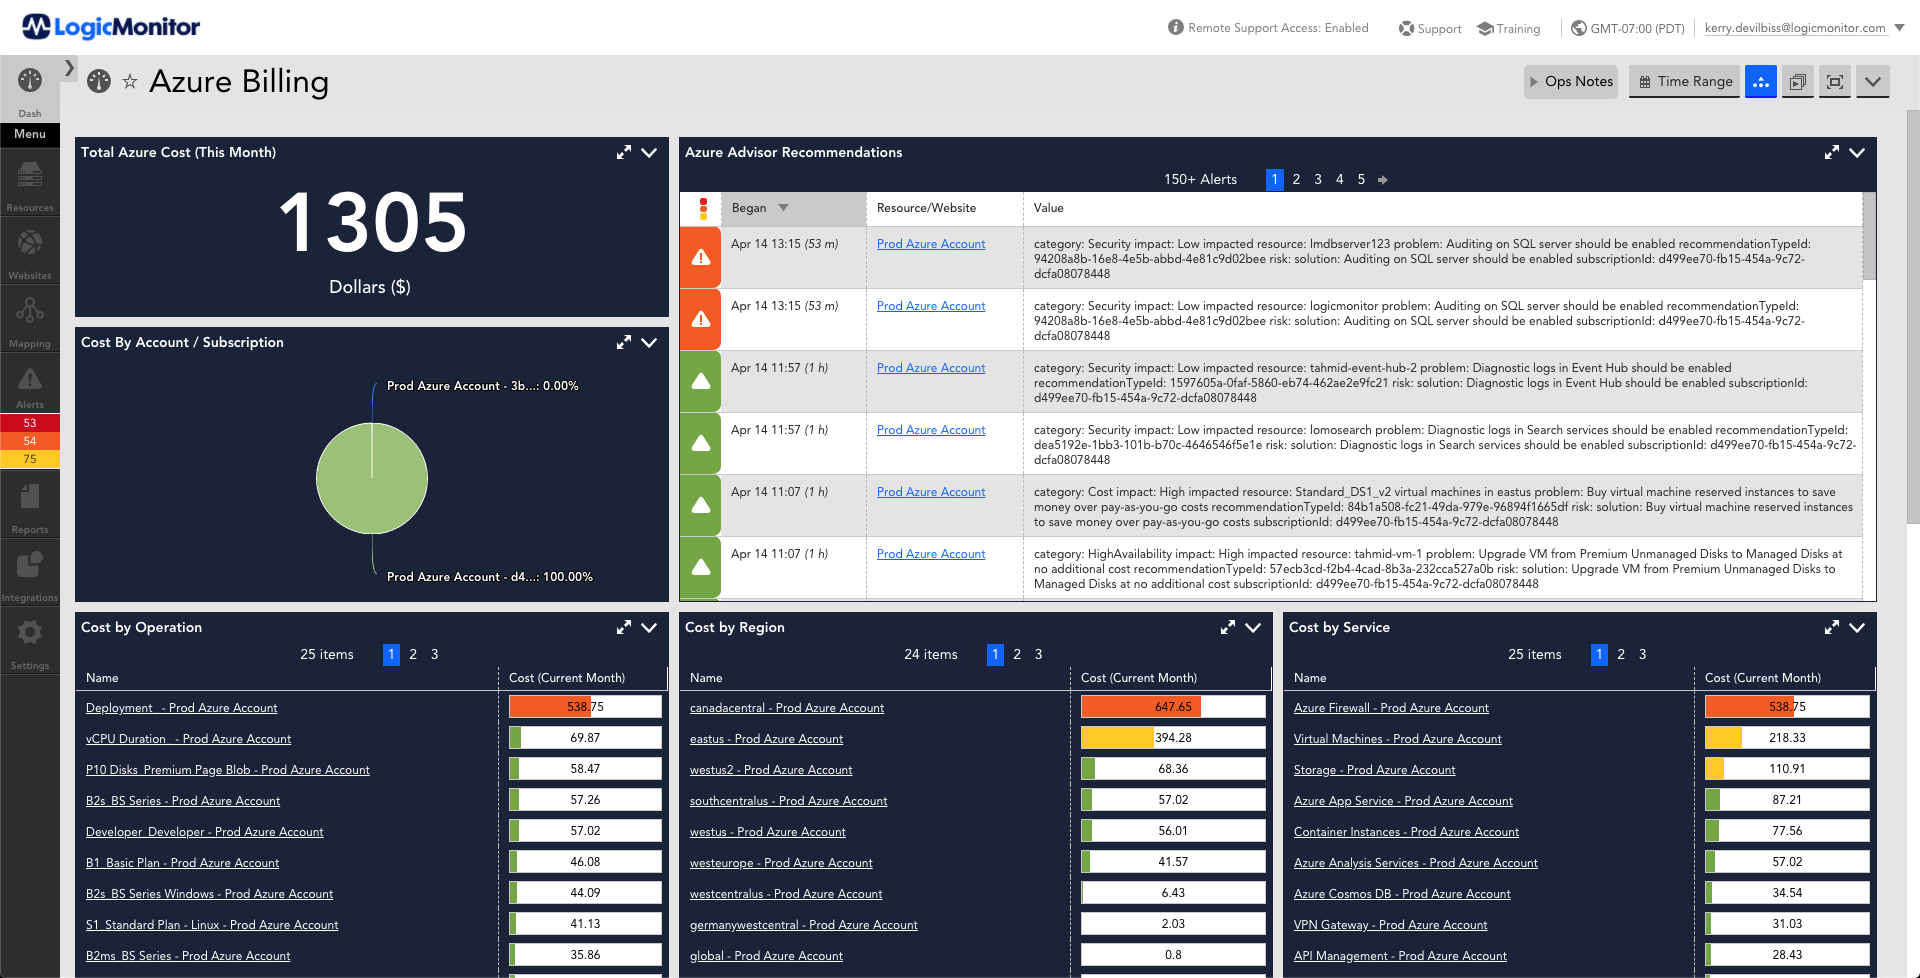
See LogicMonitor in action
Want to learn how to gain full visibility for AI-driven operations and inventory management to enhance user experience? Join us for a platform demo, where we’ll walk through our agentless, SaaS-based solution.
Topics covered include:
- View into flexible, platform architecture
- Sample retail multi-cloud compute environment
- Tying metrics, trace data, and log intelligence for full-fledged visibility
- Minimizing supply chain complexity
- Getting ahead of inventory management
A single pane of glass for IT and OT: from logistics to e-commerce
LogicMonitor marries visibility into traditional and cloud workloads with your IOT and production systems to allow you to troubleshoot and optimize your system as a whole.

Full visbility for a seamless customer experience in a mobile world
From stock control to revenue data, detail in one system allowing your business to be more agile and make informed, data-based decisions.
Minimize supply chain complexity
Optimize contact center staff efficiency for seasonal events and deliver increased team productivity and better customer care. LogicMonitor’s close integration with supply chain and ERP systems enables retail companies to confirm whether stores in different locations are hitting their revenue targets—and take action when they are not. Use LogicMonitor dashboards in your contact center to show call queues, including call country of origin and language, and the number of customer support tickets open.