What Is SNMP? Gain Real-Time Insights Into Network Performance (2026)
SNMP (Simple Network Management Protocol) is a standard way to monitor network devices like routers, servers, and UPS systems. This guide explains how SNMP works, its core components, version differences, security best practices, and how to use it effectively for monitoring at scale.
SNMP is the universal protocol for monitoring network infrastructure, but its real value depends on which version you run, how you secure it, and how well your monitoring tool handles the OID work for you.
Use SNMPv3 whenever your devices support it. v2c is acceptable on trusted internal networks, and v1 should only run on legacy equipment that can’t speak anything newer.
To secure every SNMP deployment, change the default community strings, limit SNMP access to specific monitoring servers, and make sure SNMP is never reachable from the public internet.
Use polling as your main source of data, and use traps as a backup signal. Polling runs on a schedule and builds trend history. Traps fire instantly when something changes, but a single lost packet means a missed alert.
Use a monitoring tool like LogicMonitor that automatically discovers the right OIDs, interprets SNMP data correctly, and turns raw device metrics into alerts and dashboards your team can act on.
SNMP (Simple Network Management Protocol) is the standard protocol IT teams use to monitor and manage network devices.
A central system (the manager) asks devices (agents) for data like CPU load, memory use, or interface traffic, and the devices reply with structured values pulled from a local database called the MIB.
It runs on UDP port 161 for queries and 162 for alerts, works on almost every router, switch, server, UPS, and storage array, and comes in three versions (v1, v2c, and v3). Only v3 offers proper encryption and authentication.
In this guide, we’ll walk through how SNMP works end-to-end, what the components do, which version to pick, how to configure and secure it, how to troubleshoot, and where it falls short.
What Is SNMP?
SNMP is a standard protocol that lets a monitoring system (SNMP manager) collect health and performance data from network devices using a shared message format. Devices running different operating systems (a Cisco switch, a Linux server, an APC UPS) all respond to SNMP queries using the same protocol, though the specific data exposed varies by device. One tool can watch the whole environment.
The name is misleading. SNMP isn’t always simple to use; it applies to much more than network gear, and in most real deployments, teams use it for monitoring rather than active management.
We use SNMP mainly to collect data about devices: CPU load, memory use, interface traffic, temperature, fan status, battery runtime on a UPS, and drive health on a storage array. Almost all network equipment supports it. So do most server operating systems, many storage devices, and some application software.
Why SNMP Matters
SNMP matters because it’s a low-cost, widely supported way to know whether your infrastructure is working before your users do.
Without it, someone has to watch dashboards, other monitoring tools, or wait for complaints. With it, one system can poll thousands of devices and alert on problems automatically.
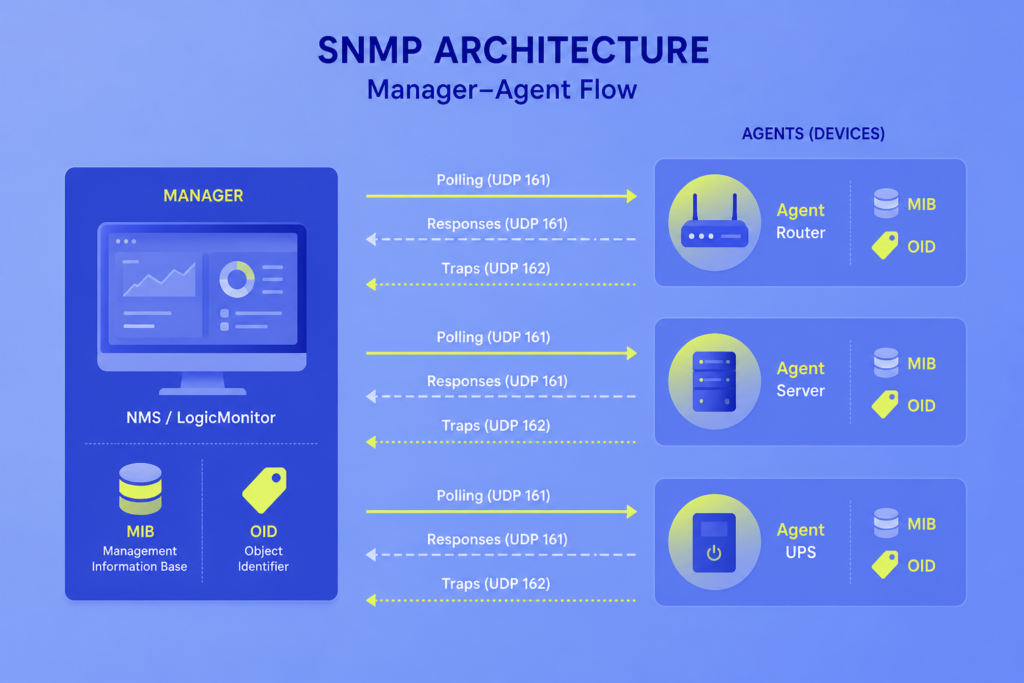
SNMP Components: Manager, Agent, MIB, and OID
SNMP has four core components:
The manager asks for data and receives alerts
The agent answers and can also send alerts
The MIB defines what data exists on each device
The OID is the unique address of a single data point inside the MIB
How These Components Fit Together
A manager queries an agent on UDP port 161 (by default). The agent looks up the requested OID in its local MIB and returns the value. The same agent can also push unsolicited alerts (traps) to the manager on UDP port 162 when a threshold is crossed or a state changes.
The Manager (Network Management Station)
The manager is whatever system sends SNMP queries and receives alerts (traps/informs). That can be a single Linux box running snmpwalk from the command line, a simple tool like What’s Up Gold, or a full platform like LogicMonitor, where our collectors issue the queries and our SaaS back end stores, analyzes, and alerts on the data.
Anything that initiates SNMP queries counts as a manager. A single device can run both a manager and an agent.
The Agent
The agent is the software on the monitored device that does two jobs: it answers queries from the manager, and it pushes alerts (traps or informs) when configured events occur.
On routers, switches, and firewalls, the agent is baked into the firmware. On general-purpose servers (Linux, Windows, Solaris, AIX, FreeBSD), you install one. On Linux, the standard choice is net-snmp, which runs as the snmpd daemon.
The MIB (Management Information Base)
The MIB is a structured database defined in plain-text files that describes, in a tree structure, every piece of data a device can report.
Standard MIBs cover the things every device should expose: interface counters, system name, and uptime. Vendor MIBs cover device-specific data, such as the remaining runtime on an APC UPS or the temperature of a specific Cisco line card.
A device advertises data by implementing the MIBs its vendor defines.
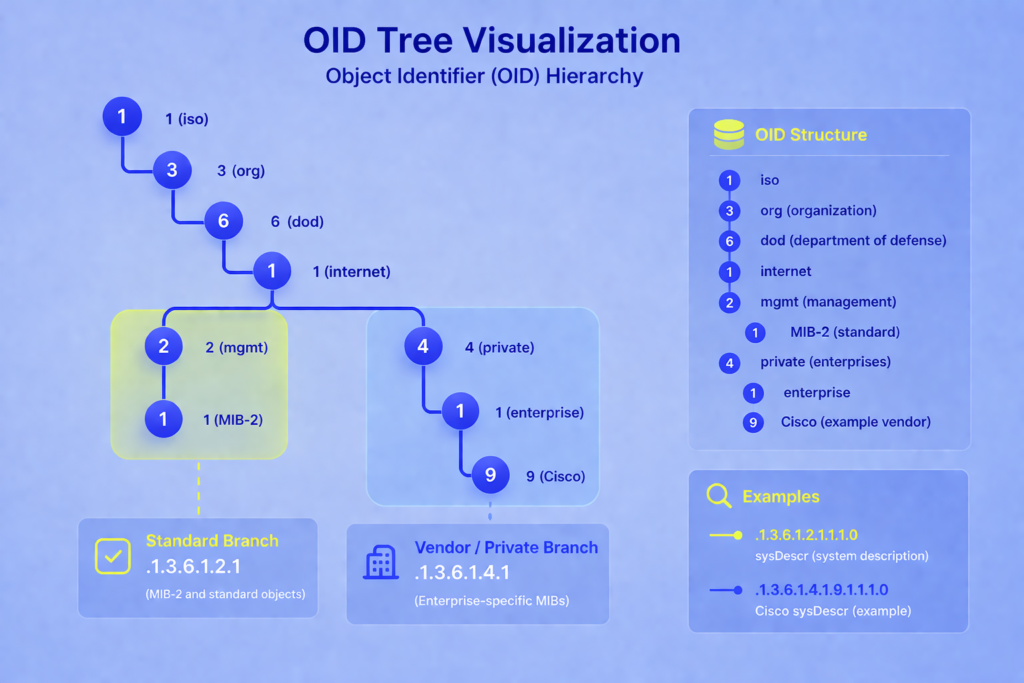
The OID (Object Identifier)
An OID is the numeric address of a managed object inside the MIB tree. Each number in the OID names a node, and the full dotted path identifies exactly one value the agent can return.
Take .1.3.6.1.2.1.1.1.0 as an example.
That always means sysDescr, a text description of the system. Most commonly, OIDs you’ll work with start with either .1.3.6.1.2.1 for standard MIB-2 objects or .1.3.6.1.4.1 for private vendor OIDs.
Cisco owns .1.3.6.1.4.1.9, so every Cisco-specific object hangs off that branch. IANA maintains the full registry of vendor prefixes at iana.org/assignments/enterprise-numbers.
Scalar vs Tabular OIDs
OIDs come in two shapes:
Scalar OIDs return a single value because there’s only one of those things. sysDescr is scalar because a device has one description.
Tabular OIDs return values from a table, where each OID represents a column and the index identifies the row.
Interfaces are tabular: a router has many interfaces, each with its own description, octet counter, and error count. Tabular OIDs end with an index that identifies the row, such as .1.3.6.1.2.1.2.2.1.10.3 for the in-octets counter on interface index 3.
Run the same query against a Cisco switch, and you’ll get the IOS version string instead of the Linux kernel string. Same OID, different agent, appropriate answer.
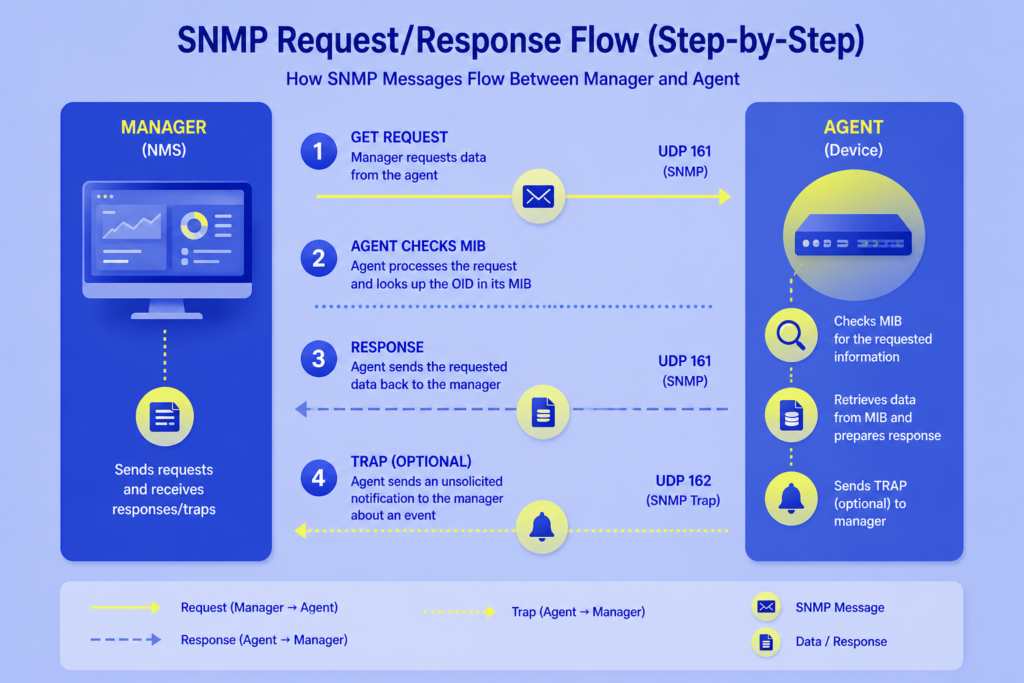
How SNMP Works: The End-To-End Flow
SNMP works in four steps:
The manager sends a request
The agent reads its MIB
The agent replies with the value
The agent pushes an unsolicited trap when something changes (optional)
Everything runs primarily over UDP.
Step-By-Step
1. Request: The manager sends a GET, GETNEXT, or GETBULK to the agent on UDP port 161, names the OID it wants, and supplies a community string (v1/v2c) or user credentials (v3).
2. Lookup: The agent checks credentials, then looks up the OID in the MIB objects it implements and retrieves the corresponding value from the device.
3. Response: The agent sends back a RESPONSE packet with the value, from UDP port 161 back to the manager. Gauges (like temperature) come back as-is. Counters (like octets in) come back as raw running totals, and the manager converts two samples into a rate.
4. Trap (optional): If you’ve configured the agent for it, a threshold crossing or state change makes the agent push a TRAP or INFORM to the manager on UDP 162, without waiting to be polled.
A monitoring platform repeats steps 1 through 3 every 30 to 300 seconds per device, stores the values, computes rates and ratios, and raises alerts when values cross thresholds.
Most platforms use traps as a secondary signal, not a primary one, for reasons we cover below.
SNMP Commands and PDU Types
SNMP defines seven message types, called PDUs. Five come from the manager to fetch or change data, and two come from the agent to report events.
Every SNMP exchange uses one of these.
Command
Direction
What it does
GET
Manager → Agent
Fetches the value of a specific OID. Multiple OIDs can be included in a single request.
GETNEXT
Manager → Agent
Fetches the next OID in the MIB tree. Walks a table without needing all the row indexes up front.
GETBULK
Manager → Agent
Fetches many OIDs in one request. v2c added this. Far more efficient when you walk large tables.
SET
Manager → Agent
Writes a value to an OID for configuration changes. Most production deployments disable SET for safety.
RESPONSE
Agent → Manager
Carries the reply to a GET, GETNEXT, GETBULK, or SET.
TRAP
Agent → Manager
Unsolicited alert the agent sends when a threshold or event fires. One-way, unacknowledged.
INFORM
Agent → Manager
Like a trap, but the manager acknowledges receipt. The agent retries if no ack arrives. Available in SNMPv2c and v3 (not v1).
SNMP Ports and Protocols
SNMP uses two UDP ports: 161 for polling and 162 for traps.
SNMP typically runs over UDP (ports 161 and 162), though it can also operate over TCP(which is rare) or TLS/DTLS in some implementations.
Port
Protocol
Used for
Direction
161
UDP
GET, GETNEXT, GETBULK, SET requests and their responses
Manager → Agent (and reply)
162
UDP
TRAP and INFORM messages
Agent → Manager
10161
TLS/DTLS
SNMP over TLS/DTLS (RFC 6353), queries
Manager → Agent (and reply)
10162
TLS/DTLS
SNMP over TLS/DTLS, notifications
Agent → Manager
Firewall and ACL Considerations
If SNMP polling stops working, we check the firewall first because SNMP runs on UDP, and silent packet drops can look identical to a down device or a broken agent. A firewall rule is usually the cheapest thing to rule out before you touch anything else.
Your manager’s source IP has to reach UDP 161 on the device, since that’s where SNMP agents listen for queries. Traps need the reverse rule: the device has to reach UDP 162 on the manager, because the agent is the one initiating that traffic, not the manager.
Here’s a short checklist for firewall issues:
Allow UDP 161 inbound on the device from the manager’s IP or subnet.
Allow UDP 162 inbound on the manager from every device that sends traps. That list is usually much larger than the polling ACL.
Remember that UDP is connectionless. A return packet has to match a firewall rule in its own right, especially on stateless firewalls, because state tracking for UDP is weaker than for TCP.
For encrypted transport, open UDP 10161 and 10162 instead. Most deployments don’t use TLS/DTLS and secure v3 with encryption at the protocol level instead.
SNMP Versions: v1, v2c, and v3
Three SNMP versions run in production. We recommend SNMPv3 if the device supports it, SNMPv2c as a fallback, and v1 only on legacy gear that accepts nothing else.
Here’s an overview of the three SNMP versions:
Feature
SNMPv1
SNMPv2c
SNMPv3
Released
1988
1996
2002
Counter size
32-bit only
32-bit and 64-bit
32-bit and 64-bit
GETBULK support
No
Yes
Yes
Authentication
Community string (plaintext)
Community string (plaintext)
Username + MD5 or SHA
Encryption
None
None
DES, 3DES, or AES
Recommended for
Legacy devices only
Internal networks behind ACLs
Anything touching untrusted networks
SNMPv1: The Original Version
It’s easy to configure, since it uses a plaintext community string as its only credential. The killer limit is 32-bit counters. A 1 Gbps interface can wrap a 32-bit octet counter in 34 seconds, so one-minute polls can’t tell you whether 10 octets went by or 4,294,967,306.
If you’re still running v1 anywhere, plan to replace it.
SNMPv2c
v2c is v1 with 64-bit counters and a few new message types like GETBULK. Security is still a plaintext community string, so it’s only acceptable on networks where you trust everyone who can reach the device.
Most hardware supports v2c, often enabled by default. A few older devices need it enabled explicitly. Enable it only if v3 is not available.
SNMPv3
v3 adds real security on top of the v2c feature set. It supports authentication (usually SHA), encryption (usually AES), or both.
Setup is more involved. Instead of one community string, you configure users, authentication protocols, encryption keys, and views. The trade-off is worth it on any network where someone untrusted could sniff traffic or spoof packets.
Which SNMP Version Should You Use?
We recommend SNMPv3 with authentication and encryption enabled as your default. Use v2c only inside a fully trusted network segment where ACLs restrict which hosts can query. Use v1 only when a device literally can’t speak anything newer, and replace that device when you can.
Polling vs Traps: When To Use Each
Polling is the manager asking questions on a schedule. Traps are the agent volunteering information when something happens.
We recommend you treat polling as your primary data source and traps as a secondary signal, not the other way around.
Aspect
Polling
Traps
How it works
Manager queries the agent on a schedule
The agent pushes a message when an event fires
Reliability
Failed polls get detected immediately based on the timeout and retry settings
Single UDP packet, no retry (except INFORM)
Testability
You test it every poll interval
Only gets tested when the actual event happens
Latency to detection
Up to one poll interval (30 to 300s)
Near-instant when it works
Load
Constant low load on the device and the network
Near-zero until an event fires
Trending data
Builds time-series history
No history, only the event (though platforms can store received traps)
Configuration effort
One ACL per subnet or per manager scope
Destination IP on every device
Best for
Metrics, thresholds, capacity planning
Rare state changes where history doesn’t matter
Why Traps Alone Are Risky
A trap is one UDP packet that the device sends at the exact moment something is going wrong. That’s the moment the packet is least likely to arrive.
Suppose a power supply just failed over, and an uplink is flapping. If that packet is lost, you get no notification, and you’ll never know a notification was supposed to happen.
Polling catches this. A failed poll is itself detectable, so your manager alerts you that a device stopped answering.
Why Traps Are Still Useful
For events that happen between polls and that matter quickly (a port going admin-down, a BGP neighbor resetting, a redundant power supply switching over), traps give you near-real-time notification.
Use them as an early warning on top of polling, not instead of it. Turn on INFORM messages where your devices support it, since INFORM requires acknowledgment and retry.
What Polling Gives You That Traps Don’t
Polling gives you context.
A trap can tell you the CPU crossed 80% if threshold-based alerts are configured on the device. But polling tells you whether CPU has been climbing for a week or spiked in the last five minutes.
That difference decides whether you wake someone up or schedule a fix for tomorrow. We see this pattern constantly in customer environments: the same threshold crossing means two different things depending on the trend line behind it.
SNMP Security Risks And Best Practices
SNMP is a common attack surface because it was designed in the late 1980s, when most networks were assumed to be trusted.
Three weaknesses show up over and over in SNMP:
v1 and v2c send credentials in plaintext, so anyone who can capture a single packet between the manager and the device can read the community string and reuse it.
Default community strings (“public” and “private”) are still live on millions of devices, because vendors ship them enabled, and admins forget to change them. This means attackers can often skip the credential-guessing step entirely.
Attackers abuse open SNMP responders to amplify DDoS traffic because a small GETBULK query can trigger a response up to 100x larger, turning your device into a weapon aimed at someone else.
To fix these, treat every SNMP deployment as something you need to harden, not something that’s safe by default.
Defensive Checklist
Apply these best practices across every device that speaks SNMP:
Never leave default community strings in place. Change “public” and “private” or remove them.
Use SNMPv3 with authPriv (authentication plus encryption) wherever the device supports it.
Restrict SNMP with ACLs to specific manager IPs, not broad subnets.
Put management traffic on a dedicated VLAN or management VRF, not the same segment as user traffic.
Turn SNMP off entirely on devices you don’t need to monitor.
Turn off SET unless you have a specific reason to enable it.
Block UDP 161 and 162 at the network edge. SNMP should never be reachable from the public internet.
Rotate SNMPv3 credentials on the same schedule as your other privileged credentials.
Audit which OIDs the device exposes. Most devices let you restrict views, so the agent only answers for the subset of the MIB your manager actually needs.
What “SNMP Support” Actually Means
“SNMP support” means a device can answer SNMP queries but not which queries, or how much useful data comes back. Coverage ranges from a version string to thousands of vendor-specific metrics, so the label alone won’t tell you if a device is worth monitoring.
Standard MIBs cover interface utilization, packets per second, CPU, memory, and TCP statistics.
That’s often enough for basic monitoring of a router or switch. It’s not enough for a UPS (where you need battery runtime, time on battery, and battery pack health) or a storage array (where you need drive health, free capacity, and per-LUN latency). Those metrics only exist in vendor-specific MIBs.
Having the vendor MIB doesn’t automatically help either.
APC’s MIB has over 4,500 objects, and most mean nothing in daily operations: one reports “the rectifier physical address on the bus.” Not every APC device implements every object, since devices only support subsets of the full MIB.
The metrics you actually care about are scattered across the tree, and finding them takes either careful vendor documentation reading or a monitoring tool that already knows which OIDs matter for each model.
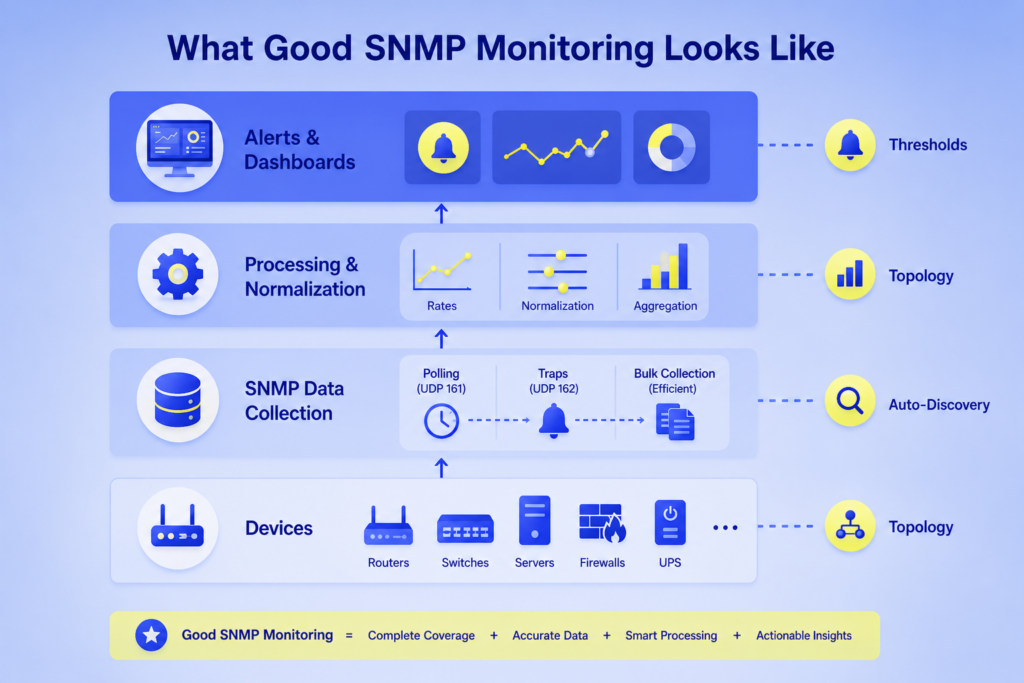
What “SNMP Support” Means in a Monitoring System
A monitoring system that speaks SNMP isn’t automatically good at monitoring SNMP devices. The real test is how much OID work the system does for you.
Three capabilities separate the two:
Automatic discovery: A good system identifies the device, chooses the right OIDs for that model, and re-checks when the configuration changes. Turn on PoE, and the PoE MIB becomes queryable without anyone editing a config.
Correct data interpretation: SNMP returns gauges, counters, strings, and bitmaps. Counters need conversion to rates by diffing samples and dividing by the interval, and 64-bit counters wrap far less frequently than 32-bit ones. The system should handle all of this invisibly.
Sensible default alert thresholds: Pre-defined alerts for what actually degrades production — interface errors, CPU saturation, disk fill, UPS on battery — should already exist. In addition, custom thresholds should be a small tweak, not a week of setup.
Beyond those three, useful extras include graphing, flexible alert routing, device auto-discovery, Layer-2 and Layer-3 topology maps, and support for other protocols (WMI, JMX, vendor APIs) where SNMP falls short.
A system that consolidates SNMP with those other sources is far more useful than one that only speaks SNMP, which is the principle we built our own platform on.
Install SNMP on Linux
To install SNMP on Linux, follow these four steps:
Install the package
Configure the agent
Start the service
Verify it’s responding
On Red Hat or CentOS, the whole process takes about a minute on a single host. Other distributions use the same net-snmp package with different package manager commands.
Step 1: Install the net-snmp Package
Install the agent and the command-line utilities with your package manager. The utilities package gives you `snmpwalk`, `snmpget`, and other tools you’ll need for testing.
yum install net-snmp net-snmp-utils
On Debian or Ubuntu, the equivalent is apt install snmpd snmp. On newer Red Hat systems, use dnf instead of yum.
Step 2: Configure the Agent
The agent reads its configuration from /etc/snmp/snmpd.conf. For a host behind a firewall and not exposed to the internet, the simplest working configuration is one line:
rocommunity MyCommunity
This lets any device that knows the community string MyCommunity run read-only queries from any IP, unless access controls are added. Write operations (SET) stay disabled, which is what you want for almost every production case.
Replace MyCommunity with something that isn’t a dictionary word or a default. “public” and “private” are scanned for constantly, so never use them.
For stricter setups, snmpd.conf also supports limiting which IPs can query the agent, enabling SNMPv3 authentication and encryption, and restricting which OIDs the agent will answer for.
Step 3: Start The Service And Enable It At Boot
Start the agent now and tell the system to launch it on every boot:
chkconfig snmpd on

service snmpd restart
On systems using systemd (most modern Linux distributions), the equivalent is:
systemctl enable snmpd

systemctl restart snmpd
Step 4: Verify the agent is responding
Test the agent from the same host before troubleshooting anything across the network. A successful local query means the agent is running and the configuration is valid for local access:
You should get back a line starting with SNMPv2-MIB::sysDescr.0 = STRING: followed by your system description. If you get that, the agent is working. If you don’t, jump to the troubleshooting checklist in the next section.
If queries fail:
Work through these in order:
Local firewall: iptables, firewalld, or nftables has to allow UDP 161 inbound. Check with iptables -L -n or the equivalent.
Network firewalls: Anything between the manager and the server also has to allow UDP 161.
Packets arriving at all: Run tcpdump -i any port 161 on the server and query from the manager. If nothing shows up, it’s a network problem.
hosts.allow / hosts.deny: Some builds of net-snmp use tcpwrappers. Add snmpd: ALL to /etc/hosts.allow to test.
Community string: Confirm the manager is using the exact string from the agent config.
Troubleshoot SNMP: A Structured Checklist
When SNMP fails, the problem is almost always in one of four places: the port, the credentials, the agent, or the ACL.
Check them in that order. Don’t skip ahead.
1. Is the port reachable?
From the manager, run nmap -sU -p 161 <device>. An “open” or “open|filtered” result means the port is reachable but is not definitively confirmed.
If it’s closed, check firewalls between the manager and the device, and any ACL on the device itself.
2. Are the credentials correct?
For v1/v2c, verify the community string character-for-character. Trailing spaces and cases are important.
For v3, verify username, auth protocol (MD5 or SHA), auth key, privacy protocol (DES or AES), and privacy key. One wrong field fails the whole exchange.
3. Is the agent running and responding?
On Linux, run systemctl status snmpd or service snmpd status.
On Cisco IOS, run show snmp to see packet counts. Rising “input queue drops” point to agent overload.
Run tcpdump -i any -n port 161 on the device. If requests arrive and no response leaves, the issue is likely with the agent configuration, credentials, or access controls.
4. Does the ACL allow this manager?
Cisco: check the ACL referenced in the snmp-server community or snmp-server group.
Linux net-snmp: the rocommunity directive accepts a source restriction, for example, rocommunity MyCommunity 10.0.0.0/24.
How To Run SNMP At Scale In Large Environments
To scale SNMP:
Set poll intervals to match the metric: 60 seconds is the common default. Drop interface counters to 30 seconds where device capacity allows, because short spikes matter. Push slow-changing values like disk capacity out to 300 seconds. Shorter intervals put more load on the device and the collector, so don’t poll faster than you need to.
Place collectors close to the devices they monitor: Polling across a WAN link costs latency on every exchange and makes trap delivery more fragile.
Batch queries with GETBULK: Use GETBULK (v2c and up) with a sensible repetition value, usually 10 to 20, to cut request counts by an order of magnitude.
Rotate credentials through configuration management: Tools like Ansible, Chef, Puppet, or Salt let you roll community strings or SNMPv3 keys across the fleet without logging in to devices individually.
Stagger polls across the interval: Spread queries evenly instead of firing them all at second zero of every minute. A thundering herd of SNMP queries causes packet loss and CPU spikes on smaller or resource-constrained devices.
SNMP Use Cases
SNMP shows up in five jobs across most IT environments: performance monitoring, fault alerting, capacity planning, troubleshooting, and compliance evidence.
Each one uses the same underlying data, but the way the data gets consumed is different.
Performance monitoring: Collect CPU, memory, interface traffic, and latency metrics at regular intervals, then graph and trend them.
Fault alerting: Raise alerts when a threshold crosses, a process crashes, a power supply fails, or an interface flaps.
Capacity planning: Use weeks and months of SNMP data to forecast when uplinks, CPU, or storage will run out.
Troubleshooting: Walk a device during an incident to inspect live counters (interface errors, routing table size, memory pools) without opening a CLI session.
Compliance: Historical SNMP data answers auditor questions about uptime, change windows, and resource use that otherwise have no record.
SNMP Limitations
SNMP weaknesses fall into three buckets: security gaps, scaling costs, and coverage gaps. Knowing which bucket a problem belongs to tells you whether to fix it, work around it, or pair SNMP with something else.
Security gaps
Two limitations are at the protocol level and affect the integrity of the data you collect:
Weak default security: v1 and v2c have no encryption and authenticate with a plaintext shared string. v3 fixes this, but needs more careful setup.
UDP loss: SNMP runs on UDP. Polls and traps can disappear silently under congestion, which gives you a false sense of coverage.
Scaling costs
Two limitations show up when you push SNMP across thousands of devices:
Polling overhead: Tens of thousands of small UDP queries per minute add up. On constrained devices (low-end switches, IoT gear), SNMP itself can eat up meaningful CPU cycles.
Table indexing quirks: Interface indexes can change after a reboot on some devices. A monitoring system that caches indexes ends up polling the wrong rows until it re-discovers.
Coverage gaps
Three limitations describe what SNMP can’t see, either because of vendor inconsistency or because the modern stack has moved on:
Uneven vendor implementations: Two devices from different vendors in the same category rarely expose the same metrics. Some expose everything. Some expose almost nothing.
OID inconsistency: Vendor MIBs use different structures for the same data. Porting a monitoring template from one vendor to another is rarely clean.
Limited visibility into modern infrastructure: Containers, serverless functions, and cloud services rarely expose SNMP at all. Modern stacks pair SNMP with streaming telemetry (gNMI, OpenTelemetry), vendor APIs, and log ingestion.
SNMP Vendor And MIB Challenges
Here are the challenges we see most often, roughly in order of how much damage each one does:
Nominal support only: Some devices implement the standard MIBs but return zeros or static values. The agent answers, but the data isn’t real. This is the hardest failure mode to catch because nothing looks broken.
OIDs that change between firmware versions: A vendor can deprecate an OID in a minor release. Monitoring built against the old OID silently stops returning data after an upgrade. We’ve watched this break customer dashboards more than once.
MIB files not published: Some vendors hide MIB files behind support portals. Without the MIB, you’re walking OIDs blind. Values come back, but nothing tells you what they mean.
Missing context: A CPU utilization OID might report a different thing on different vendors (one-minute average, five-minute average, instantaneous) without labeling which. Thresholds set against one vendor can be wrong for another.
Metrics in different branches: Interface error rates are in the standard IF-MIB on most devices, but in vendor-private trees on others. You need device-specific discovery logic to find them.
Index instability: ifIndex values can get reassigned on reboot. Some vendors offer ifAlias or a persistent index MIB as a workaround, but not all.
To avoid these challenges, validate what SNMP actually returns on each device class in your environment before you rely on the data.
Spot-check counter values against other sources (CLI output, NetFlow, application metrics) on at least one device per model.
From SNMP Support To Real Visibility
SNMP is still the universal baseline for infrastructure monitoring. Almost every piece of network hardware and server operating system can use it. For monitoring routers, switches, firewalls, UPS units, and traditional servers, nothing replaces it.
But protocol support is only the starting point. The real work is figuring out which OIDs matter, collecting them consistently across device types, and turning that data into alerts and trends your team can trust.
LogicMonitor is built to reduce that work. It helps you monitor SNMP-enabled infrastructure with less manual configuration, better device coverage, and a clearer path from raw metrics to action.
Simplify SNMP monitoring across hybrid infrastructure
See how LogicMonitor helps teams discover the right SNMP metrics, reduce manual OID work, and turn device data into actionable alerts and visibility.
Yes. SNMP is still widely used for monitoring routers, switches, firewalls, UPS systems, storage arrays, and traditional servers. It remains useful because so much infrastructure supports it by default.
2. Is SNMP the same as NetFlow?
No. SNMP reports device health and counters, such as CPU, memory, interface errors, and traffic totals. NetFlow shows traffic conversations, including who is talking to whom, over which ports, and how much data they are sending.
3. Is SNMP push or pull?
SNMP is mostly pull-based because the manager polls agents on a schedule. It also supports push-style alerts through traps and informs, but those are usually used as a secondary signal.
4. Can SNMP monitor cloud infrastructure?
Only in limited cases. Most cloud-native services, containers, and serverless platforms do not expose SNMP, so teams usually pair SNMP with cloud APIs, logs, OpenTelemetry, or vendor-specific integrations.
5. What is the difference between SNMP and ICMP?
SNMP collects detailed device metrics, such as CPU, memory, interface counters, and hardware status. ICMP is usually used for basic reachability checks, such as pinging a device to see if it responds.
6. Should SNMP SET be enabled?
Usually, no. SNMP SET allows configuration changes through SNMP, which creates unnecessary risk in most monitoring environments. Keep it disabled unless you have a specific, controlled use case.