
Server Monitoring That Sees It All
From hybrid infrastructure to edge workloads, get full visibility and AI-powered insights that show you exactly what to fix and why.


From hybrid infrastructure to edge workloads, get full visibility and AI-powered insights that show you exactly what to fix and why.
Full visibility into every server, in every environment—on-prem, virtual, or cloud. No blind spots or silos. Just clarity that scales.
With less noise and fewer false alarms, you’ll spend less time chasing alerts and more time resolving what actually matters.
Spot patterns early, stay ahead of resource constraints, and keep servers running smoothly—no scrambling required.
Avoid overprovisioning and stop underestimating with real data to forecast demand and grow without the risk.
Translate server performance into uptime, experience, and impact. Prove your team’s value with insights everyone understands.
With less manual setup and fewer repetitive tasks, you’ll have more time to innovate, improve, and focus on what matters most.
OBSERVABILITY POWERED BY LOGICMONITOR ENVISION AND EDWIN AI
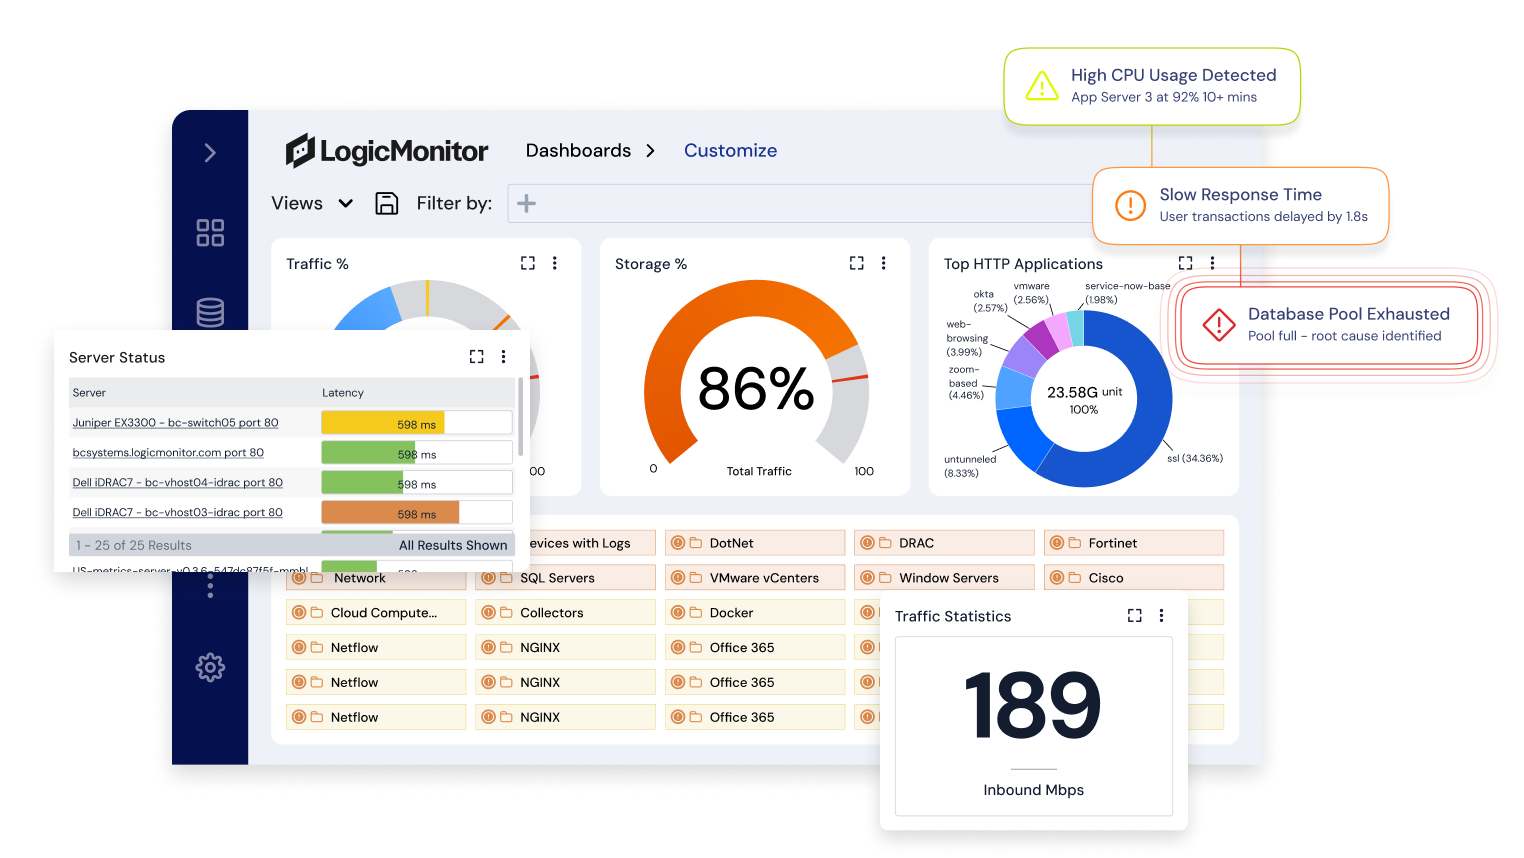
LM Envision provides deep, automated visibility into server health, performance, and resource utilization across Windows, Linux, and virtual environments, so your teams can keep mission-critical systems online and running at peak efficiency.
Quickly detect and begin monitoring your entire server estate—bare metal, VMs, and cloud using agentless, IP-range-based discovery.
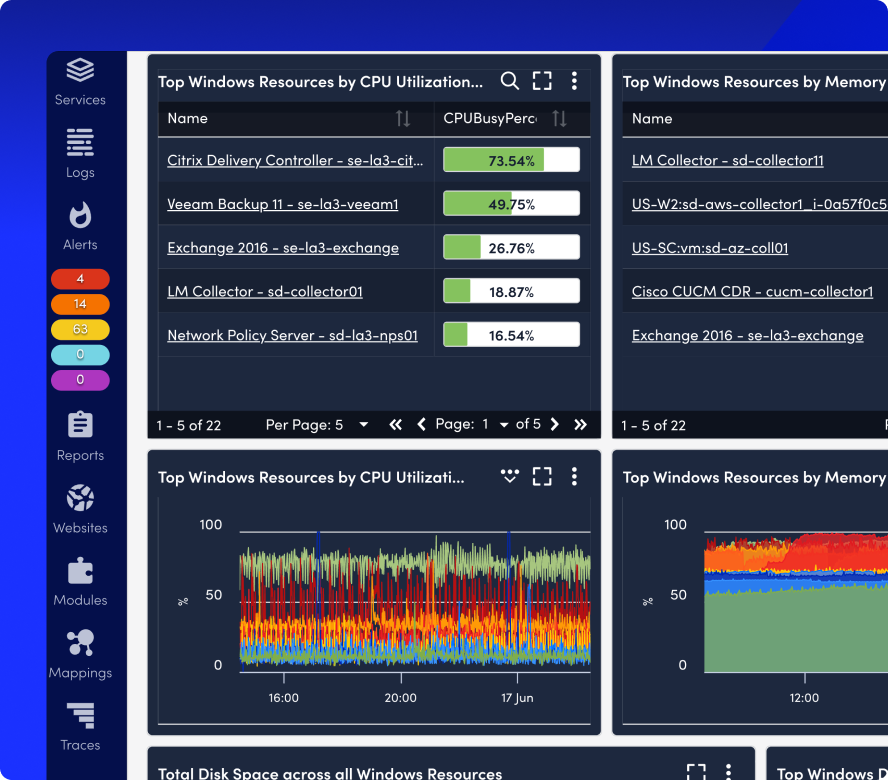
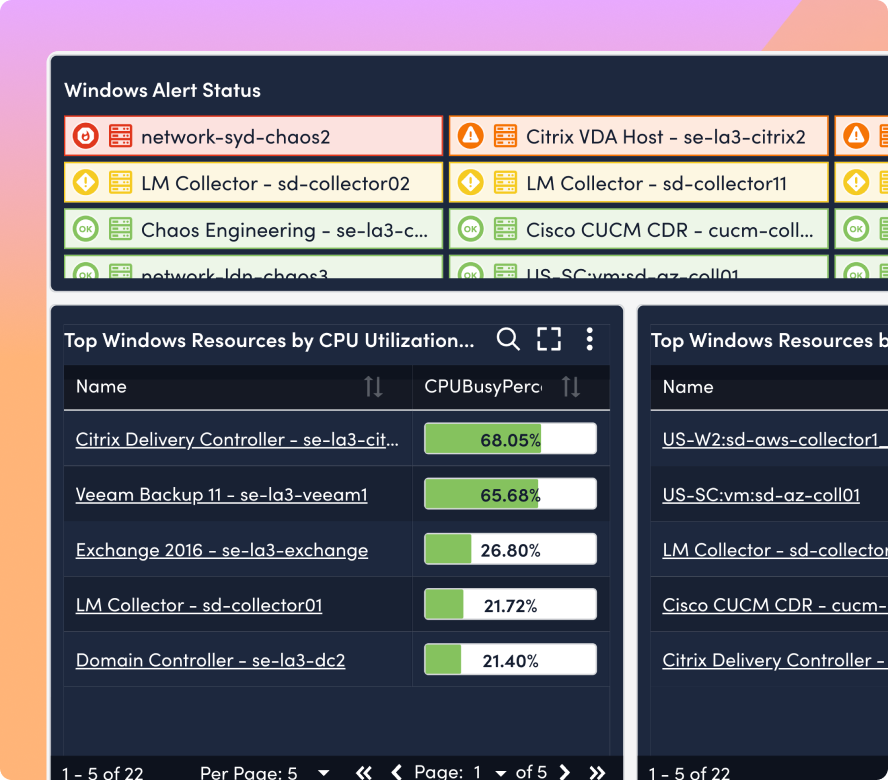
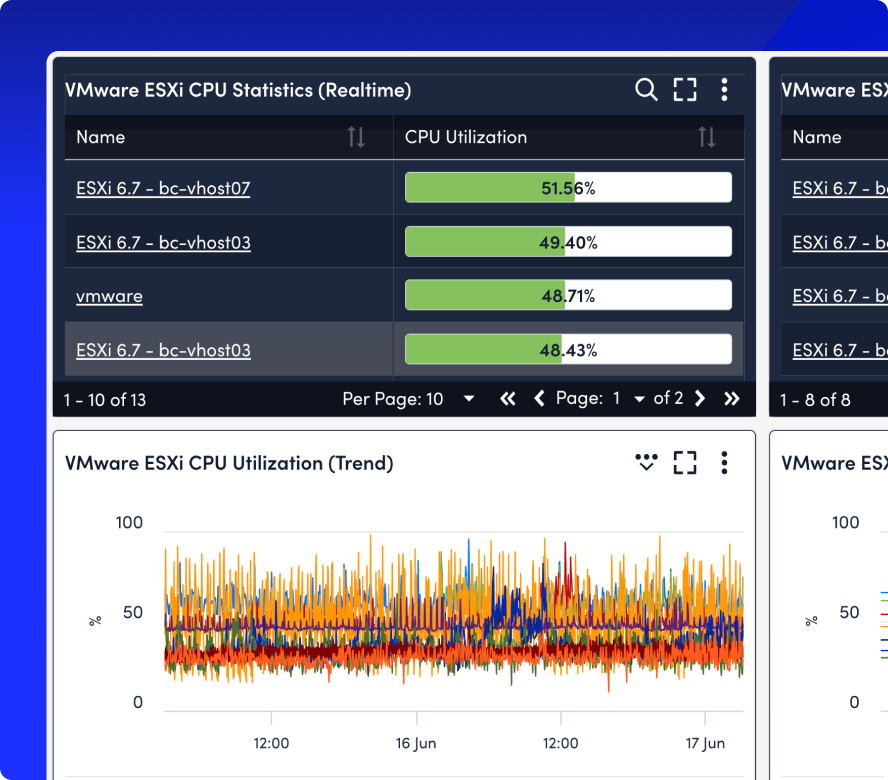
Go beyond basic up/down monitoring. Track CPU, memory, disk I/O, and network usage across all environments and get alerted with precision.
Gain full-stack visibility across on-prem, virtualized, and cloud server environments, plus the applications and hardware they depend on.
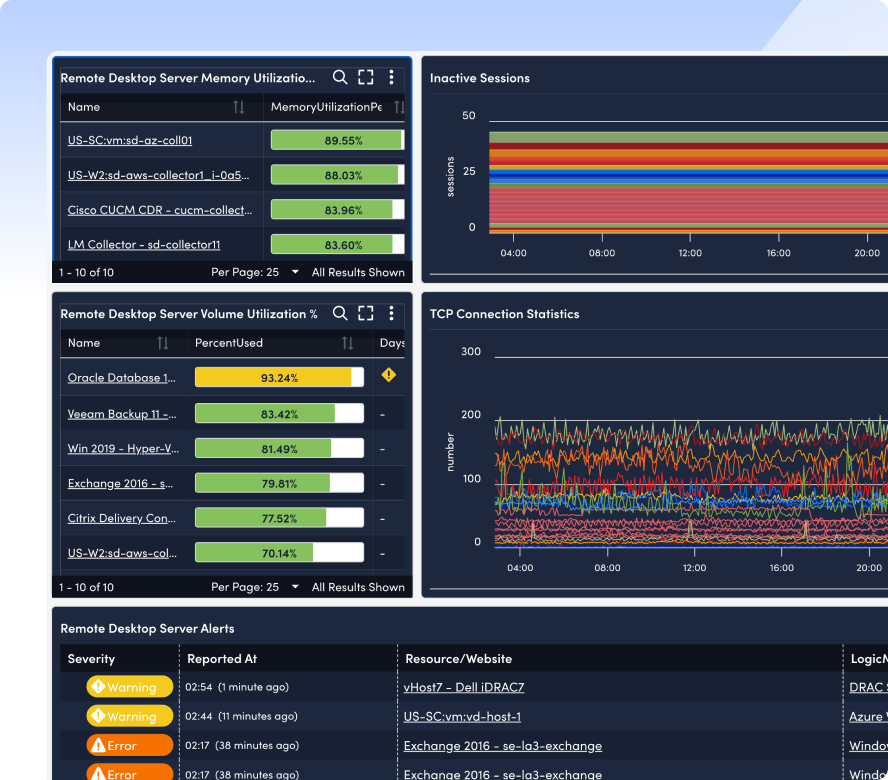
Customizable, pre-built dashboards give infrastructure teams clear, actionable insights across server fleets.
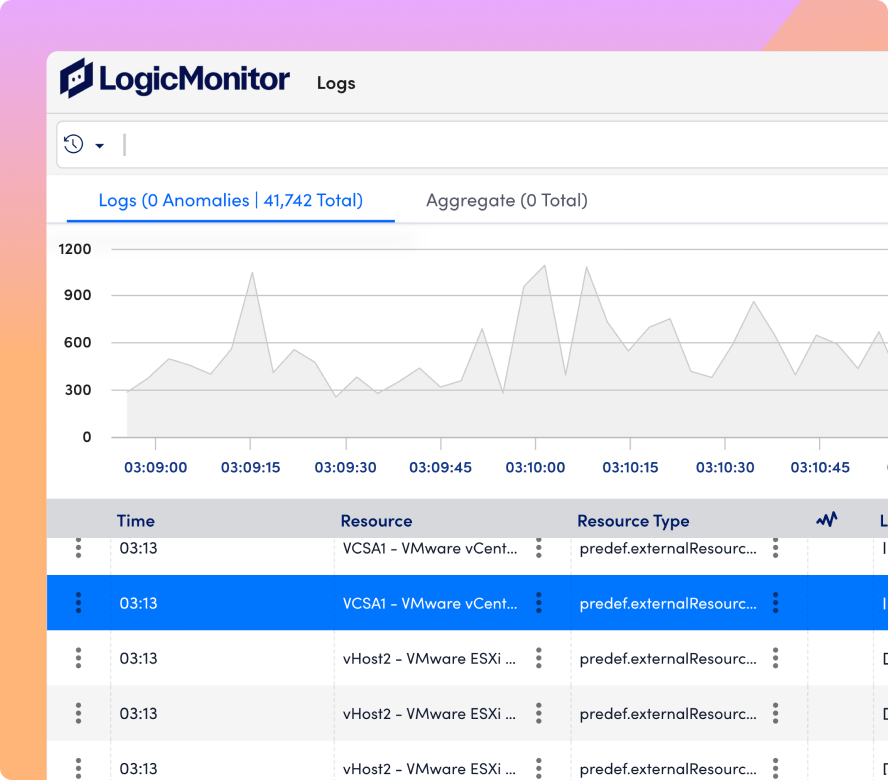
LM Envision ingests and analyzes server logs alongside performance data, so you can detect and resolve issues before users feel the impact.
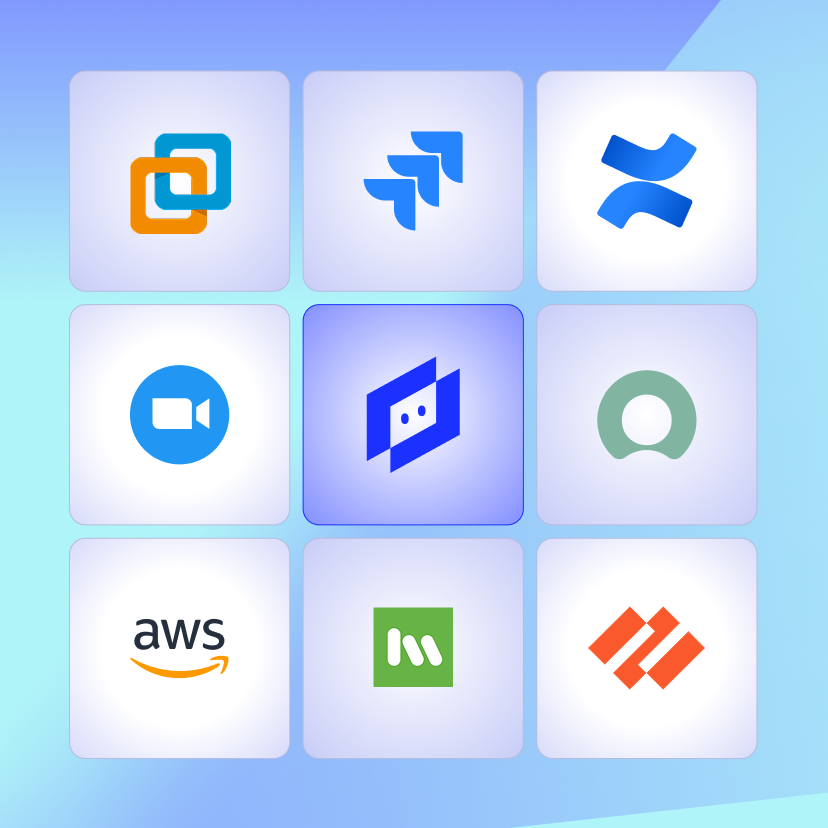
INTEGRATIONS
LM Envision connects with the tools your teams already rely on, so you can streamline incident response, enrich your server data, and automate more with less effort. From ITSM and collaboration tools to config management and cloud platforms, we’ve got you covered.
100%
collector-based and API-friendly
3,000+
integrations and counting
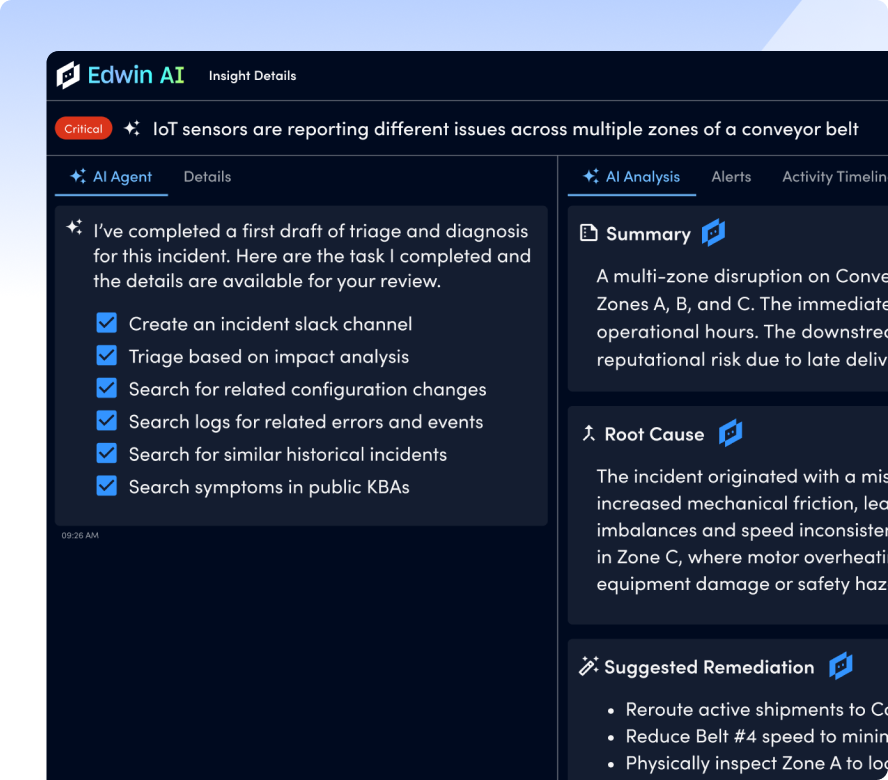
AI AGENT FOR OPS
Edwin surfaces context-aware insights from your server data, so you can detect anomalies faster, reduce false positives, and make confident, data-backed decisions without digging through dashboards.
67%
ITSM incident reduction
88%
noise reduction
By the numbers
GET ANSWERS
Get the answers to the top server monitoring questions.
No. LM Envision uses a lightweight, agentless collector to discover and monitor your servers via IP ranges. Setup is fast and requires no custom scripts or invasive installs.
LM Envision supports Windows, Linux, Solaris, AIX, VMware ESXi, and more across physical, virtual, and cloud-based deployments.
Yes. LogicMonitor includes out-of-the-box support for web servers (like Apache), mail servers (like Exchange), and databases (like SQL Server, MySQL, Redis), with full correlation across layers.
Dynamic thresholds, anomaly detection, and root cause analysis help identify what’s truly service-impacting, so you get fewer alerts, with better context.
Absolutely. LM Envision includes pre-built server dashboards and allows you to build custom views using drag-and-drop visualizations for any audience—technical or executive.
