LogicMonitor is a comprehensive cloud-based monitoring platform that covers everything from the network to cloud to microservices. We offer full visibility and actionable data across your entire infrastructure, so you deliver better service, spend less time on maintenance, and shift focus to more strategic projects.
LogicMonitor is a platform built by engineers for engineers, and we know that your network infrastructure is an integral part of your business, supporting mission-critical infrastructure so you can ensure maximum availability. LogicMonitor makes this easy with comprehensive monitoring for switches, routers, firewalls, network traffic, VoIP, and SD-WAN tied together with topology so you can easily visualize your network.
Eliminate silos and keep your team informed
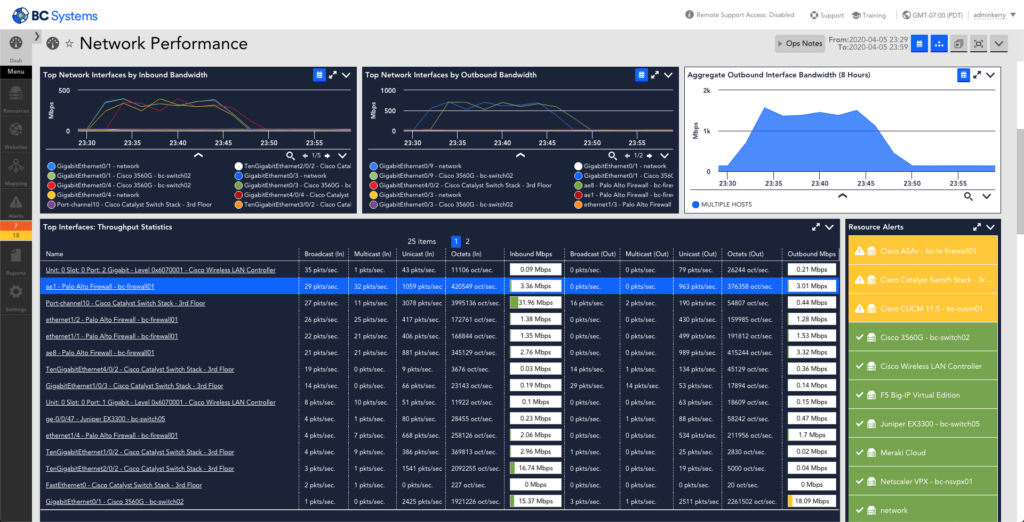
At-a-glance status dashboards are automatically created for each of your services based on industry best-practices, making it easier to share information and keep your team informed. Users can increase visibility and combine data from across the entire infrastructure stack to create application or service-specific views all while keeping teams connected with built-in integrations for service management tools like ServiceNow, Autotask and Connectwise, and communication tools like Slack, and incident notification tools like PagerDuty.
Automated deployment and alerting
LogicMonitor discovers everything you need to know about your network automatically. Simply enter a hostname or an IP address and within minutes you’ll have the monitoring, alerting, and graphs you need to maintain and optimize network infrastructure. Get the coverage you need for even the most complex networks – whether resources are on-premises, spread across multiple data centers, or in the cloud.
“The single best feature is the agentless architecture. It allows us to have a small footprint on our clients and makes deployment very quick. Our onboarding times dropped substantially once we adopted LogicMonitor. As our deployments matured the biggest win has been adaptability. The extensible nature of LM has allowed us to readjust as our needs and products evolve,”
– Julio M, DevOps at Citrix
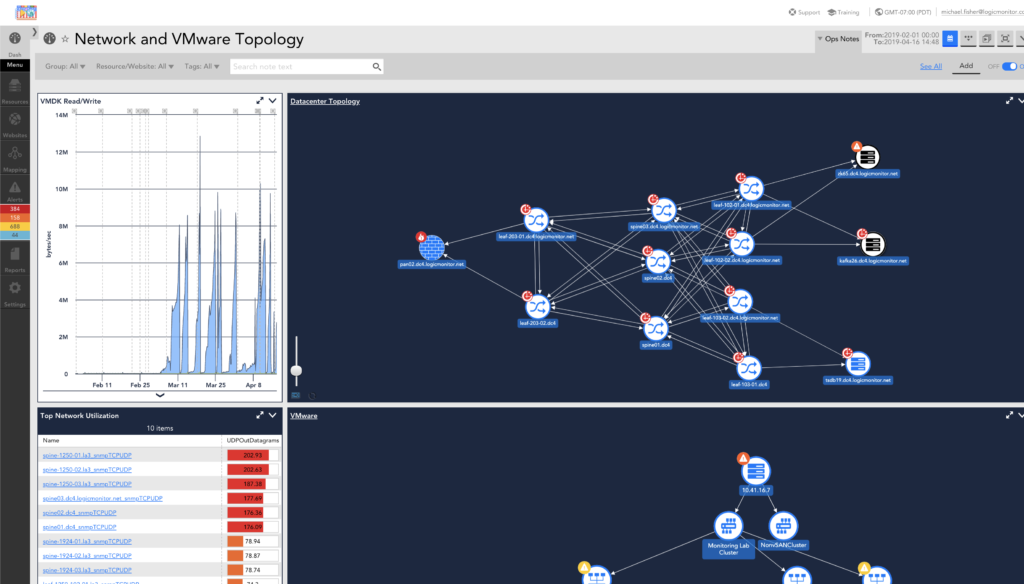
Visualize your network with topology
With auto-generated topology mapping, LogicMonitor allows you to discover and map the relationship between critical infrastructure resources. Drill down further and generate a topology map based on alerts to streamline your troubleshooting workflow.
Reduce alert noise with advanced intelligence
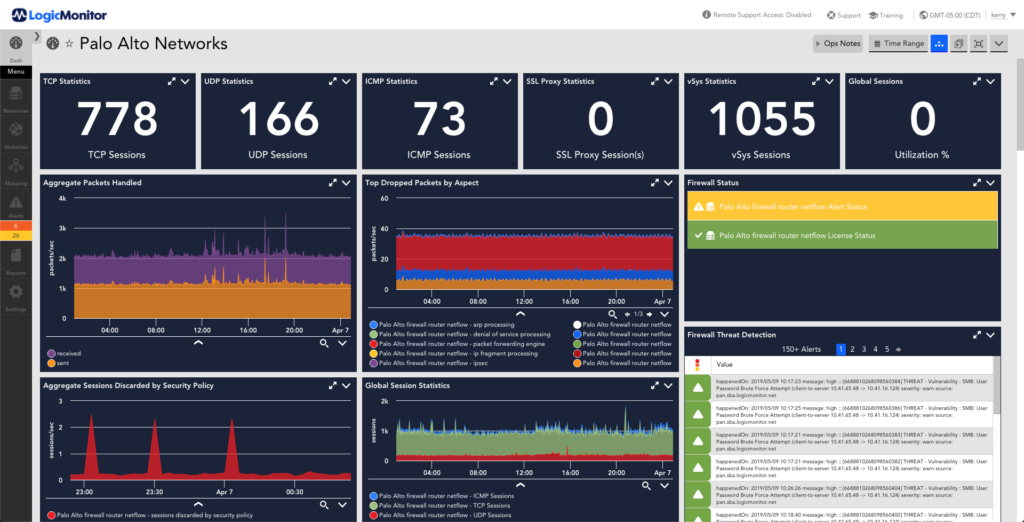
Proactively manage challenging network conditions such as congestion and over-consumption of network resources with in-depth analysis of top NetFlows, ports, and QoS tables. Cut through the noise and streamline workflows with advanced AIOps capabilities including root cause analysis and dynamic thresholds.
Want a downloadable copy?
Originally published June 10, 2020. Updated November 2022