EMC Data Domain
If you need to ensure all your storage systems are working at their peak – you need LogicMonitor.
Using just the hostname, LogicMonitor will determine your system type. If EMC Data Domain monitoring is your goal, LogicMonitor will automatically detect and monitor all:
- temperature sensors
- power modules
- NVRAM batteries
- Interfaces
- File Systems
- Fans
- Disks
- and more
…with best practices alerts and thresholds pre-defined. You’ll get graphical trends of compression and performance going back a year as well as alerts informing you of issues that need your attention. Automatically.
Just a few of the critical Data Domain metrics we monitor:
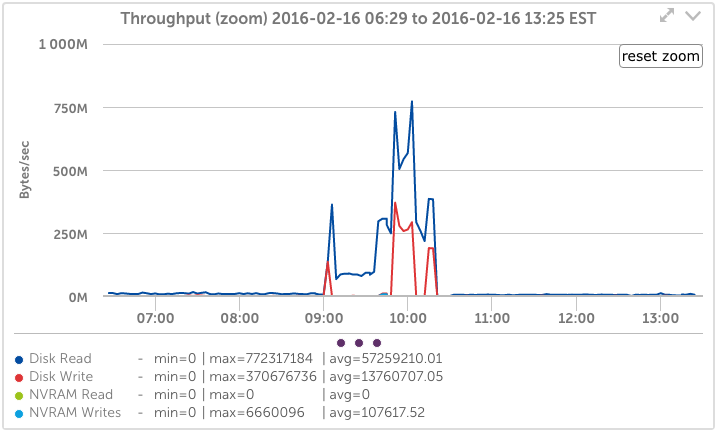
Data Domain System Metrics
Track the throughput, CPU load, CIFS and NFS Operations, Disk Load, and more – automatically. You’ll know when you are reaching the limits of CPU or disk performance, whether replication load is high, or NFS processing time.
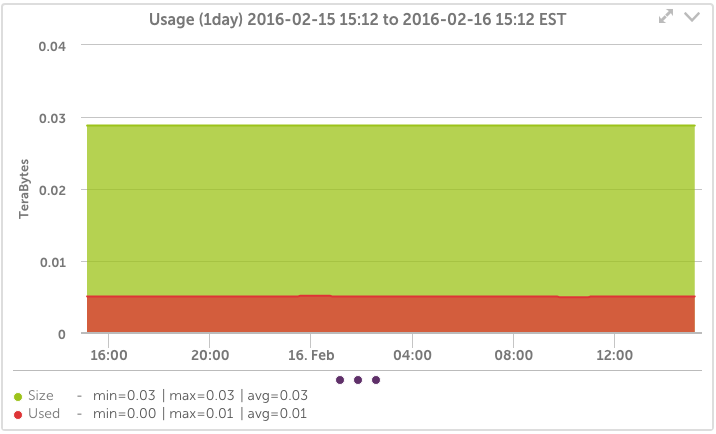
Data Domain File System Metrics
Automatically detect each file system, and trend the usage over time for the last year – while zooming in to any period for more detail. Create aggregate graphs that show all data domain storage on a single dashboard entry, and more.
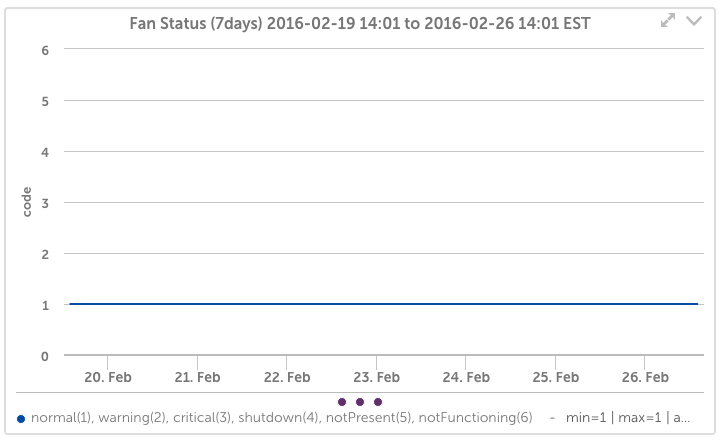
Data Domain Health Monitoring
Automatically detect every disk drive, fan, power supply, and temperature sensor in the DataDomain system, and monitor for failures and alert conditions. Escalate alerts to the right people, at the right time, to ensure your systems are up.