Available for Enterprise and Enterprise MSP customers, the new Header Graph (Beta) feature is being rolled out in the v148 release. This time-series graph allows for easy alert grouping to cut down troubleshooting time and quickly identify the resources that are causing an alert storm.
Easy Alert Grouping With New Header Graph on Alerts Page
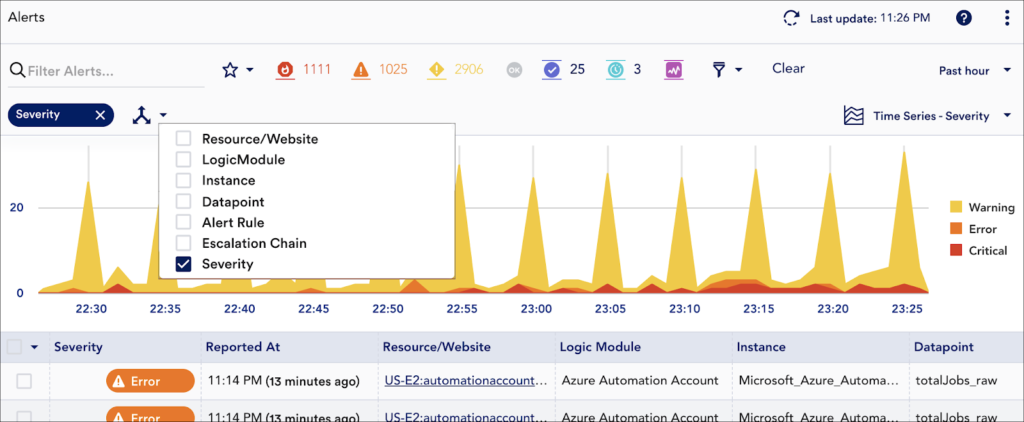
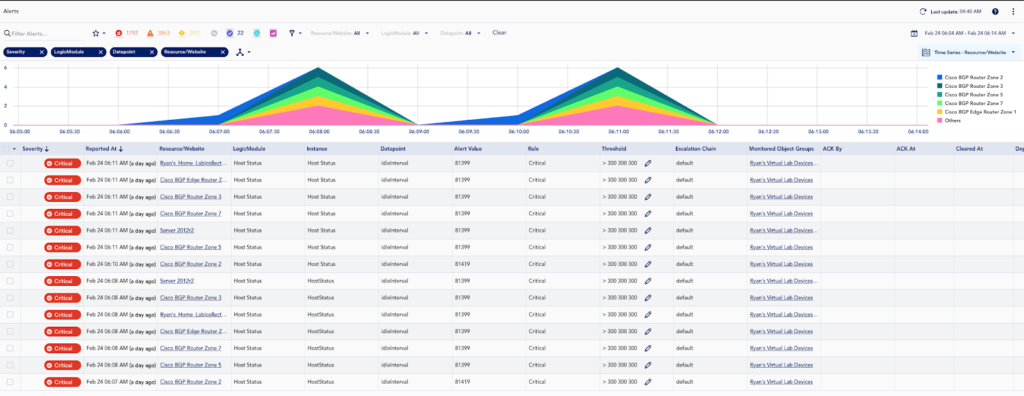
The Alerts page features a brand new time-series header graph that provides immediate visual insight into an alert storm or other events requiring investigation.
Representing the alerts currently displayed in the alert table, this graph’s aggregated alert counts can be grouped by a number of dimensions including alert severity, associated alert triggers (resource, LogicModule, instance, datapoint), matching alert rules, or the escalations chains used to deliver alert notifications.
In just a few clicks, you can group alerts by highly relevant dimensions. This can greatly speed up troubleshooting during an alert storm as well as aid in the identification of recurring issues that require remediation or adjustments to alert thresholds.
Available by clicking the more options icon located in the upper right corner of the Alerts page, the header graph is highly interactive, allowing you to zoom in on a time range or use the graph’s legend to quickly include/exclude a group of alerts. As you interactively change the graph’s filters, the alert table will automatically update to remain in sync.
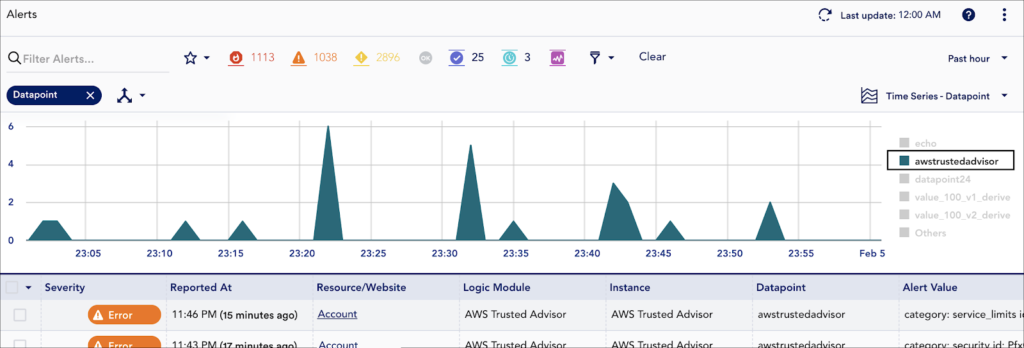
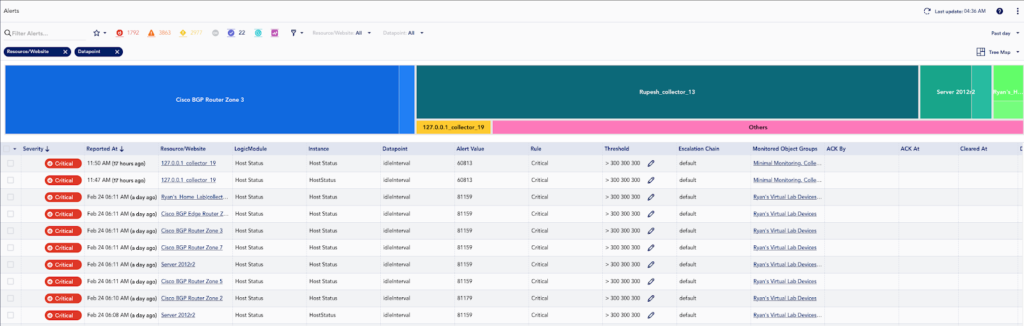
Use the graph’s legend to quickly home in on a group of alerts. Here, we’ve grouped the past hour of alerts by their associated datapoint and then focused in on a particular datapoint.
The header graph helps shave time off of MTTR by allowing users to quickly group alerts via alert properties so that in the case of an alert storm, the triggering resource, module, instance, etc. can be quickly identified for further troubleshooting and remediation.
In just a few clicks, you can use the header graph to do the following:
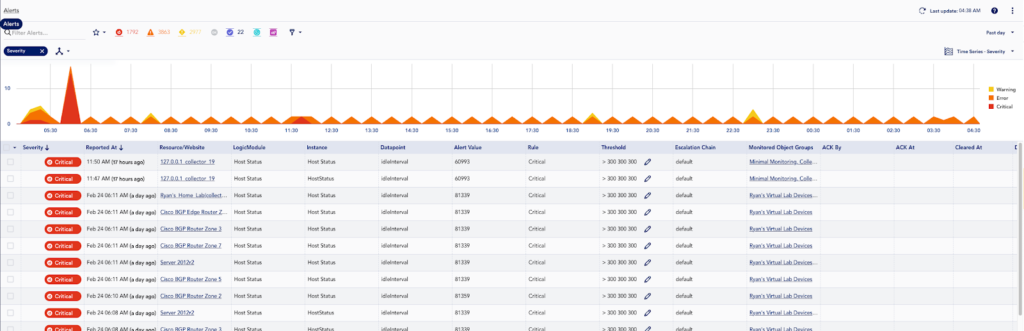
Immediately get a visualization for a spike in alerts.
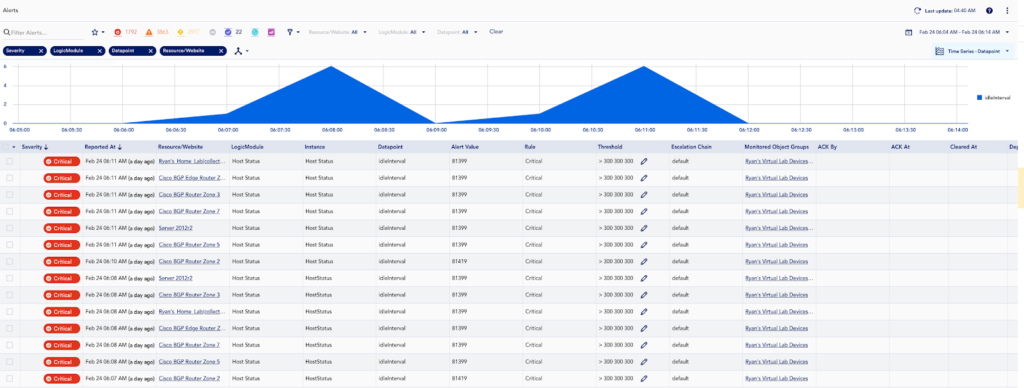
Zoom in on the spike in the graph and add a dimension for Datapoint to see that the alerts are all related to the same metric.
Add a dimension for Resource/Website to quickly see the affected resources.
LogicMonitor’s AIOps Early Warning System
Alert grouping is part of our AIOps Early Warning System. First introduced in late 2019, the Early Warning Systems consists of several advanced features aimed at reducing alert noise and improving troubleshooting via anomaly detection. Since this release, we’ve vastly improved on the Dynamic Thresholds feature to reduce alert noise and troubleshooting via anomaly detection. While Root Cause Analysis (RCA) has expanded its coverage, along with topology, its scope to address additional dependency use cases has been limited. LogicMonitor also has Service Insights, Cluster Alerts, host down, and Collector down logic to help reduce alert noise. Even put together these features do not cover the majority of use cases, especially as monitoring expands into the cloud and microservices environments.
We have learned a great deal from your feedback on all of these features, especially RCA, and are embarking on a path to provide a universal alert grouping and notification suppressions solution in LogicMonitor. We are starting with a fairly basic cornerstone to allow for easy alert grouping via the new Alerts Page header graph, but this is only the first step towards the expansion of our Early Warning System to not just aid in troubleshooting issues after the fact, but providing additional context to remedy the issue and prevent it from reoccurring in the future.
With an influx of new data from recent enhancements such as Logs and Netflow, as well as new features coming out this year for Synthetics and Tracing, LM will provide access to large amounts of data for Hybrid Observability powered by AI. This feature is only the first step towards providing a universal approach for alert grouping and contextual analysis no matter the source or data type.
Next Steps for the Early Warning System
Throughout the next year we will continue to iterate on this feature with performance improvements and functional enhancements such as:
Multi-dimensional organization and sub-grouping of alerts via a Tree Map (See screenshots below)
Expanded alert properties ror grouping, including custom properties such as location and customer/department
Adding the graphically applied filters to the saved alert filters
Incorporating signals correlation as an alert grouping option
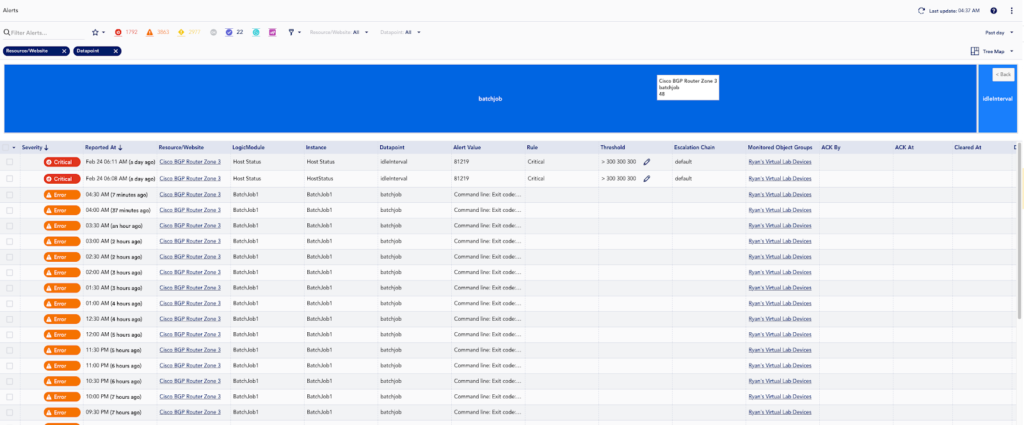
Two-dimensional treemap graph for sub-grouping
Zoom in on a map section to get further contextual information on the sub-grouped values and counts
This is only the beginning of how we will use this initial step for easy alert grouping in the UI to allow for automated grouping of alerts and suppression of notifications. Stay tuned to our release notes for further updates. Reach out to your Customer Success Manager if you would like to get more involved with development, prototyping, and beta testing.
Disclaimer: The views expressed on this blog are those of the author and do not necessarily reflect the views of LogicMonitor or its affiliates.