
How to Read a Traceroute
Traceroute reveals the path your traffic takes and where latency or packet loss occurs. Here is how to read and act on the results.


Denton Chikura

The quick download:
Traceroute is one of the most useful tools in a network engineer’s toolkit, but reading the output correctly requires knowing what to look for.
-
High latency at a single hop does not always indicate a problem at that device. Look for sustained latency increases across subsequent hops.
-
Asterisks in traceroute output mean a router did not respond, not necessarily that the path is broken.
-
Asymmetric routing means the return path may differ from the forward path, which affects how you interpret latency readings.
-
Baseline and periodically re-run traceroutes for your critical paths, alerting on new or persistent latency jumps across multiple hops so you can triage routing or provider issues before users feel the impact.
The traceroute tool is one of the simplest yet most helpful tools you can use to troubleshoot network issues. This tool is built into virtually every operating system, so no matter what type of computer you are working on, you will have it available. Traceroute runs a connection test from one computer to another device, showing each “hop” that it takes between devices on the network.
In this article, we’ll introduce you to the fundamentals of traceroute and how it works in some of the most popular operating systems. We’ll see some examples of its operation, examine the differences in how it is implemented in each OS, and discuss the various limitations these conventional implementations of traceroute often have. Finally, we’ll discuss the limitations of conventional traceroute limitations traditional traceroute implementations.
Traceroute – Understanding what it does
To see traceroute in action, we can begin with a simple example of running a traceroute from your computer to LogicMonitor’s servers. The specific results will be different for each person. However, in most cases, the results will show you somewhere around 4-20 “hops” that packets take to get from your computer to Logicmonitor’s’s servers and back. The first one would likely be your local router, and from there the data will take multiple “hops” through your internal network and out through your internet service provider (ISP) and over the Internet, before finally reaching LogicMonitor’s servers.
Figure 1 shows an example of what you might see on the command prompt of a Windows computer.
Microsoft Windows [Version 10.0.19043.1288]
(c) Microsoft Corporation. All rights reserved.
C:\Users\Michael>tracert catchpoint.com
Tracing route to catchpoint.com [64.79.149.76]
Over a maximum of 30 hops:
1	2ms	1ms	1ms 10.0.0.1
2 	10ms	10ms	10ms 96.120.40.245
3	10ms	11ms	12ms	96.110.175.85
4	10ms	16ms	10ms 	162.151.63.57
5	19ms	16ms	20ms	96.108.21.57
6	15ms	19ms	14ms	96.216.134.10
7          	19ms 	22ms 	21ms 	be-32121-cs02.350ecermak.il.ibone.comcast.net [96.110.42.181]
8          	22ms 	34ms 	22ms 	be-2204-pe04.350ecermak.il.ibone.comcast.net [96.110.37.38]
9          	22ms 	20ms 	20ms 	50.208.234.106
10       	51ms 	50ms 	49ms 	ae18-0.cr02.dlls02-tx.us.windstream.net [40.128.10.135]
11       	73ms 	72ms 	72ms 	ae4-0.agr03.phnd01-az.us.windstream.net [169.130.193.231]
12       	84ms 	73ms 	75ms 	ae1-0.pe05.phnd01-az.us.windstream.net [169.130.169.31]
13       	85ms 	84ms 	85ms 	h241.23.132.40.static.ip.windstream.net [40.132.23.241]
14       	*         	82ms 	78ms 	be181.las-n10s1-core1.switch.com [66.209.64.121]
15       	79ms 	77ms 	80ms 	bell011.las-agg7s5-1.switch.com [66.209.72.26]
16       	79ms 	77ms 	79ms 	64.79.139.18
17       	77ms 	77ms 	87ms 	64.19.149.76
Trace complete
Understanding how to run this tool, and what all the different information displayed when you run a traceroute command means, will help you when troubleshooting various types of problems.
The Anatomy of Traceroute
Traceroute is often associated with the closely related ping tool. As such, it is often thought that, like ping, it is standardized across all platforms and operating systems, whether you are using Windows, macOS, or Linux. However, this is not the case.
Where ping’s underlying operation typically functions identically on virtually all OSes using the Internet Control Message Protocol (ICMP), traceroute has very different implementations on each operating system. While traceroute’s core functionality is the same across all platforms, there are differences in the actual protocols and mechanisms used to deliver that functionality. Implementation and even command syntax and output may differ.
Underlying support protocol
One of the major differences has to do with the underlying support protocol that is used. On a Windows device, traceroute uses ICMP exclusively. This is the same protocol used for ping. Although extremely versatile, it does have its limitations, which we’ll touch on shortly.
On the other hand, both macOS and Linux use UDP by default to perform traceroute operations. Even so, the tool can be configured to use either ICMP or TCP as well. This gives much more versatility in the tool’s use, especially when it comes to the limitations that are often imposed on the use of ICMP for diagnostic operations.
In the following sections, we’ll show you how to run traceroute on a Windows device and highlight some of the differences in implementation between using this tool on macOS and Linux.
How to run the Traceroute command on Windows
Running a traceroute is very simple. The first step is to bring up a command prompt on your computer. The specific method to bring this up will depend on what operating system you are using. For Windows 10, for example, you can simply click on the start button and type CMD to bring up the options below.
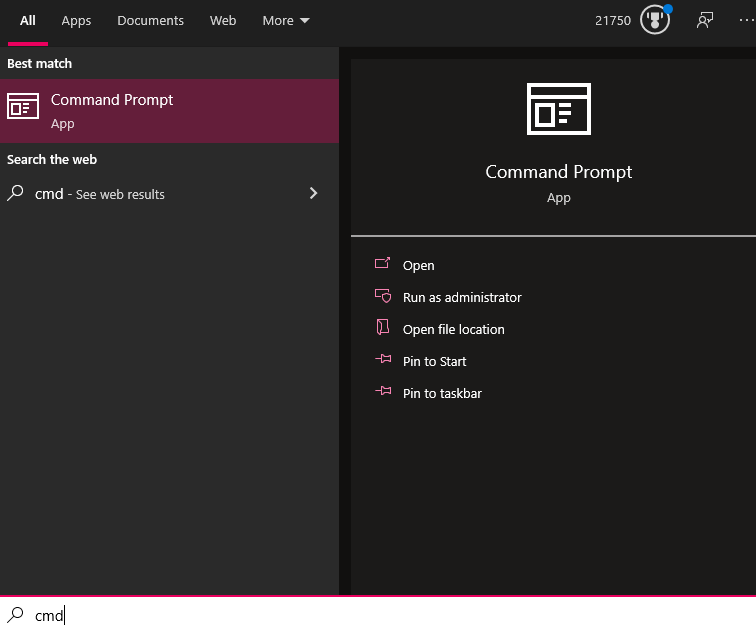
From here, simply click on the Command Prompt app to open it up. When your command prompt has loaded, just type the command tracert followed by the destination you want to use to run the test. For example, to run a test to logicmonitor.com you would type tracert logicmonitor.com and hit enter. (For Linux and macOS devices, you would type traceroute logicmonitor.com instead.)
Available options for the Traceroute command
In most cases, the default traceroute command will give you the information you need. There are, however, some additional options that you can use to get more details or change how the command runs.
Accessing these options is done by adding in one or more option flags after the traceroute command and before the destination. On Windows-based machines, the flags for various options start with a “/”. The following are the most commonly used options that you can choose from and what they do:
- /d — This flag stops the attempt to resolve an IP address to a domain name at each hop. This can speed up the trace and provide you with a clear list of IPs at each hop that is not cluttered with full domain names.
- /h — Use this flag to specify the maximum number of hops; the default is 30. Increasing this limit may be necessary for destinations that are far away. To set the maximum number of hops to 45, for example, you would type tracert /h 45 logicmonitor.com .
- /w — This sets the amount of time that the command will wait at a hop before timing out, measured in milliseconds. The default is 4 seconds (4,000 milliseconds). Type /w 6000, for example, to set the timeout to 6 seconds.
- /4 or /6 — Using the /4 or /6 flag makes it so the traceroute command will only use either IPv4 or IPv6 hops for the command.
- /h — This will bring up help information about the traceroute command.
How to read the results from a Traceroute
One of the best things about the traceroute tool is that once you learn how to read the results, you can understand the information it provides with just a quick glance. When you look at the example results of the traceroute listed above, you will see several key pieces of information.
The following table breaks down the key information you will see:
| Hop Number | RTT Attempt 1 | RTT Attempt 2 | RTT Attempt 3 | Hop Details |
|---|---|---|---|---|
| 1 | 2ms | 1ms | 1ms | 10.0.0.1 |
| 2 | 10ms | 10ms | 10ms | 96.120.40.245 |
| 3 | 10ms | 11ms | 12ms | 96.110.175.85 |
Table 1: Representation of traceroute results.
Hop Number
| Hop Number | RTT Attempt 1 | RTT Attempt 2 | RTT Attempt 3 | Hop Details |
|---|---|---|---|---|
| 1 | 2ms | 1ms | 1ms | 10.0.0.1 |
| 2 | 10ms | 10ms | 10ms | 96.120.40.245 |
| 3 | 10ms | 11ms | 12ms | 96.110.175.85 |
Table 2: Example of traceroute details highlighting the hop number column.
The first column just tells you which hop the trace is on. Whenever you access the Internet (or even data on an internal network), the data travels from one piece of hardware to another. These will typically be routers, but could also be switches, servers, or even computers. Each of these pieces of hardware that the data goes through is considered a hop.
The total number of hops that a connection goes through will depend on many factors, the most important of which is the physical locations where you run the command and the destination.
Round Trip Time (RTT) Results
| Hop Number | RTT Attempt 1 | RTT Attempt 2 | RTT Attempt 3 | Hop Details |
|---|---|---|---|---|
| 1 | 2ms | 1ms | 1ms | 10.0.0.1 |
| 2 | 10ms | 10ms | 10ms | 96.120.40.245 |
| 3 | 10ms | 11ms | 12ms | 96.110.175.85 |
Table 3: Example of traceroute results highlighting the round trip time (RTT) results.
The next three columns (Table 3) show the amount of time it took data to go from the source (typically your computer) to that hop and back. This is measured in milliseconds.
When running the traceroute command, you are sending data to each hop three times. The first column is the amount of time it took the first time, the second is for the second attempt, and the third is for the last attempt. When everything is running properly, the round-trip time for each attempt should be similar.
Hop Name and IP Address
| Hop Number | RTT Attempt 1 | RTT Attempt 2 | RTT Attempt 3 | Hop Details |
|---|---|---|---|---|
| 1 | 2ms | 1ms | 1ms | 10.0.0.1 |
| 2 | 10ms | 10ms | 10ms | 96.120.40.245 |
| 3 | 10ms | 11ms | 12ms | 96.110.175.85 |
Table 4: Explanation of traceroute results highlighting the hop details.
The final column is where the name, IP address, or other information about the hop is displayed. The information displayed here is determined by the settings on the hop itself.
Some devices are set to only display their IP addresses. Others will also display the device name or other information. In some cases, the owner of the device has set it up so that it will not reveal any information at all, in which case you will simply see an asterisk (*) for that particular hop.
Common network problems discovered with Traceroute
You can use this command to look for a variety of network issues and determine which problems may be present based on the results displayed.
Asterisks (Timeouts) at various points
The most common issue you will see with a traceroute is a timeout response, which is represented by an asterisk (*). These happen quite frequently and for a variety of different reasons. In the following example, you can see multiple hops have asterisks when attempting to run a traceroute to google.com.
C:\Users>tracert google.com
Tracing route to google.com [2607:f8b0:4009:819::200e]
Over a maximum of 30 hops:
1          	1ms    	1ms    	1ms    	2601:404:cf00:75c0:e2db:d1ff:fe1d:23ad
2          	8ms    	*         	*         	2001:558:4020:30::1
3          	9ms    	11ms 	13ms 	2001:558:112:3c0a::1
4          	12ms 	9ms    	10ms 	2001:558:110:b02c::1
5          	*         	20ms 	*         	2001:558:110:f1::1
6          	34ms 	20ms 	27ms 	2001:558:110:71::2
7          	*         	21ms 	21ms 	be-32131-cs03.350cermak.il.ibone.comcast.net [2001:558:3:2ae::1]
8          	21ms 	*         	*         	be-2311-pe11.350cermak.il.ibone.comcast.net [2001:558:3:72::2]
9          	20ms 	20ms 	21ms 	2001:559::11b2
10       	19ms 	20ms 	20ms 	2607:f8b0:831d::1
11       	22ms 	23ms 	23ms 	ord38s30-in-x0e.1e100.net [2607:f8b0:4009:819::200e]
Trace Complete
C:\Users>
When you see an asterisk, it will mean one of the following things:
- Single Asterisk on a Hop: This means that the request timed out on just one of the three attempts. This can be a sign that there is an intermittent problem at that hop.
- Three Asterisks, Then Failure: If you see all three attempts at a hop have asterisks and then the traceroute errors out, it means that the hop is completely down.
- Three Asterisks, Then Success: If you see three attempts at a hop failing but then the rest of the traceroute continues without an issue, that is actually not a problem at all. This simply means that (as mentioned earlier) the device at that hop is configured not to respond to pings or traceroutes so the attempt times out.
Elevated latency after one hop
If everything looks fine for several hops but then the response times jump up significantly at one point and each hop after that remains high, it likely means a problem either at that hop or on the connection between it and the previous one. Since the connection from you to each successive hop has to go through that one, they will all be impacted by the latency it is causing.
If you can identify where that hop is located, you can work with the owner of that connection to troubleshoot the problem. The issue will most often be with their data circuit.
If you do not know the owner of that connection and this latency is causing significant problems, you may be able to work with your Internet service provider to have your traffic routed around that point.
One hop of elevated latency
If you see one hop that has an elevated response time but then the rest of the hops return to normal, this is not anything to be concerned about. It simply means that the device at that hop is configured so that responding to traceroutes is a low priority, which causes this type of delay. While there may appear to be latency on the traceroute, that slowness will not impact normal internet traffic.
Comparison of Traceroute on Windows, macOS, and Linux
The above examples showcased the traceroute tool on a Windows device. The functionality is largely the same on macOS and Linux, with similar lists of responses, number of probes, and interpretation of output. However, there are differences in syntax, the options available for each, and the flexibility offered.
Linux and macOS traceroute origins
In general, Linux and macOS are very similar in their implementation of traceroute because of their shared roots in Unix-like systems. Many command-line utilities in both systems adhere to similar standards that define operating system interfaces and environments. This standardization is why many commands, including traceroute behave similarly across different OSes.
Both of these latter OSes deliver much more flexibility in the traceroute tool than Windows, which is reflected in the many options that can be used. More information about traceroute in a macOS and Linux environment can be found at these links.
Comparing and Contrasting traceroute on various OSes
The following table highlights some of the main differences between the implementation of traceroute on Windows, macOS, and Linux operating systems:
| Feature | Windows | macOS | Linux |
|---|---|---|---|
| Command Name | tracert | traceroute | traceroute |
| Default Protocol | ICMP Echo Requests | UDP | UDP |
| Change Protocol | Not applicable (ICMP only) | -I for ICMP, -T for TCP SYN | -I for ICMP, -T for TCP SYN |
| Number of Probes per Hop | 3 (fixed) | 3 by default, can be changed with -q | 3 by default, can be changed with -q |
| Default Number of maximum Hops | 30 | 30 | 30 |
| Options | Limited (-d, -h, -w) | Extensive (-m, -q, -p, etc.) | Extensive (-m, -q, -p, etc.) |
| Continuous Tracing | No | No | No |
| Output Format | Simplified, with basic information | Detailed with packet size, TTL, etc. | Detailed with packet size, TTL, etc. |
| Installation | Built-in (Command Prompt/PowerShell) | Built-in (Terminal) | Typically built-in, installable if missing |
| Customizable Timeout | Yes, with -w (in milliseconds) | Yes, with -W (in seconds) | Yes, with -w or -W (in seconds) |
| Resolve Hostnames | By default | By default, can be disabled with -n | By default, can be disabled with -n |
| IPv4/IPv6 Support | Supports both, uses -4 or -6 to force | Supports both, uses -4 or -6 to force | Supports both, uses -4 or -6 to force |
| Packet Size | Fixed (cannot be changed) | Adjustable with -q | Adjustable with -q |
Limitations of Traditional Traceroute Implementations
There are many scenarios of network configurations and functionalities that can interfere with traditional traceroute implementations. For this reason, the results of a traceroute can be misleading.
Firewalls and Security Appliances
Modern firewalls often filter out or deprioritize ICMP and UDP probes, leading to incomplete paths and significant packet loss. This filtering misleads users into believing there is an issue with the network when, in reality, it might just be the security configurations causing the disruption.
Load Balancing
Load balancing is a network design technique that allows data to traverse a network over multiple paths, thus maximizing the usage of the bandwidth of the available infrastructure. Load balancing can route packets along different paths, further distorting the results shown by traceroute.
Network Address Translation (NAT)
NAT modifies the IP address in the packet header as it passes through a router, making it difficult for traceroute to map the network path accurately. The change in IP addresses can result in misleading traceroute results, as the apparent source or destination IP address may not reflect the true network path.
Additional obstacles to traceroute
Although these are the most common network services and features that can interfere with traceroute, there are still others, including:
- Asymmetric routing, where packets take different paths to and from a destination.
- ICMP rate limiting or throttling can cause ICMP responses to be delayed or dropped, leading to false indications of high latency or packet loss.
- QoS policies are used to prioritize or deprioritize certain types of traffic. The packets used by traceroute may be deprioritized in favor of other traffic types, leading to inaccurate measurements of latency and packet loss
- In virtualized environments or cloud networks, the physical network path might not directly correspond to the virtualized network path that traceroute sees. Additionally, the internal routing within a cloud provider’s infrastructure might not be fully visible to the user, resulting in misrepresented tracereoute results.
These issues have motivated the development of LogicMonitor’s traceroute alternatives that can bypass such obstacles and provide more accurate results. These alternatives are described further below:
LogicMonitor’s Alternative
Traditional traceroute is useful, but it only shows you a single path from a single vantage point at a single moment in time. In modern environments, that can leave out the bigger picture. Users in different regions may experience the same application very differently, and a trace from one machine does not always reflect what everyone else sees.
LogicMonitor helps teams go beyond that one-off troubleshooting model by combining live path analysis with continuous monitoring. With website monitoring and synthetic monitoring, teams can test availability and performance from multiple checkpoints instead of relying on a single local trace. That makes it easier to compare behavior across geographies, spot location-specific issues, and investigate performance problems with more context than a native traceroute alone can provide.
For website monitoring, LogicMonitor also provides a Trace Route view for External Ping Checks. This lets engineers run a live trace route directly in the platform and inspect the hop-by-hop path to a monitored destination, including details such as IP address, hostname, and response time. Instead of switching to a separate troubleshooting tool, teams can investigate path behavior from within the same workflow they use to monitor service health.
That distinction matters. Native traceroute tells you what route packets appear to take right now. LogicMonitor helps you connect that route-level view to the broader service experience by pairing live trace data with continuously collected website performance signals and synthetic monitoring data. The result is a more useful troubleshooting workflow: you can see whether a problem is isolated to one checkpoint, whether response times are degrading across regions, and whether the issue is likely a path anomaly or a real user-impacting service problem.
It is worth noting that LogicMonitor’s trace route data is designed for live troubleshooting and is not stored historically. That means the value is not historical traceroute replay. The value is being able to investigate a path issue in real time while also using synthetic monitoring and website monitoring to provide the surrounding operational context.
In practice, that gives teams a better alternative to relying on occasional manual traceroutes. LogicMonitor shifts the workflow from isolated diagnosis to ongoing validation. Synthetic checks can run automatically against critical services, website monitoring can surface response time data by checkpoint, and live trace route can help engineers dig deeper when they need to understand where latency or failures begin.
Understanding LogicMonitor’s Website and Synthetic Monitoring Approach
LogicMonitor approaches path troubleshooting as part of a larger service monitoring strategy. Instead of relying only on manual tools run from a single machine, the platform lets teams configure website checks and synthetic monitoring that continuously test critical destinations and workflows. That makes it easier to detect changes in availability, response time, and user experience before those issues become broader incidents. This broader approach also aligns with LogicMonitor’s own perspective on continuous network monitoring rather than isolated spot checks.
For website monitoring, LogicMonitor supports live trace route troubleshooting for External Ping Checks. This gives engineers a way to inspect the hop-by-hop path to a destination directly in the platform, including details such as hop IPs, hostnames, and response times. Used alongside checkpoint-based website monitoring data, that trace route view can help teams investigate whether latency or failures are tied to a particular path segment or are part of a broader service issue.
The bigger advantage is operational context. Native traceroute can show a path, but it doesn’t continuously validate business-critical services from multiple locations. LogicMonitor’s monitoring model does. By automating checks and exposing response time data by checkpoint, the platform helps teams see patterns across geographies and over time, which is often more useful than a single local trace.
Looking More Closely at Live Trace Route in LogicMonitor
LogicMonitor’s live Trace Route feature is best understood as a troubleshooting aid, not a replacement for every network diagnostic tool. When you need to investigate a monitored website or endpoint, it provides a direct view of the hops between the source and destination. That is useful when a check is failing, response times are climbing, or you need quick visibility into the route being taken.
Where it becomes more valuable than a standalone command-line trace is in the surrounding context. Because LogicMonitor also collects website monitoring and synthetic monitoring data, engineers can compare route-level behavior against availability checks, response time metrics, and checkpoint-specific results. In practice, that means you are not looking at a trace in isolation. You are interpreting it in the context of how the monitored service is actually performing.
There are limits, of course. The trace route data is live only and is not retained as historical telemetry. But for active troubleshooting, it provides a useful bridge between path inspection and continuous service monitoring. That combination is what makes the LogicMonitor approach stronger than relying on occasional manual traceroutes alone.
Get More Than a Point-in-Time Trace
Native traceroute tools on Windows, Linux, and macOS are still valuable for quick diagnostics. They help you identify the route to a destination, spot obvious latency jumps, and understand where connectivity may be breaking down. But in modern environments, that is only part of the story.
LogicMonitor helps teams go further by pairing live path troubleshooting with continuous monitoring. With website monitoring and synthetics, you can test critical services automatically, compare performance from multiple checkpoints, and investigate issues with more operational context. When a path needs closer inspection, the platform’s live Trace Route view gives you a direct way to analyze hops without leaving the monitoring workflow.
The result is a more useful approach to troubleshooting: less guesswork, more repeatability, and better visibility into the difference between a one-off path anomaly and a real user-impacting performance problem. That is the real alternative to traditional traceroute—not just another way to run a trace, but a better way to understand network and service behavior in context. That framing also lines up with LogicMonitor’s broader view of how network monitoring works and the value of executing synthetic transactions.
(Legacy content)
LogicMonitor has developed several alternatives to overcome the limitations of traditional traceroute, leveraging the TCP protocol to avoid filtering by firewalls and mitigate issues with load balancers. One such tool is Traceroute InSession, designed to establish a complete TCP session between the source and the destination before performing the traceroute. This method ensures firewalls see the probes as part of a legitimate, established session, allowing the traceroute to bypass most security filters.
Another key innovation is the use of Selective Acknowledgment (SACK), which improves the accuracy of tracing by allowing the mapping of returning ACKs (Acknowledgements) to the original probes. This technique, inspired by tools like tracebox, enables more precise tracking of the route by overcoming issues caused by out-of-order packet delivery. LogicMonitor’s enhancements also include an initial sequential TCP ping, which helps to differentiate between real packet loss and delayed ACKs, further refining the accuracy of the traceroute results.
Understanding Pietrasanta Traceroute
Pietrasanta Traceroute, another LogicMonitor innovation, was developed to meet the growing demands of modern network monitoring. Named after the Italian town where the team developed it, this tool is an evolution of traditional traceroute, specifically designed to address the challenges posed by firewalls and load balancers. Originally built for Linux, Pietrasanta Traceroute is now available on Windows through the Windows Subsystem for Linux (WSL), making it accessible to a broader user base.
Pietrasanta Traceroute provides several advantages over traditional traceroute tools. It is faster, more versatile, and supports multiple protocols including UDP, TCP, and QUIC, which helps in clearer path identification. One of its standout features is the TCP InSession traceroute, which prevents false packet loss by simulating actual application packet traffic. This makes it an invaluable tool for troubleshooting and analyzing network paths, especially in environments with complex security configurations.
Moreover, Pietrasanta Traceroute offers advanced capabilities such as ECN and L4S analysis for assessing network congestion and throughput. These features are crucial for modern networks, where performance and reliability are key. The tool also includes improvements in path MTU performance and hop-by-hop ToS/DSCP reporting, making it a comprehensive solution for network diagnostics.
Looking More Closely at TCP InSession Traceroute
The TCP InSession traceroute is a significant advancement in network diagnostics. Unlike traditional TCP traceroute, which uses SYN packets that could be interpreted as part of a SYN flood attack by firewalls, TCP InSession traceroute first establishes a legitimate TCP connection with the destination. It then sends small data packets with incrementing TTLs within this session, ensuring that the probes are perceived as regular traffic rather than a potential threat.
This method offers several advantages. First, because the probes belong to an established session, they are more likely to traverse the same network path, reducing the variability introduced by load balancers. This consistency provides a clearer and more accurate map of the network route. Second, by sending only one SYN packet per session, the TCP InSession traceroute minimizes the risk of being blocked by firewall protection rules, which is a common issue with other traceroute techniques.
However, there are some drawbacks that should be considered. The primary limitation is that TCP InSession requires an application to actively listen on the destination port to establish a TCP session. This means that it cannot be used to trace routes to destinations where no service is running on the targeted port. Despite this, TCP InSession traceroute remains a powerful tool for network engineers, offering a reliable and secure way to diagnose network paths in environments where traditional traceroute methods fall short.
Get started with Cathpoint’s Traceroute today
While the native traceroute tools available on Windows, Linux, and macOS provide a useful starting point for diagnosing network paths and identifying potential issues, they are increasingly limited by modern network complexities. These limitations can lead to misleading results, making it difficult for network engineers to diagnose and troubleshoot problems accurately.
LogicMonitor’s enhanced traceroute solutions, including Pietrasanta Traceroute and TCP InSession Traceroute, offer significant improvements over traditional methods. By leveraging advanced techniques, these tools provide a more accurate and reliable picture of network performance. They are particularly effective in environments where security measures and network policies interfere with standard traceroute results.
While it is advisable to use the native traceroute capabilities for basic diagnostics, for more precise and dependable analysis, especially in complex or highly secured network environments, LogicMonitor’s alternatives are a superior choice. These tools enable network professionals to navigate the intricacies of modern networks and ensure a clearer understanding of network paths, ultimately leading to more effective troubleshooting and optimized network performance.
Further reading:
- Traceroute InSession:
LogicMonitor’s effort towards a more reliable network diagnostic tool. - Traceroute InSession:
A traceroute tool for modern networks.
GitHub project:
LogicMonitor’s Pietrasanta traceroute.
CHAPTERS
- Network admin’s guide to synthetic monitoring
- Internet Exchange Point
- IT Transit
- The Benefits and Challenges of SD-WAN Architecture
- Free Online Network Tools Every Engineer Should Bookmark
- SD-WAN vs MPLS
- MQTT Broker
- Inter-VLAN Routing
- DNS Sinkhole
- How to Read a Traceroute
- Switching Loops
- SD-WAN Security
- IP Multicast
- DNS Tunneling
NEWSLETTER
Subscribe to our newsletter
Get the latest blogs, whitepapers, eGuides, and more straight into your inbox.
SHARE
Turn traceroute into a continuous monitoring capability.
LogicMonitor’s synthetic monitoring runs automated path tests from distributed nodes, giving you a continuous traceroute-like view of your network paths.
FAQs
What does traceroute show?
Traceroute shows the sequence of network hops a packet takes from your machine to a destination host. For each hop, it displays the IP address or hostname of the router and the round-trip time (RTT) for packets sent to that router.
How do you interpret asterisks (*) in a traceroute?
Asterisks appear when a router does not send an ICMP Time Exceeded response. This does not mean the router is down, many routers deprioritize ICMP TTL-exceeded messages for security reasons while still forwarding actual traffic normally.
What does high latency at a specific hop mean?
High RTT at a specific hop often indicates congestion or routing inefficiency. However, some routers artificially inflate RTT for traceroute probes. Compare the latency of subsequent hops: if they return to lower values, the high-latency hop may not be the actual bottleneck.
What is the difference between traceroute and ping?
Ping tests connectivity and round-trip time to a single destination. Traceroute shows each hop along the path with individual RTT measurements, allowing you to pinpoint where latency is introduced or where connectivity fails.
© LogicMonitor 2026 | All rights reserved. | All trademarks, trade names, service marks, and logos referenced herein belong to their respective companies.