
Blue Coat Proxy
Monitor Blue Coat Proxy devices with LogicMonitor and consolidate oversight of your entire infrastructure into a single application.
LogicMonitor automatically detects and monitors:
- all attack types the proxy detects
- physical disk state
- proxy statistics: requests per second, hit rate, service time, active and idle connections and more
- all traffic sent/received at the interface level (packets/bps)
- CPU and memory statistics
- all environmental sensors and their alarm status and reported values
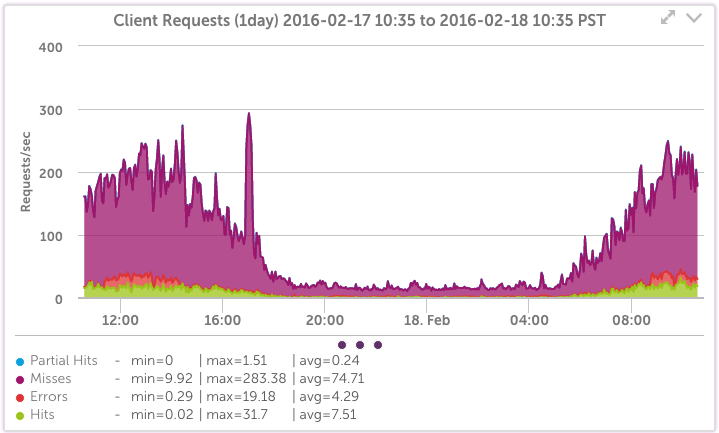
Proxy Client Requests
Quantify usage and request rate in one place. Compare the hit rate and miss rate from clients to the proxy, as well as correlate with CPU, memory load, and more. Be alerted to issues in any of these resources.
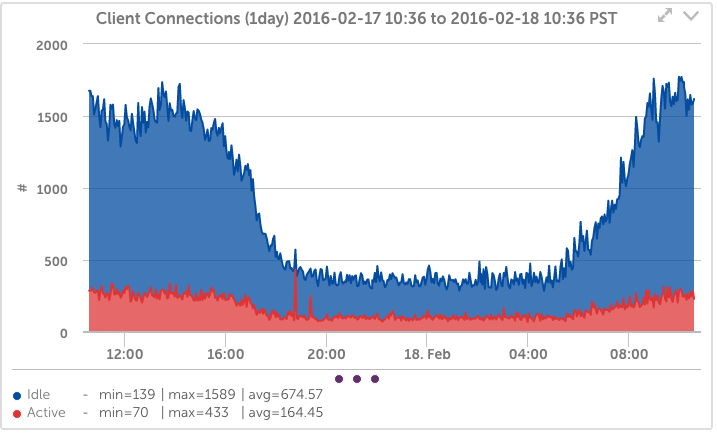
HTTP Connections
Easily track the active and idle connections between clients and the Blue Coat Proxy, and the proxy and the servers.
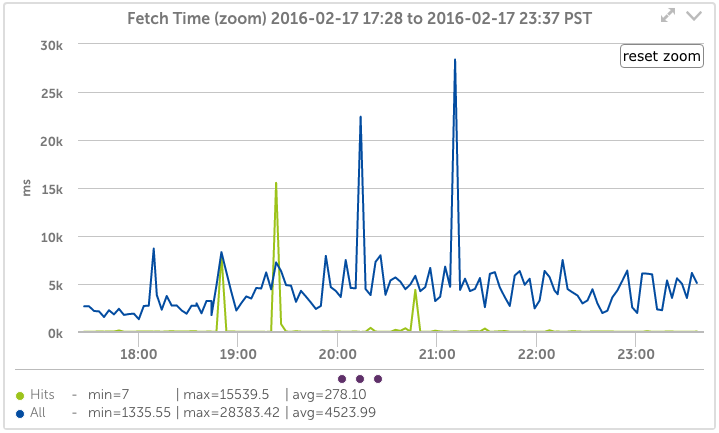
Proxy Fetch times
Want to know how quickly the proxy is responding for hits? For misses? This is easy to see with LogicMonitor, so you can tell at a glance if you are having resource limitations in the proxy or the back end servers.
Keep your ProxySG running
Turning on policies? Compression? Integrated Caching? LogicMonitor will detect it, monitor it, alert you to issues, and trend the performance metrics of the feature – all automatically.
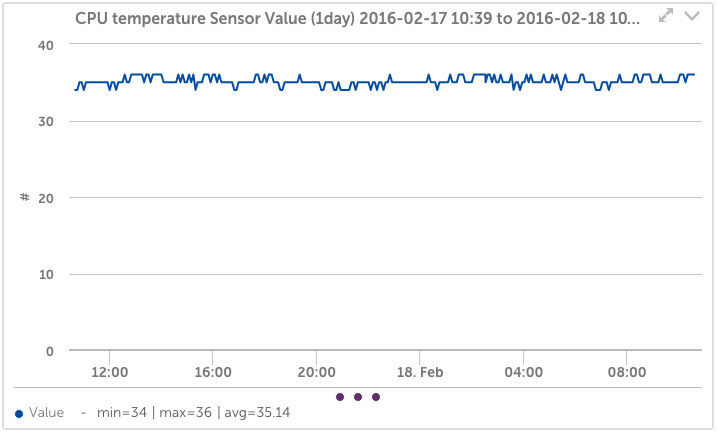
Be alerted to any hardware issues in your Blue Coat Proxies. Automatically. LogicMonitor detects all the sensors, hard drives, and fans, collects the data and alerts you to any issues- before your customers know. And much more!