IBM AIX
IBM AIX servers are often large, complex systems at the heart of an enterprise. They may have many disks, many paging spaces, and applications that are essential to keep running.
With LogicMonitor, monitoring your AIX servers is as easy as entering the hostname. LogicMonitor will discover the kind of server, operating system, file systems, applications on the server, and everything else needed to provide comprehensive monitoring. Automatically.
Just a few of the metrics we use to monitor AIX:
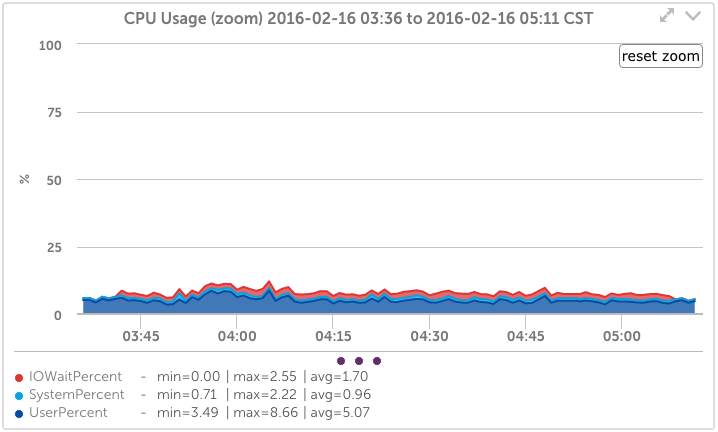
AIX CPU Usage
Trending and alerting on CPU usage is essential. LogicMonitor comes with predefined alert thresholds, but lets you tune them on a global, group, or device level. You can also zoom into any period of time for the last year.
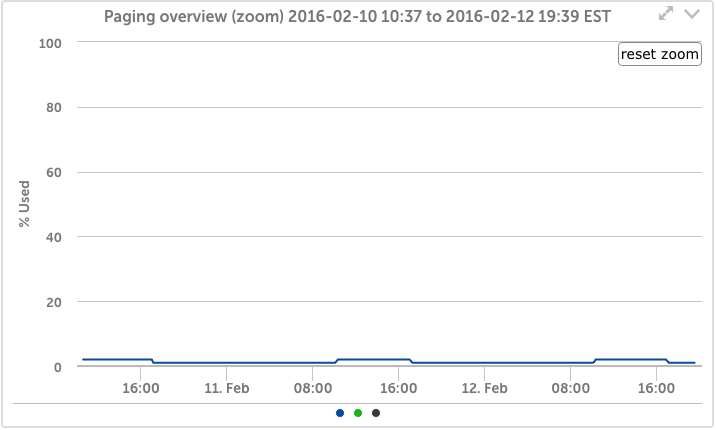
AIX Paging Space Usage
Keeping paging space usage under control is essential for the performance of AIX systems. LogicMonitor will automatically detect all paging spaces in use – even discovering new ones as you add them – and present both with an automatic overview, plus individual usage graphs. LogicMonitor, of course, also alerts you to any issues of overuse.
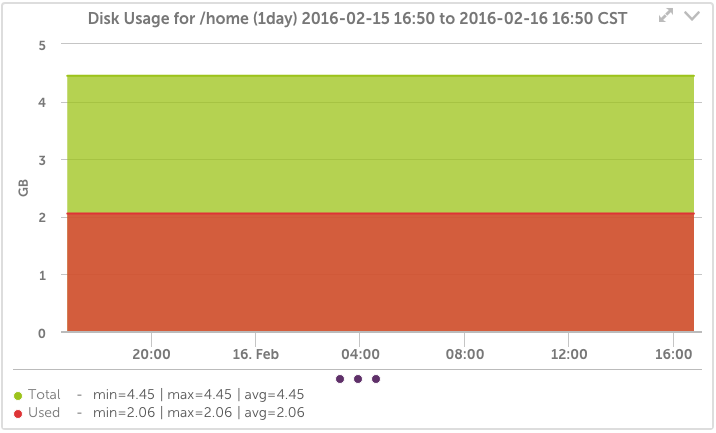
AIX Disk Usage
No matter how many file systems you have on your system, LogicMonitor will detect them, monitor them, and alert you to issues. Automatically. There’s much more that LogicMonitor will automatically detect, monitor, and alert on – memory usage, NTP synchronization, database performance, and more.