With the wealth of features and capabilities in switches nowadays, configuring comprehensive monitoring is not a trivial or quick task- unless you’re using LogicMonitor. If you are, configuring comprehensive monitoring for Force 10 switches consists of entering the hostname. That’s it.
LogicMonitor will then automatically detect and monitor:
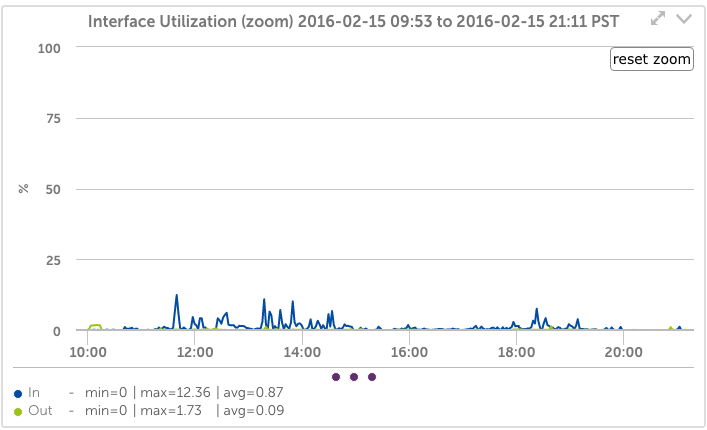
- all active interfaces
- all BGP sessions
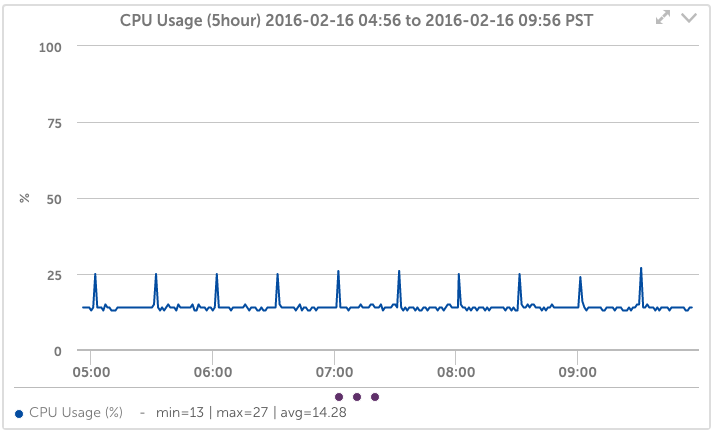
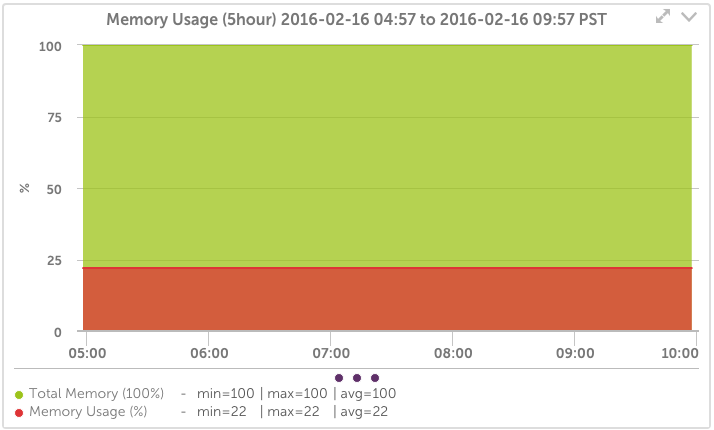
- all CPUs, Memory Pools, temperature sensors
- all modules and cards, and their respective CPU and memory.
- PoE, VoIP specific features
- the status of stacked switches, and the stack communication status
- and more
All with no effort on your part and all kept up to date automatically.
Just a few of the critical Force10 switch metrics we monitor:
Interface Traffic
Fundamental for every monitoring system, yet LogicMonitor even does this better. LogicMonitor automatically tracks bps, packets per second, as well as discards, errors, and queuing. It also allows the trending of data from the last few minutes up to a year ago.
Force10 Switch stacked performance
When you stack your switches for management simplicity, LogicMonitor doesn’t force you to sacrifice that simplicity in your monitoring. LogicMonitor will automatically detect stacked units and monitor each for CPU, memory, fans, power supplies, stack synchronization issues, and more.