
Hewlett Packard P4000
LogicMonitor includes support for monitoring technologies from HP. We include LogicModules out-of-the-box that monitor critical HP performance metrics to build out dashboards that show the data critical to your IT Operations.
HP P4000 Monitoring
HP’s P4000 SAN scales in capacity and performance by adding new storage nodes – but with LogicMonitor, that doesn’t mean the monitoring scales in complexity. With no configuration, LogicMonitor will give you complete P4000 monitoring, trending and alerting, including:
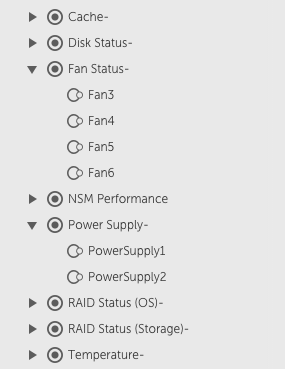
- extensive health checks of every storage node: from fans and temperature to RAID and replication status
- performance of every node: data rates, IO rates, and node latency
- monitoring of every single disk, including SMART status, in the cluster
- cluster wide statistics and performance
- network, memory and CPU loads
- much more
A few of the critical metrics LogicMonitor’s P4000 monitoring gives you:
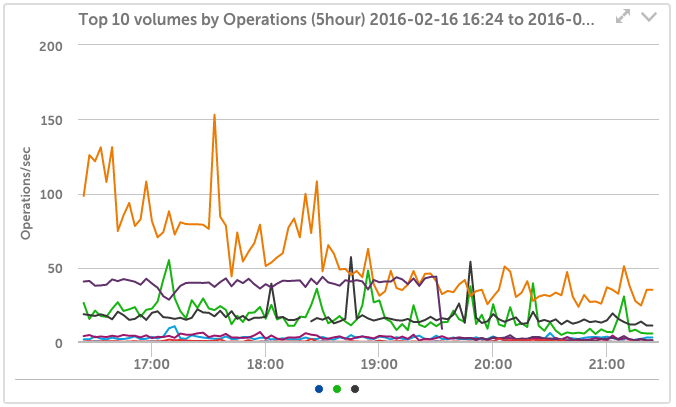
P4000 Volume Operations
LogicMonitor will show you all the volumes in your LeftHand cluster as well as trend the read and write operations per second. It also automatically constructs real time graphs for any period of time showing the top 10 volumes by total operations, and by space used – vital information if you are trying to resolve a slowdown or plan your next cluster expansion.
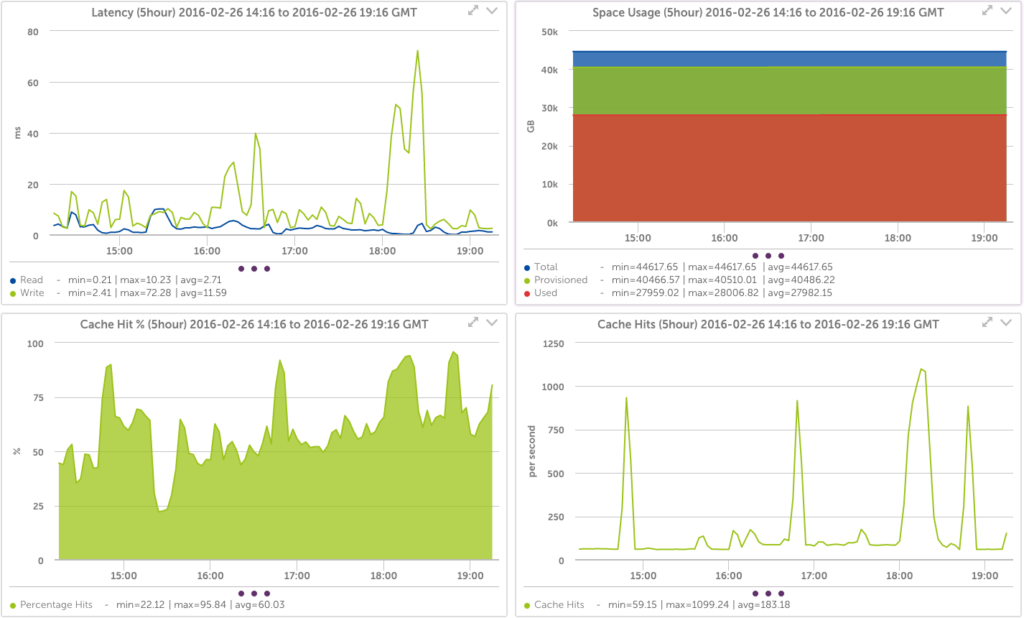
P4000 Volume Performance
You can easily dive down into individual volume’s performance, so you know immediately if your SAN is – or is not – responsible for application performance issues. Of course, LogicMonitor’s best practice alerts would have warned you if there were latency issues, but being able to see trends of latency, IO operations, provisioned space and more, for all volumes for any time frame helps with problem resolution.
P4000 Health Monitoring
One of the difficulties with fault tolerant systems is that failures can be masked – things keep working fine – until the second failure, when everything stops. That won’t happen with LogicMonitor. It will automatically discover and monitor all components, and alert you when things go wrong. Be confident your hardware is working as it should.
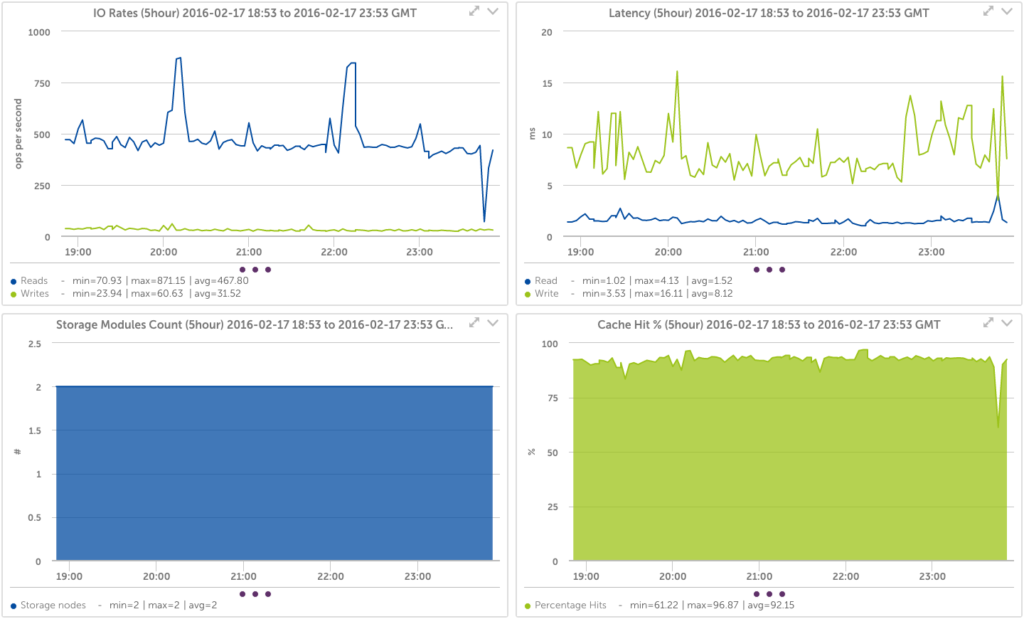
P4000 Cluster Wide Monitoring
Get a bird’s eye view of your whole cluster’s performance, with graphs of IO rates, latency, space usage, and more – for any period from 1 year to the last 5 minutes. Get alerts if any manager is down, affecting the cluster quorum, and more.
Your SAN doesn’t work alone. That’s why LogicMonitor lets you easily monitor not just your P4000 SAN, but also the network carrying the iSCSI and the servers and applications that rely on the SAN – so you have a single place to look when you need to resolve issues.