
Microsoft Exchange
Microsoft Exchange Server is a mail server and calendaring server developed by Microsoft. It runs exclusively on Windows Server operating systems.
Monitoring the effectiveness of your Microsoft Exchange server is critical for ensuring that information can flow freely inside your company – and to your clients and customers.
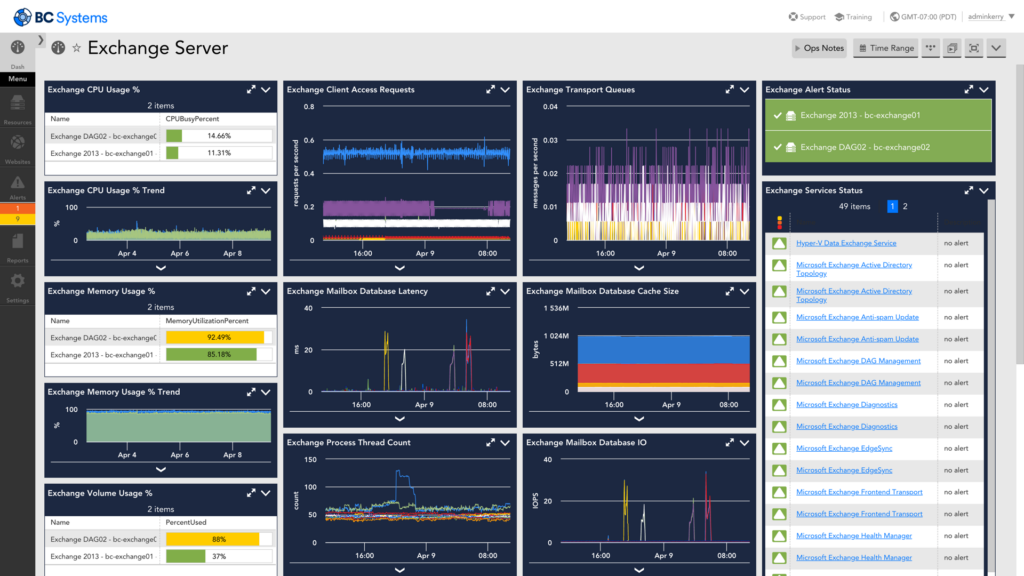
LogicMonitor includes out-of-the-box monitoring of Microsoft Exchange. LogicModules monitor critical Microsoft Exchange performance metrics to build out dashboards that show the data critical to your IT Operations.
Determine and monitor mailbox capacity constraints, user activity, exchange queues, connections, and more.
Fast, Easy, and Painless
The automatic detection and monitoring of Microsoft Exchange Servers decreases deployment time and with the out-of-the-box dashboards, you will have insights to your environment like never before.
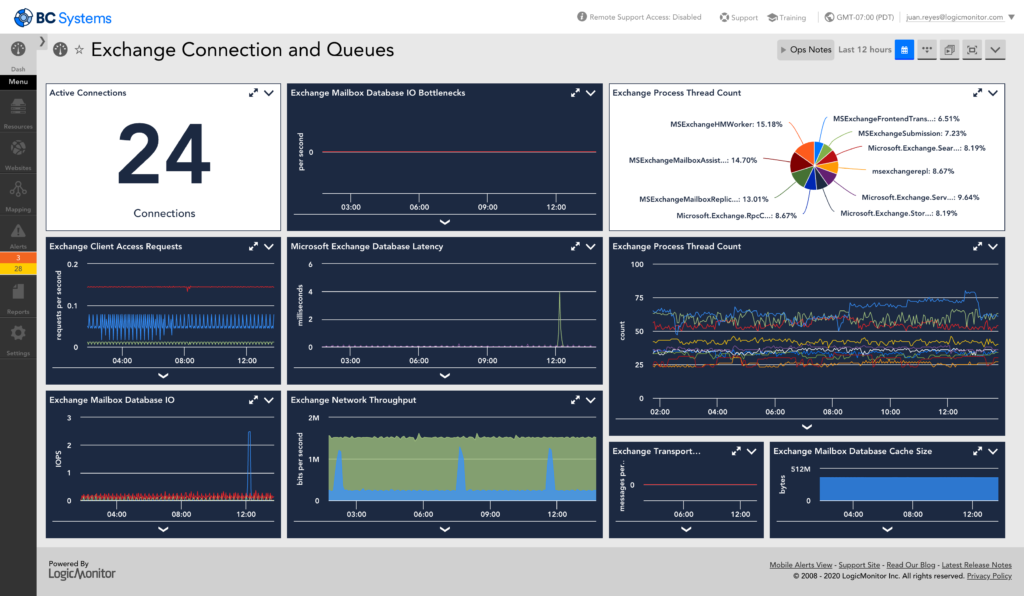
Monitoring Queues and Connections
A growing connections queue is a particular sign of concern. Properly monitoring queues and connections will provide for early identification of bottlenecks such as spamming, blockages, and performance degradation. Dynamic Thresholds can alert you on anomalous behavior – not picked up by rule-based alert thresholds.
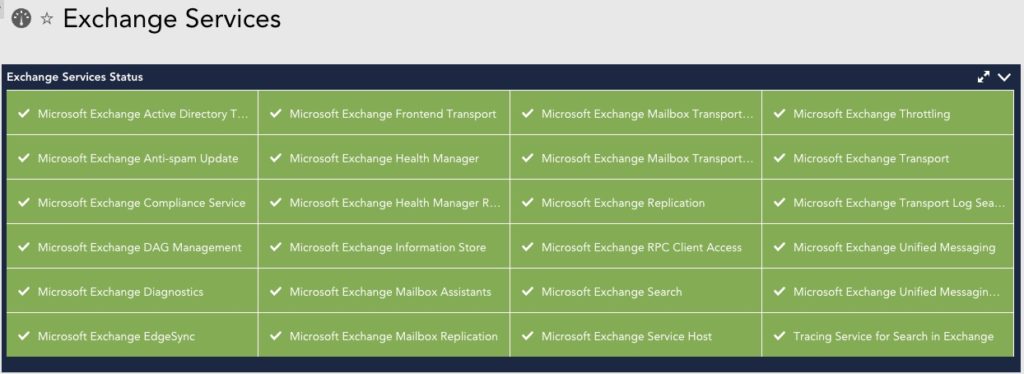
Exchange Services Monitoring
Ensure high availability by tracking and monitoring the Windows Services related to your Exchange Server. Out of the box dashboards show all of your Exchange Services in a single display, allowing you to surface irregularities across your environment.
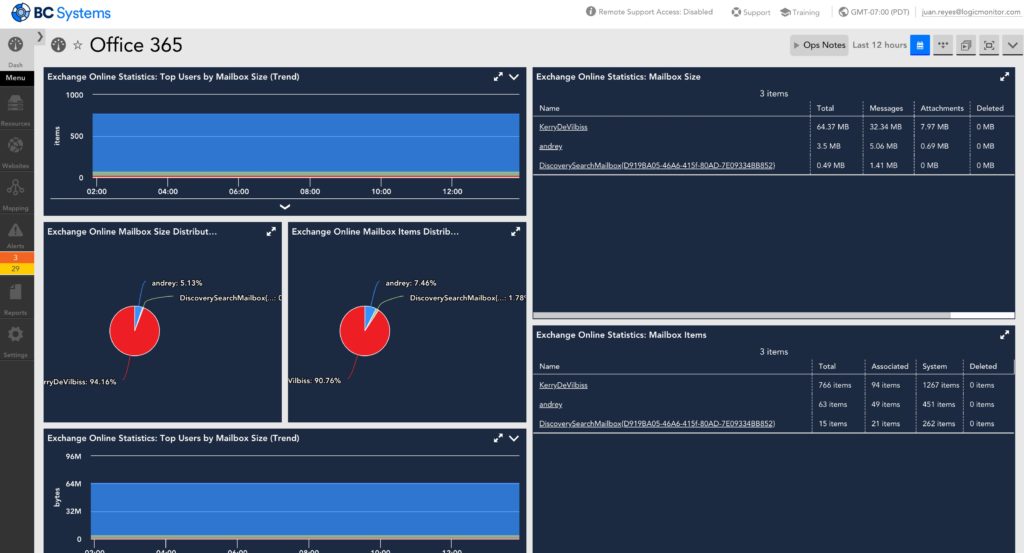
Support for Exchange Online
LogicMonitor covers your Exchange needs whether on-premise or cloud. With this hybrid coverage, you can monitor your company’s transition with ease.
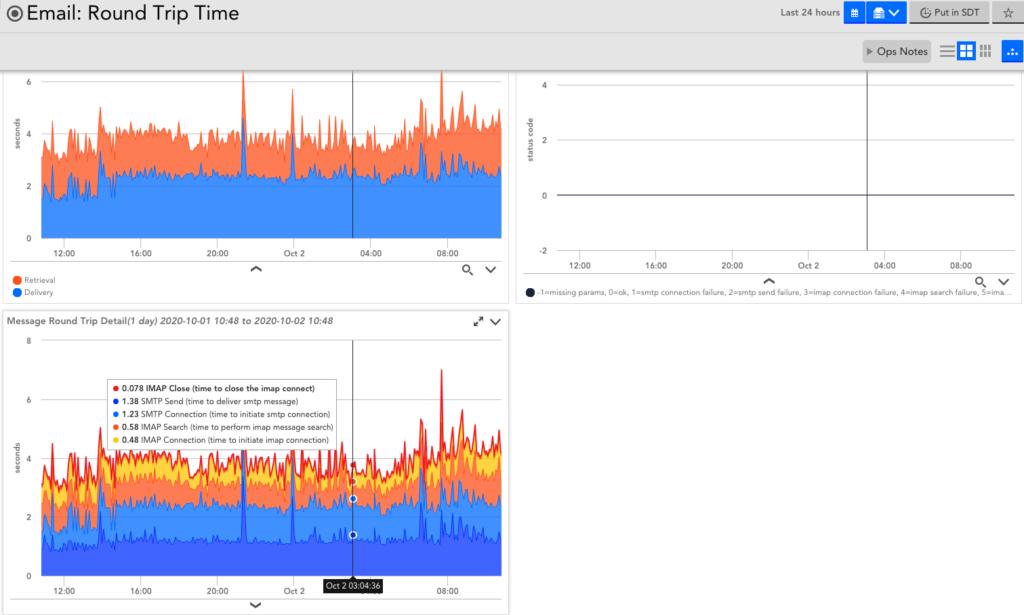
Measure true SMTP and IMAP duration.
Use the LogicMonitor Collector to test the true status and performance of your mail services. Whether on-premise or in the Cloud, the Collector can test the status and latency of your SMTP service, message store, and IMAP service.
Setup:
LogicMonitor is easy to set up: just type in your server hostname, and the software takes care of the rest automatically. There’s no need for you to spend hours (or days) becoming an Exchange monitoring expert.
Similar & Related Integrations
Office 365 Exchange
Microsoft SQL Server
Microsoft Windows Server
Other Resources
Available LogicModules
Client Access Server role stats
- ActiveSync Operations
- ActiveSync Request Time
- AS requests waiting to be assigned a thread
- ASP Requests Wait Time
- ASP.NET stats
- Availability Service
- OWA Latency
- OWA Requests
- OWA Users
- Web Services Connections
- Web Services Operations
Monitoring the performance of an Exchange Edgetransport Database, including latency, reads and writes, cache and log information
- Cache Hits
- Cache Size
- Database I/O
- I/O Bottlenecks
- Latency
Monitoring the details of an Exchange Edgetransport Database, including IO statistics, log details and DB version
- Database Instances IO
- Database Latency
- Log Instances IO
Monitoring details of the Exchange mailbox DB, including latency, IO speeds, and log threads
- Database Instances IO
- Database Latency
- Log Instances IO
Monitoring details of the Exchange mailbox DB, including latency, IO speeds, and log threads
- Cache Hits
- Cache Size
- Database I/O
- I/O Bottlenecks
- Latency
Monitoring details of the Exchange mailbox, including messages queued and sent, virus scan details, delivery time and more
- Client Throttling
- Connections
- Message Delivery Time
- Message Rate
- Messages Queue
- RPC Latency
- RPC Operations
- RPC Requests
- Search Performance
- User Count
Monitoring details of the Exchange replication process, including queue length and seeding details
- Queues
- Seeding Status
Performance and statistics counters for monitoring Exchange 2010 Unified Messaging Role
- Ave Call Duration
- Call Answering Calls
- Total Calls
- User Response Latency
Monitors logical drive details under Windows — disk reads and writes, idle time, queue lengths
- Activity for physical disk instance
- Disk Latency for instance
- IOs for physical disk instance
- Queue for physical disk instance
- Disk throughput for instance
Monitor the resource usage of Exchange Processes
- CPU
- Instance Data Throughput
- Process Memory
- Thread count