Storage Monitoring
LogicMonitor automatically discovers to-the-minute details of industry-leading storage systems. Maintain high-availability with a single unified view for storage monitoring, alerting, and graphing the health and performance of traditional on-premises, hyper-converged, and cloud-based storage systems.
Out-of-the-box storage monitoring for industry-leading solutions, including:

What is storage monitoring?
Storage monitoring tracks the availability, health, and performance of the physical, virtual and cloud storage systems that your business depends on. Data storage is a central component of every IT infrastructure. Because storage devices are prone to failure, monitoring them is crucial to ensure end-user success and overall business continuity.
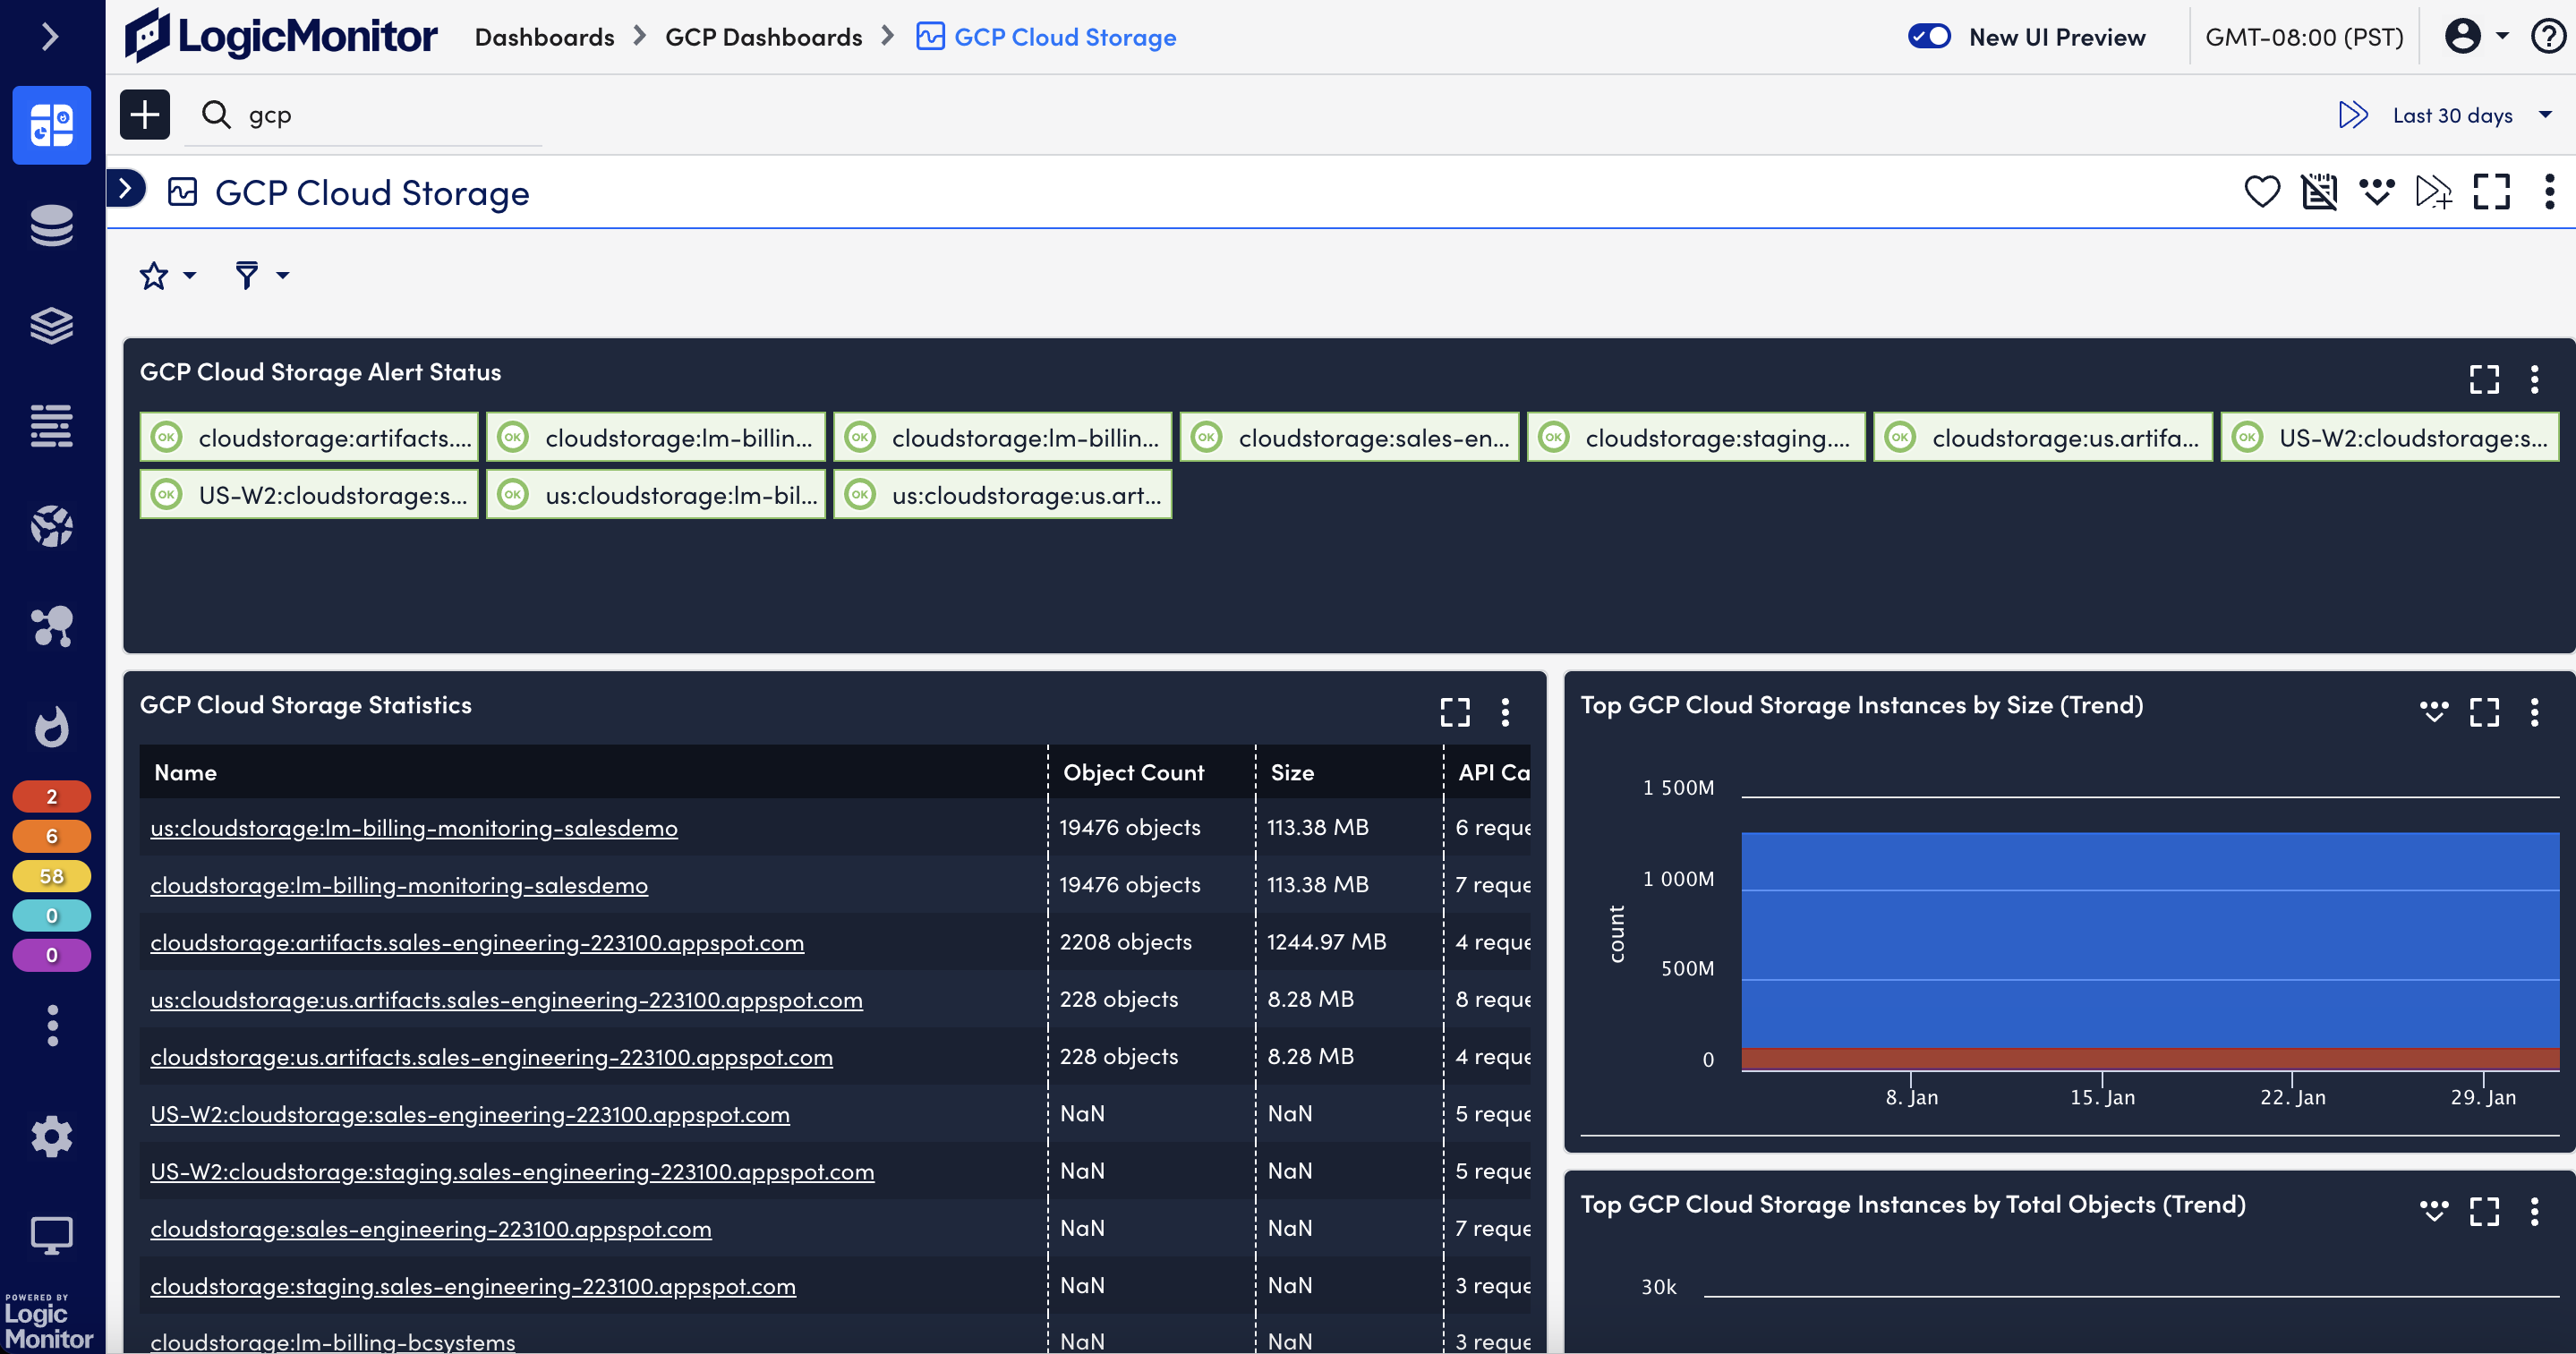
Cloud storage systems
Hyper-converged and virtualized storage systems
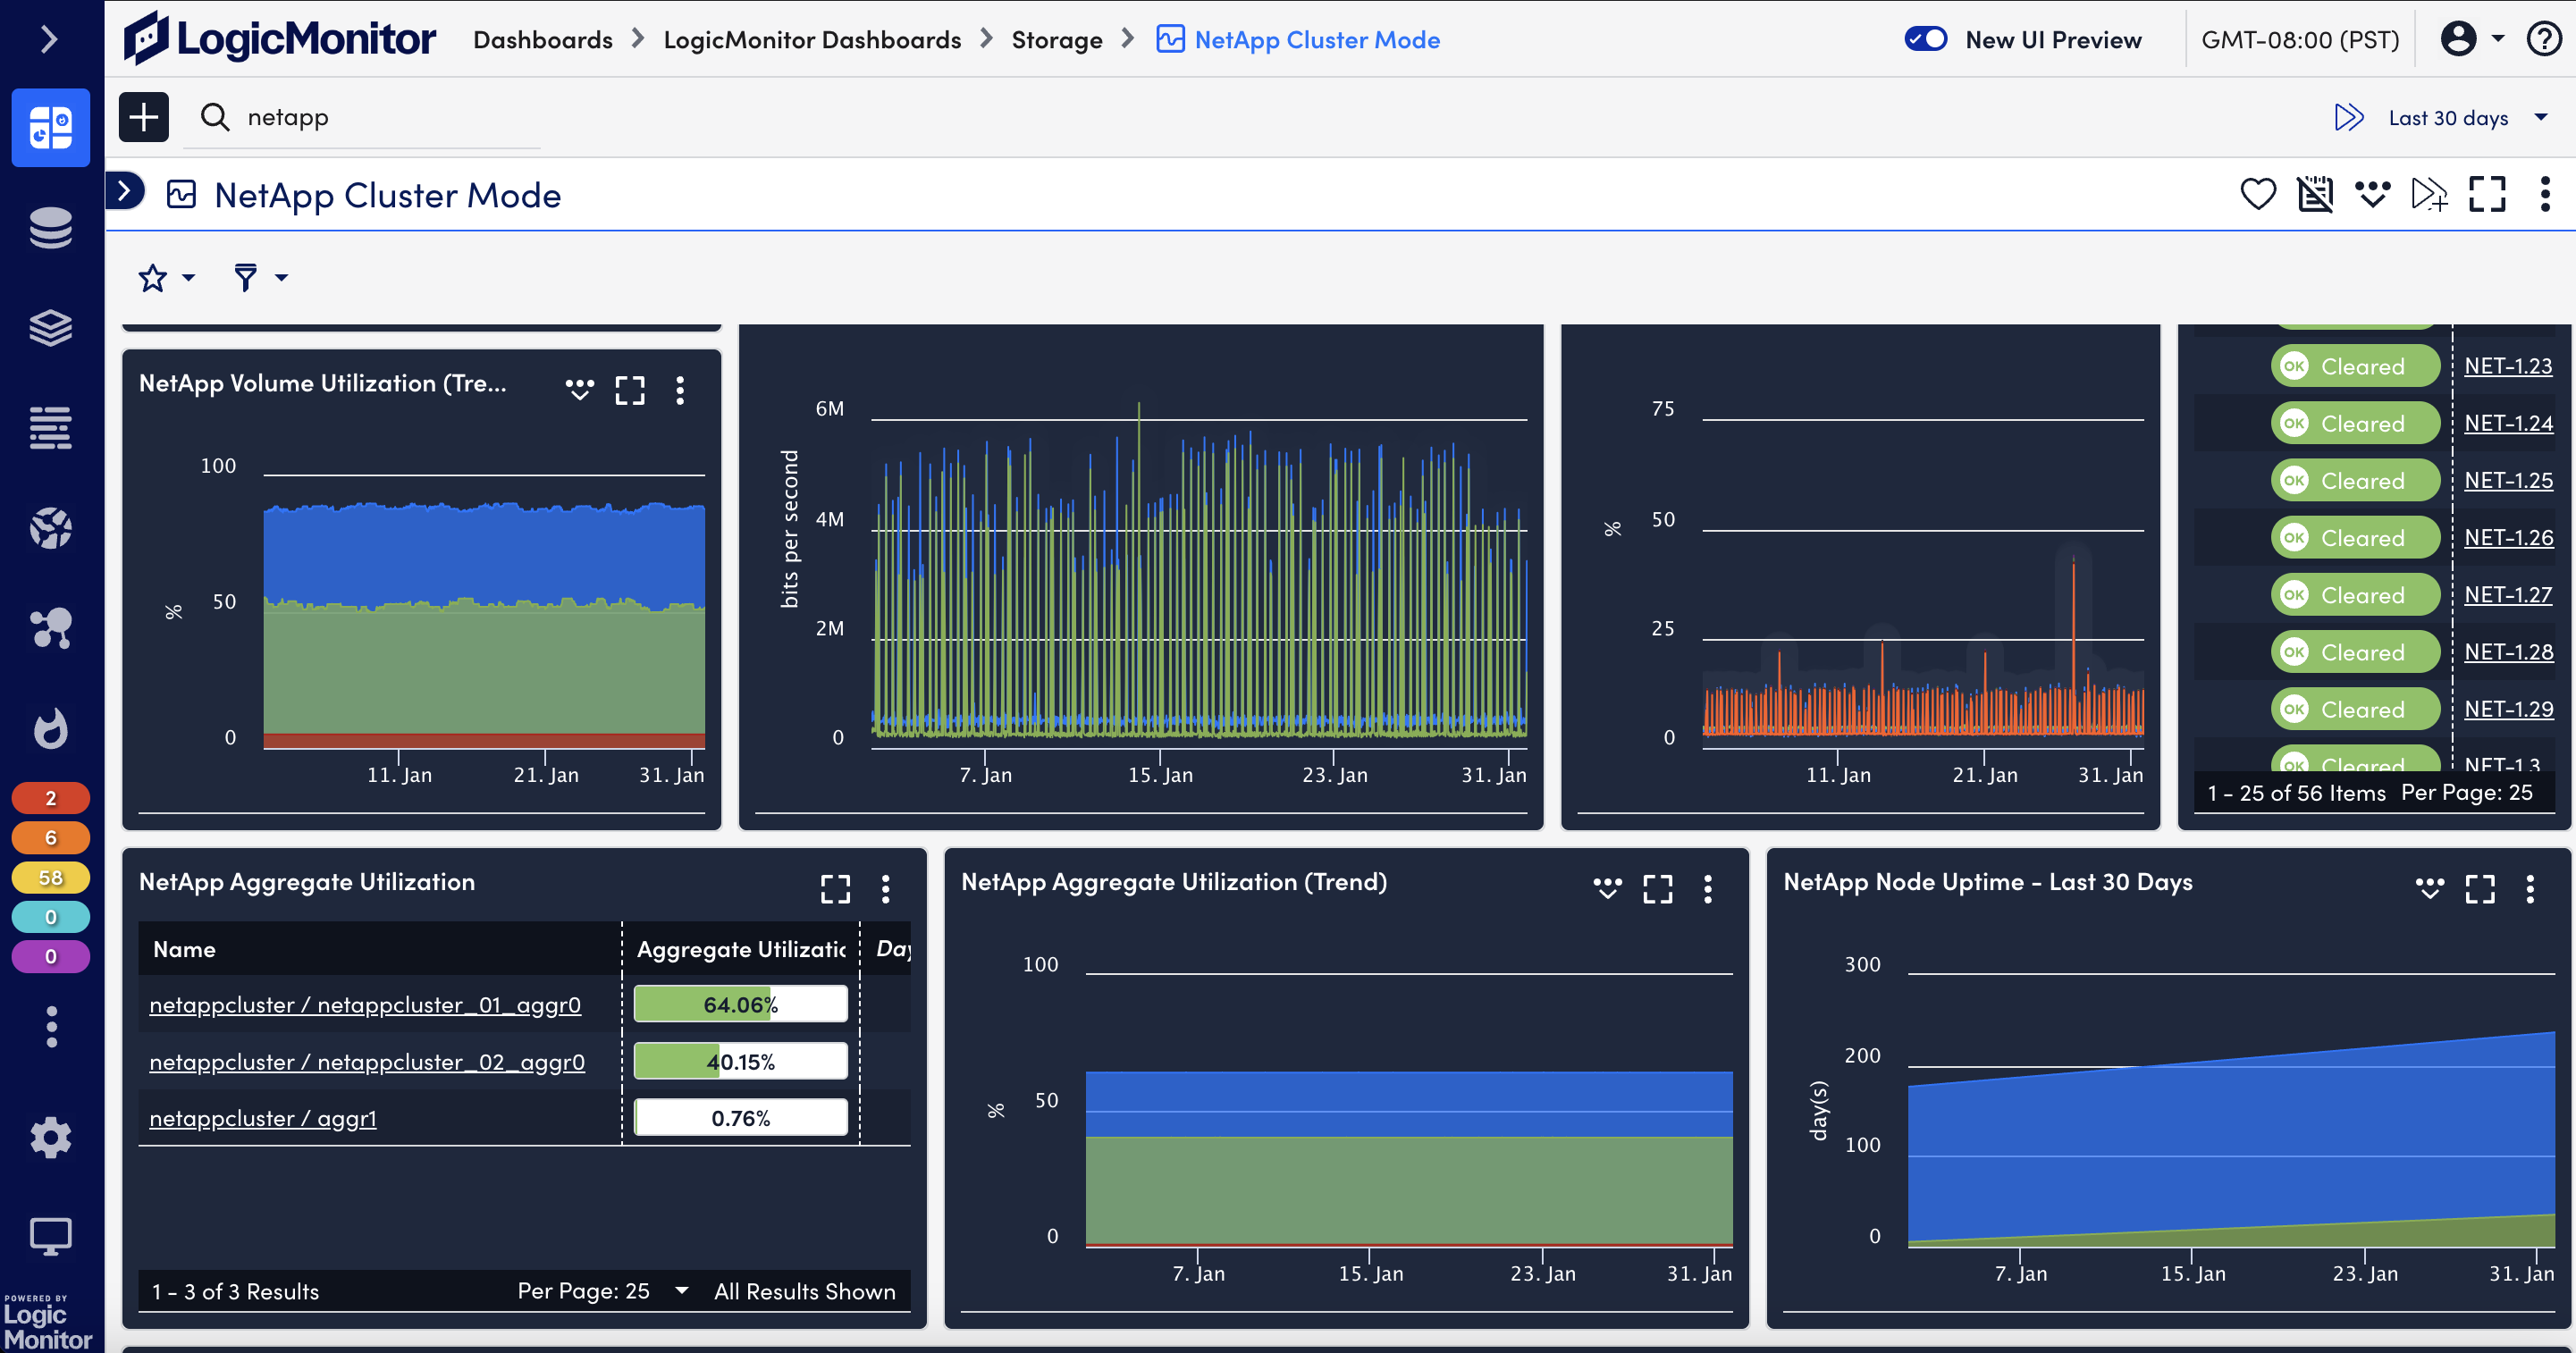
Traditional storage systems
Proactive insight into storage systems for high availability
Get proactive. Combining historical trends with best-practice thresholds to monitor key metrics like capacity, IOPS, disk space, and latency allows you to prevent issues instead of reacting to them.
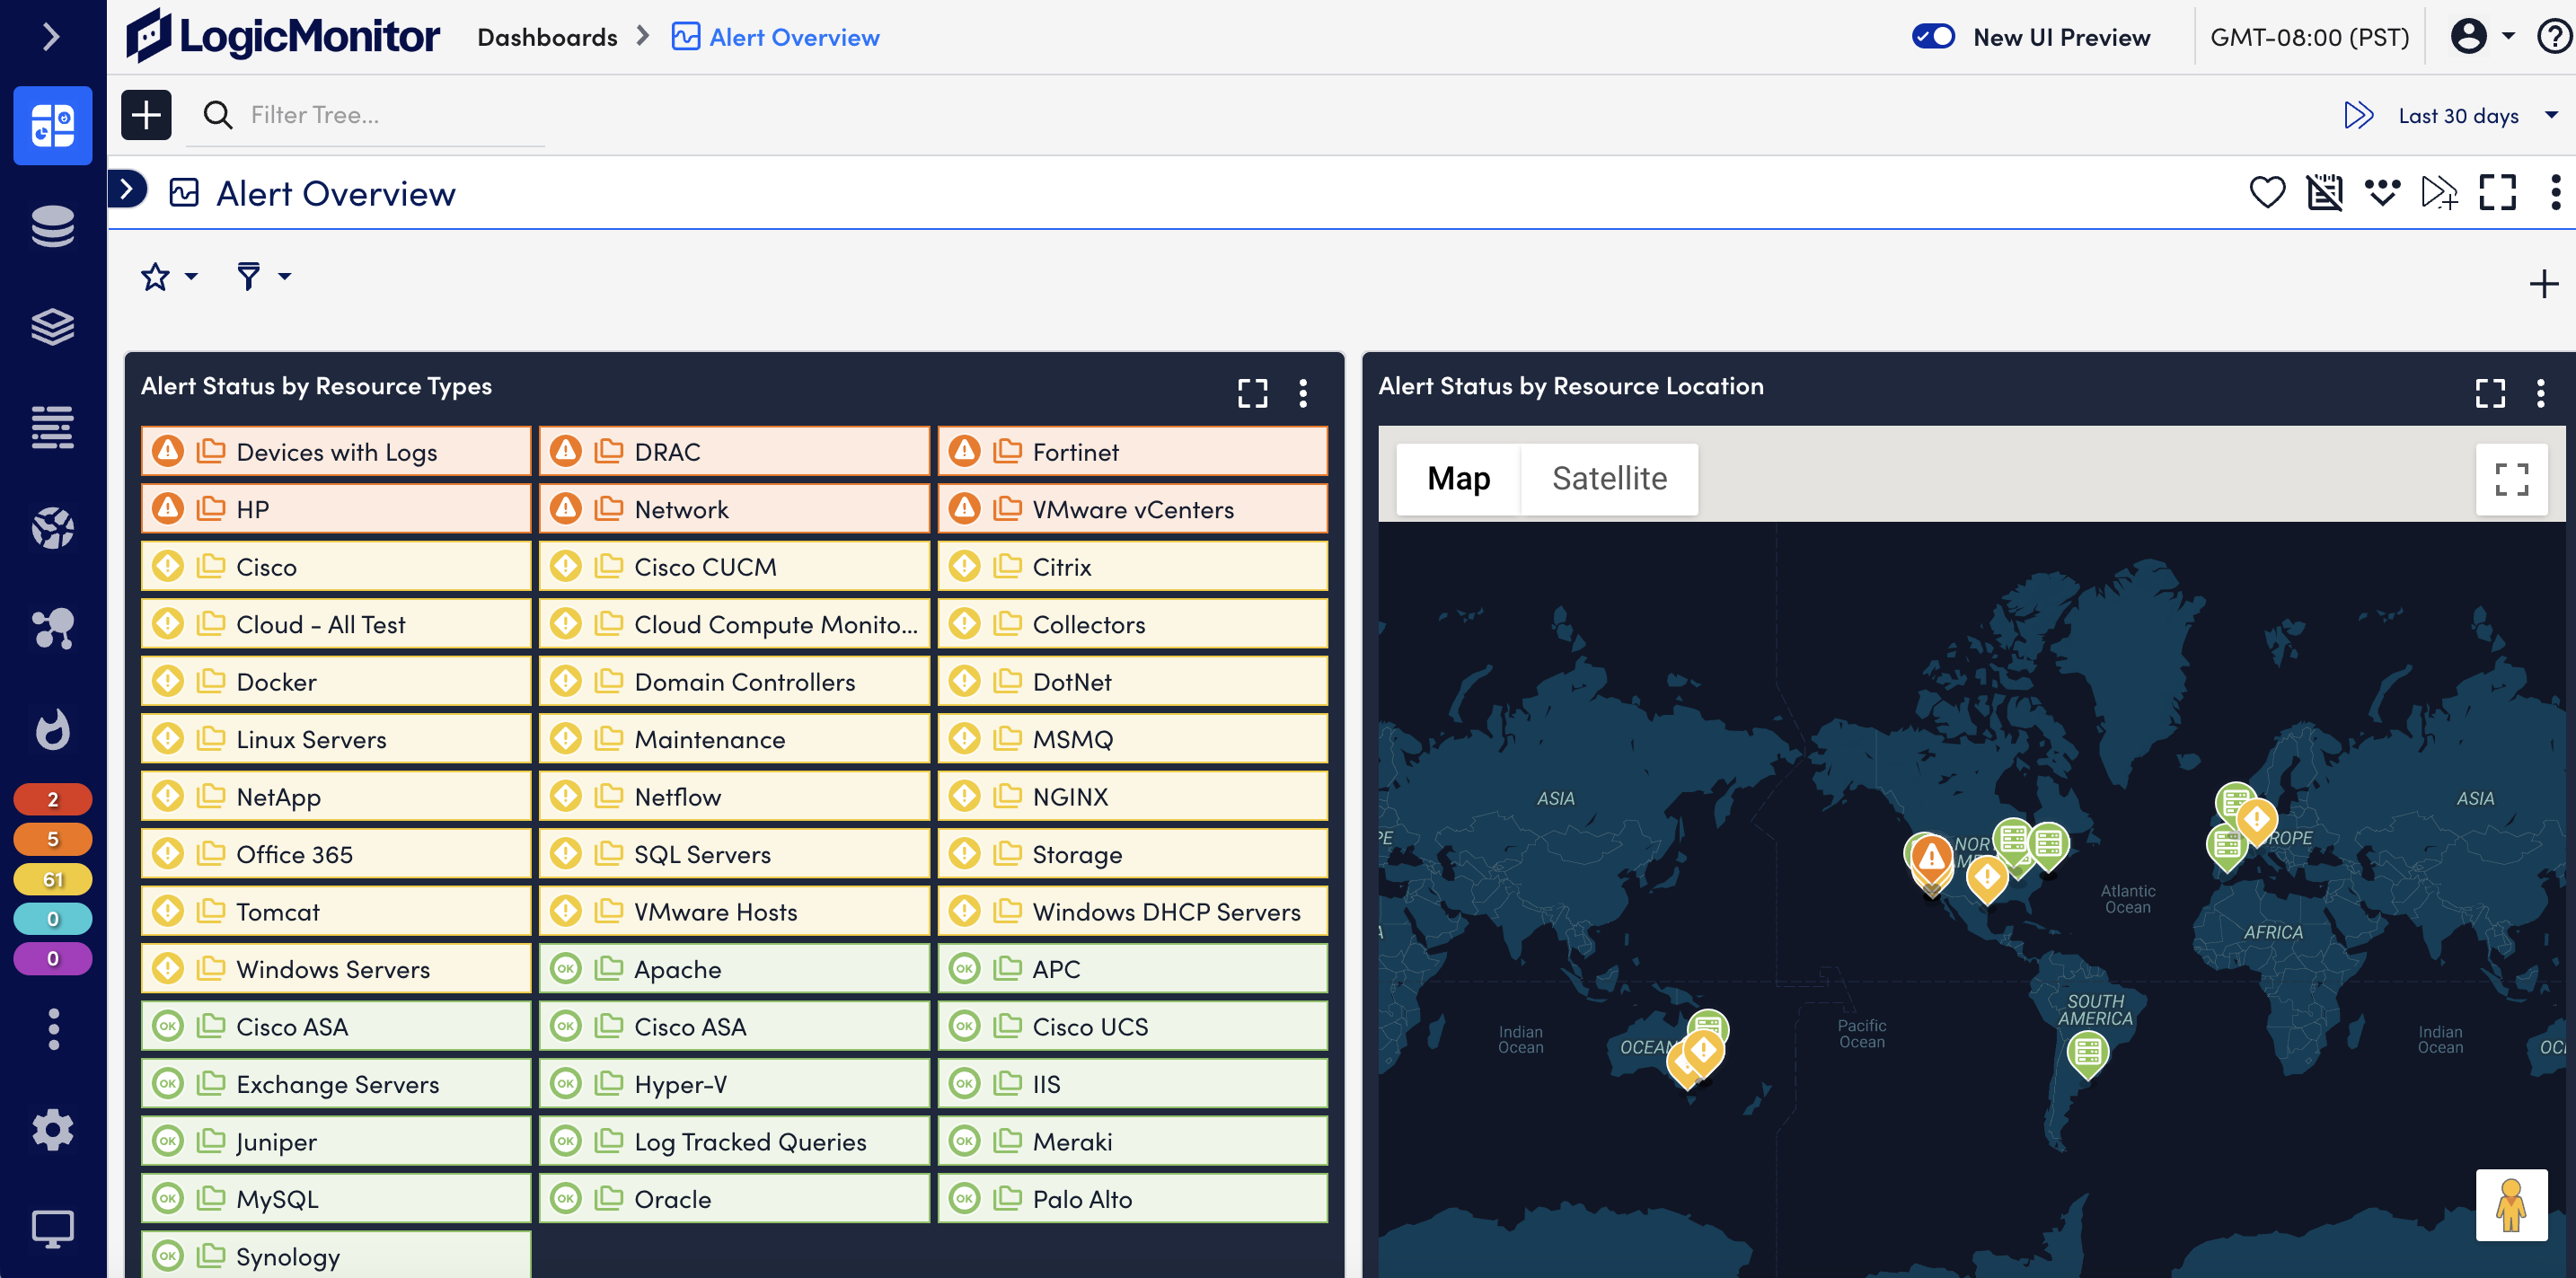
Correlate storage monitoring along with application and network performance within a single unified view to ensure your mission-critical applications are healthy and online at all times.
Right-size your storage capacity planning
Stay on budget. Monitor the health of your storage systems and avoid running into capacity issues with intelligent forecasting. LogicMonitor provides estimates that examine storage growth trends to pinpoint when you’ll need more resources. So you can buy smart and stay on budget.
For example, let’s say your Netapp system normally runs at 25% capacity. In the last week, usage has increased 10x, eating away at your storage. While this won’t trigger a utilization threshold, if this trend continues, storage will run out fast. Using dynamic thresholds, LogicMonitor can proactively alert you to this change so that you can troubleshoot and plan accordingly.
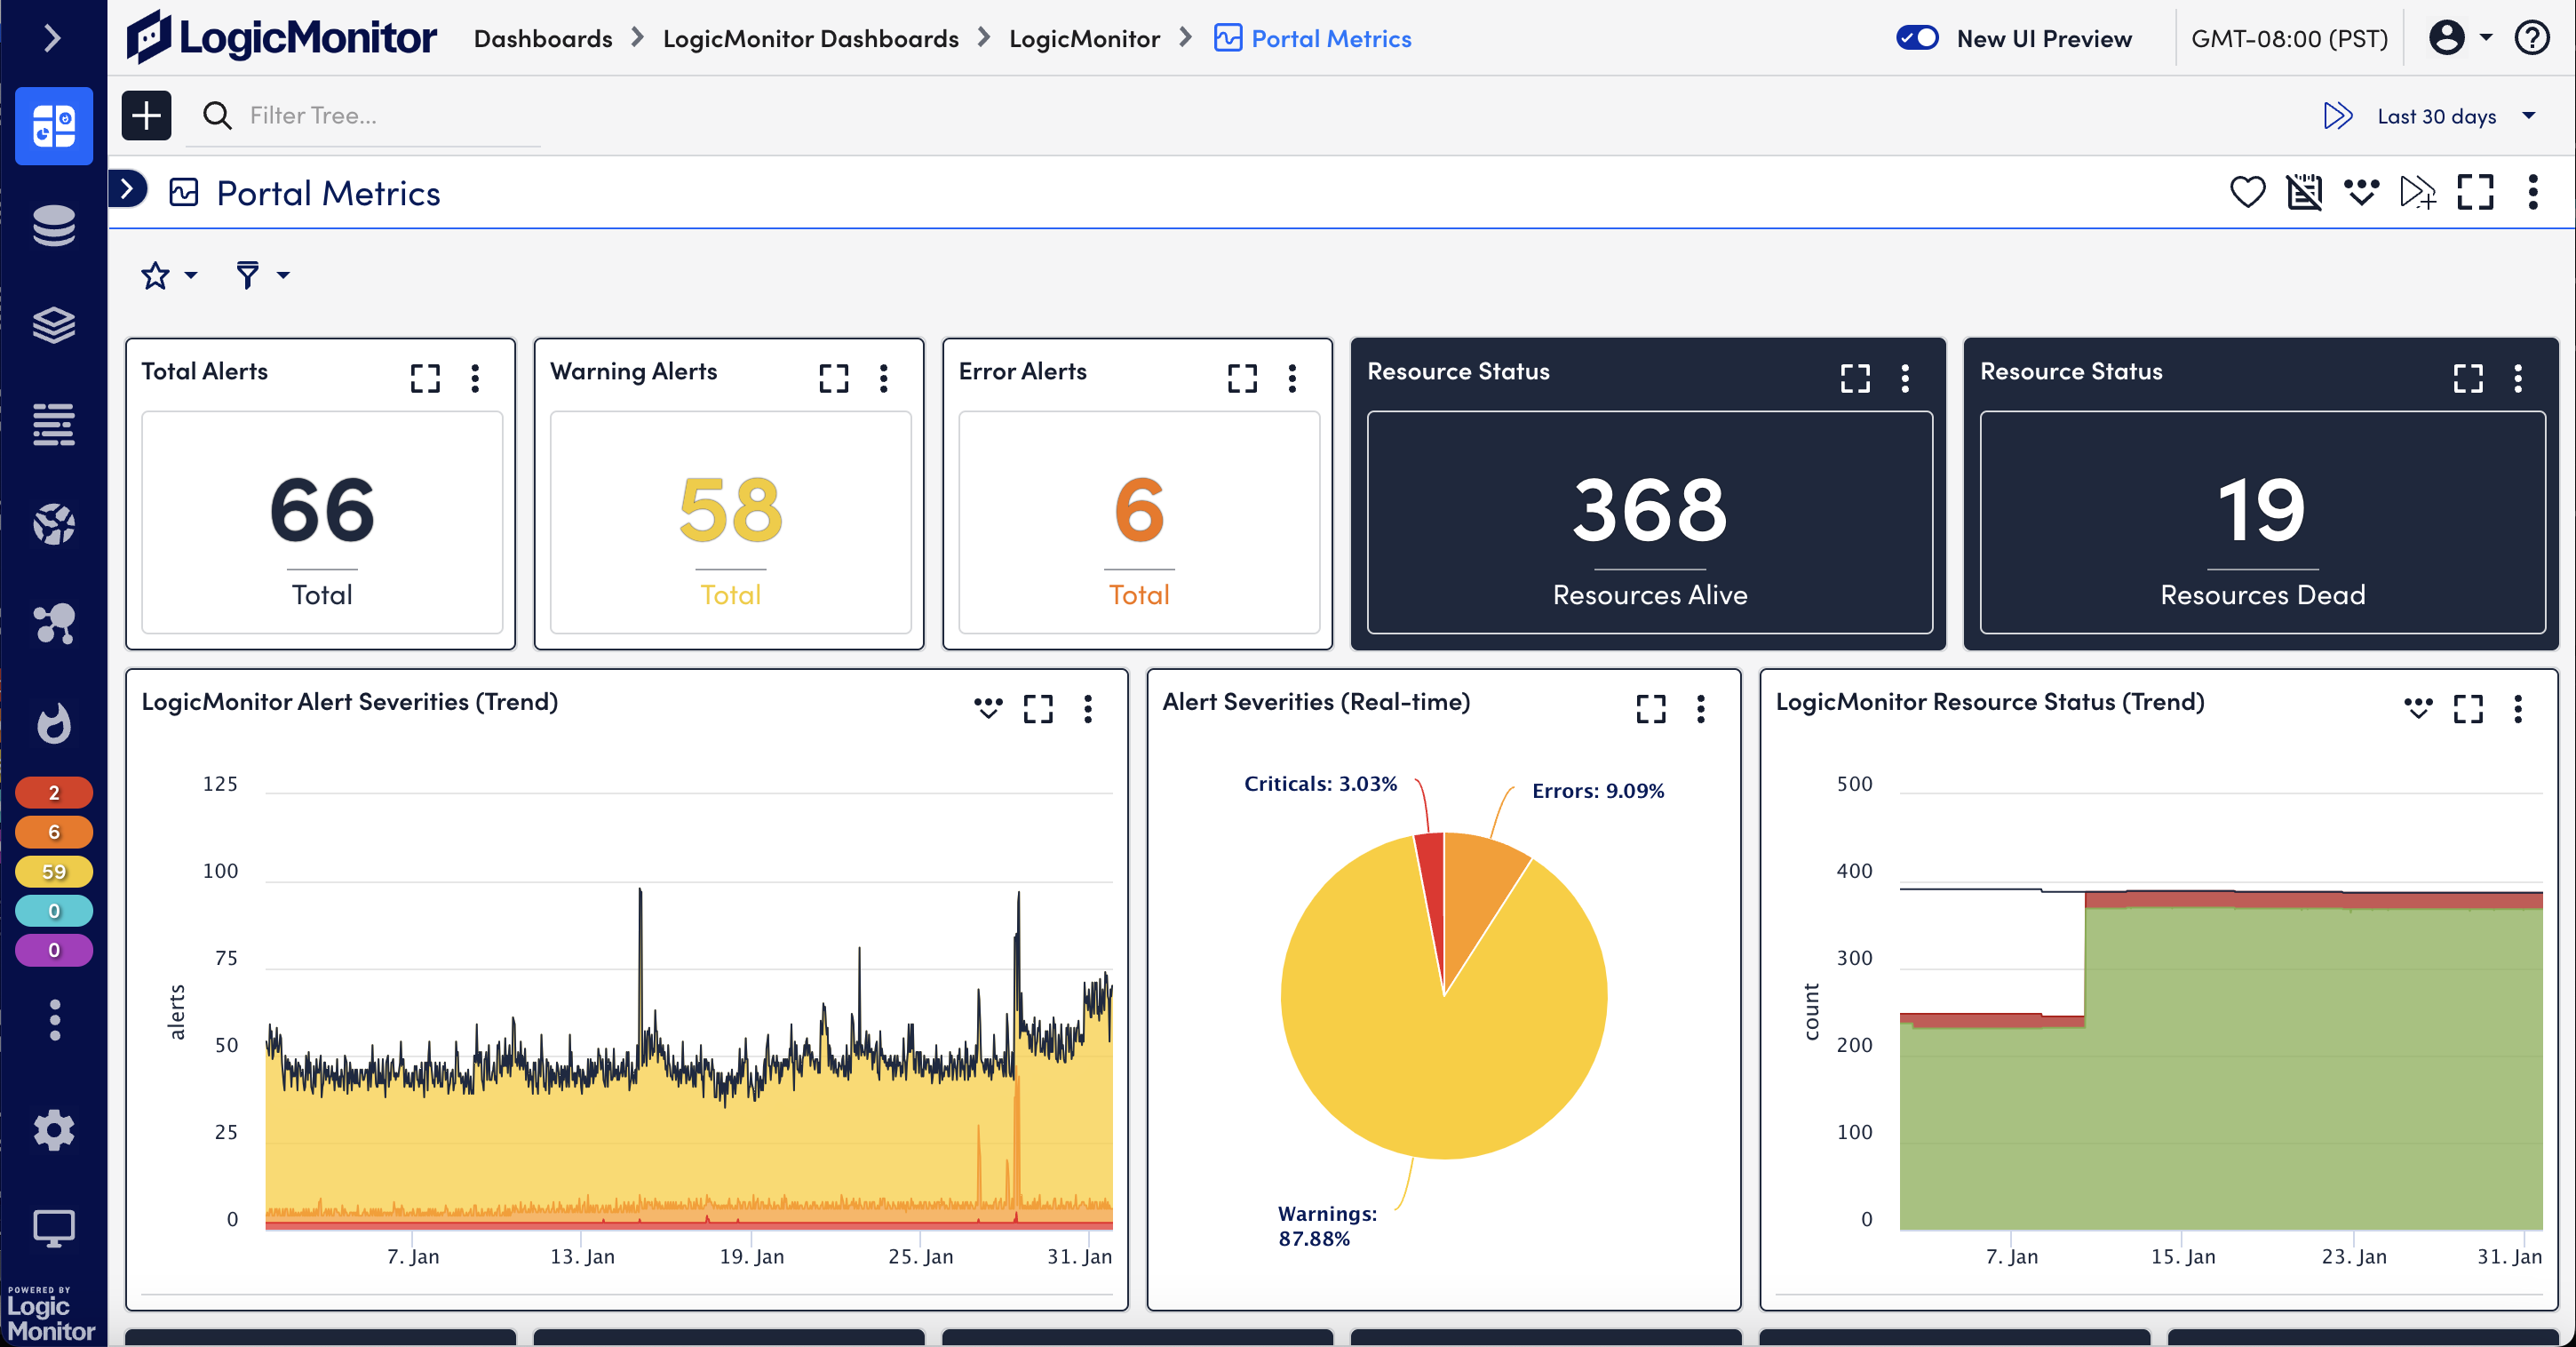
Monitor your entire stack together
Visibility across vendors, for your entire stack. Monitor the health and performance of your storage systems alongside your network, cloud, container, and server infrastructure within a single platform. Easily automate storage capacity planning and examine capacity trends with context and correlation to your entire infrastructure.
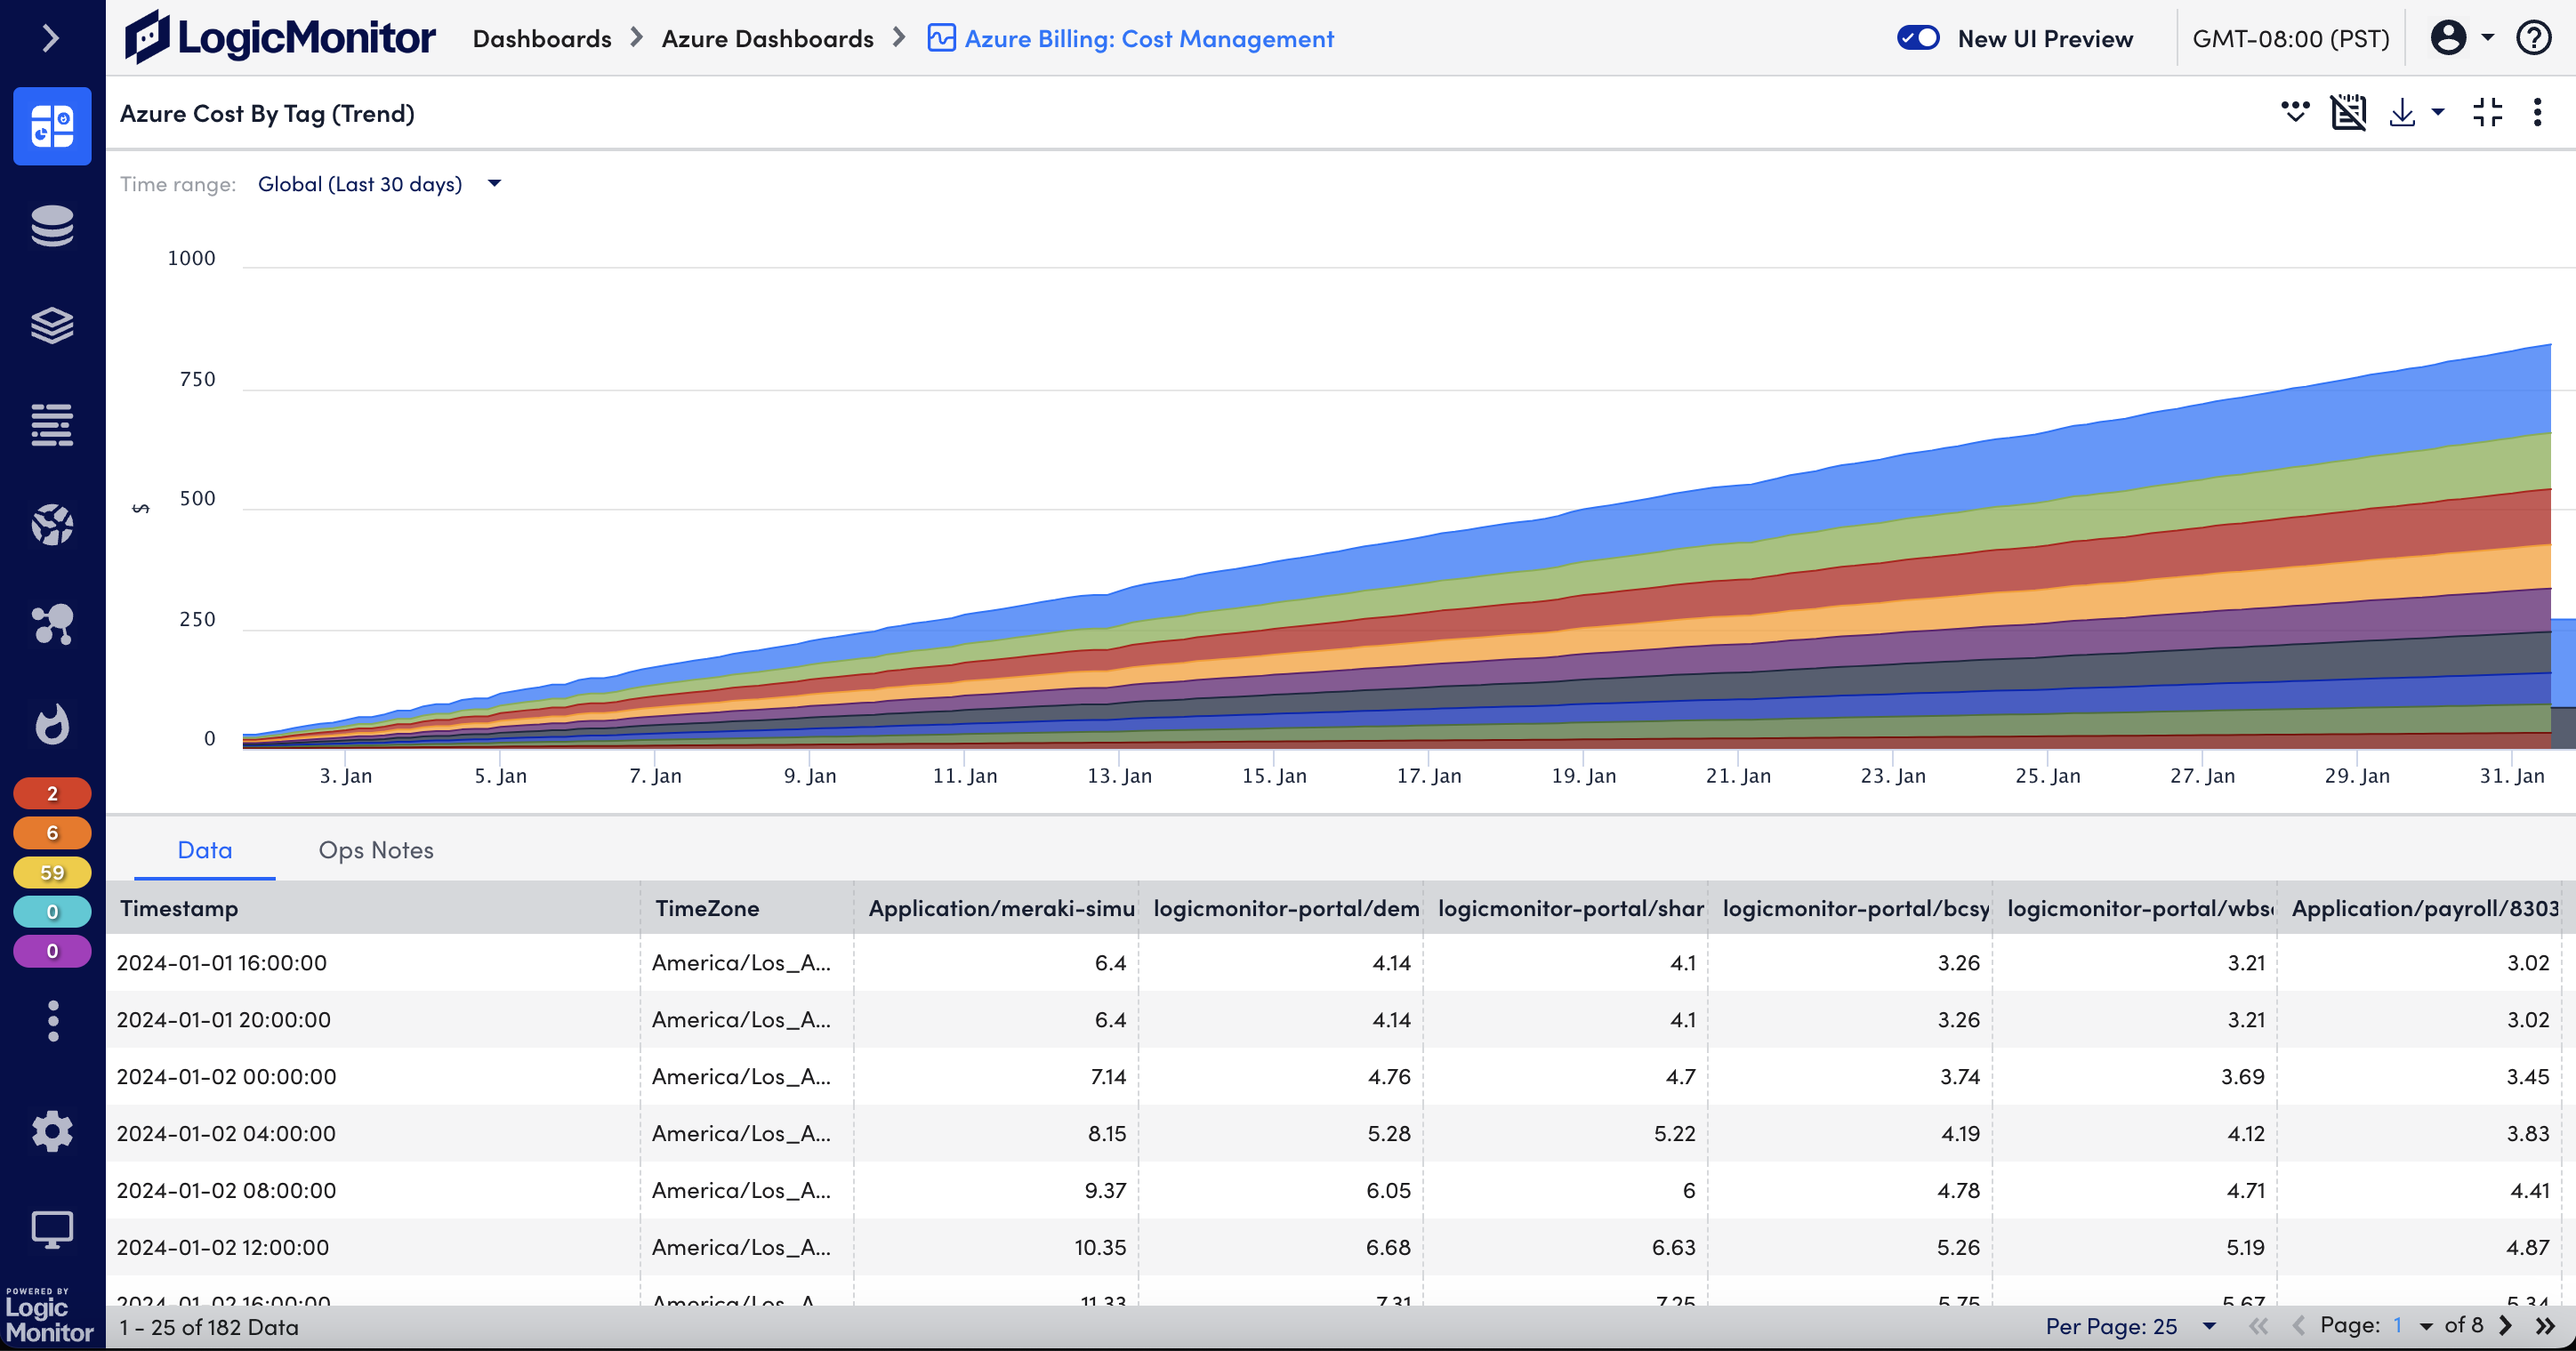
Enable FinOps with cloud storage monitoring
LogicMonitor enables FinOps by monitoring cloud storage spend across AWS, Azure, and GCP so key stakeholders can gain insights into how much they’re currently spending, how much they should expect to spend in the future, and early warnings about anomalous increases in cloud storage consumption.

Get real-time support from our experts
More than a platform, a partnership. Our engineers are available 24/7 via chat, and our professional services can help you deploy just about anything within your storage monitoring, down to some truly bespoke builds. So you can monitor everything that matters.
See what our customers are saying
One of the best monitoring platform that I have used
The entire health and performance of our website can be easily monitored with the help of LogicMonitor. Also, we use it to seamlessly monitor our end user application performance. There is 100% transparency and the troubleshooting is very much simplified which helps us achieve more efficiency in our day to day process.
Jun 27, 2024
Cloud based monitoring tool that excells
It presents to our company an intuitive and helpful interface, we can monitor with the help of tools integrated in this product the servers and other resources, the configuration of the devices does not require more expertise, we can generate several reports that are really helpful to avoid or detect problems into our resources and find the best solution for it
Jun 05, 2024

Track your company’s network and devices with LogicMonitor.
It’s great since we don’t have to install bothersome agents on the devices or hardware that we want to monitor. I didn’t even need to consult the instructions or contact customer support when I wanted to add a device; the process is simple and easy to follow.
Feb 12, 2024
Storage monitoring benefits
Future-proof your storage monitoring
Monitor traditional storage systems like NetApp, Dell Technologies, Pure Storage, and HPE storage systems alongside cloud-based storage systems like GCP, Azure, and AWS to rapidly optimize performance across your entire infrastructure. LogicMonitor also supports hyper-converged and virtualized storage systems like Cisco HyperFlex, Nutanix, and VMware vSAN.
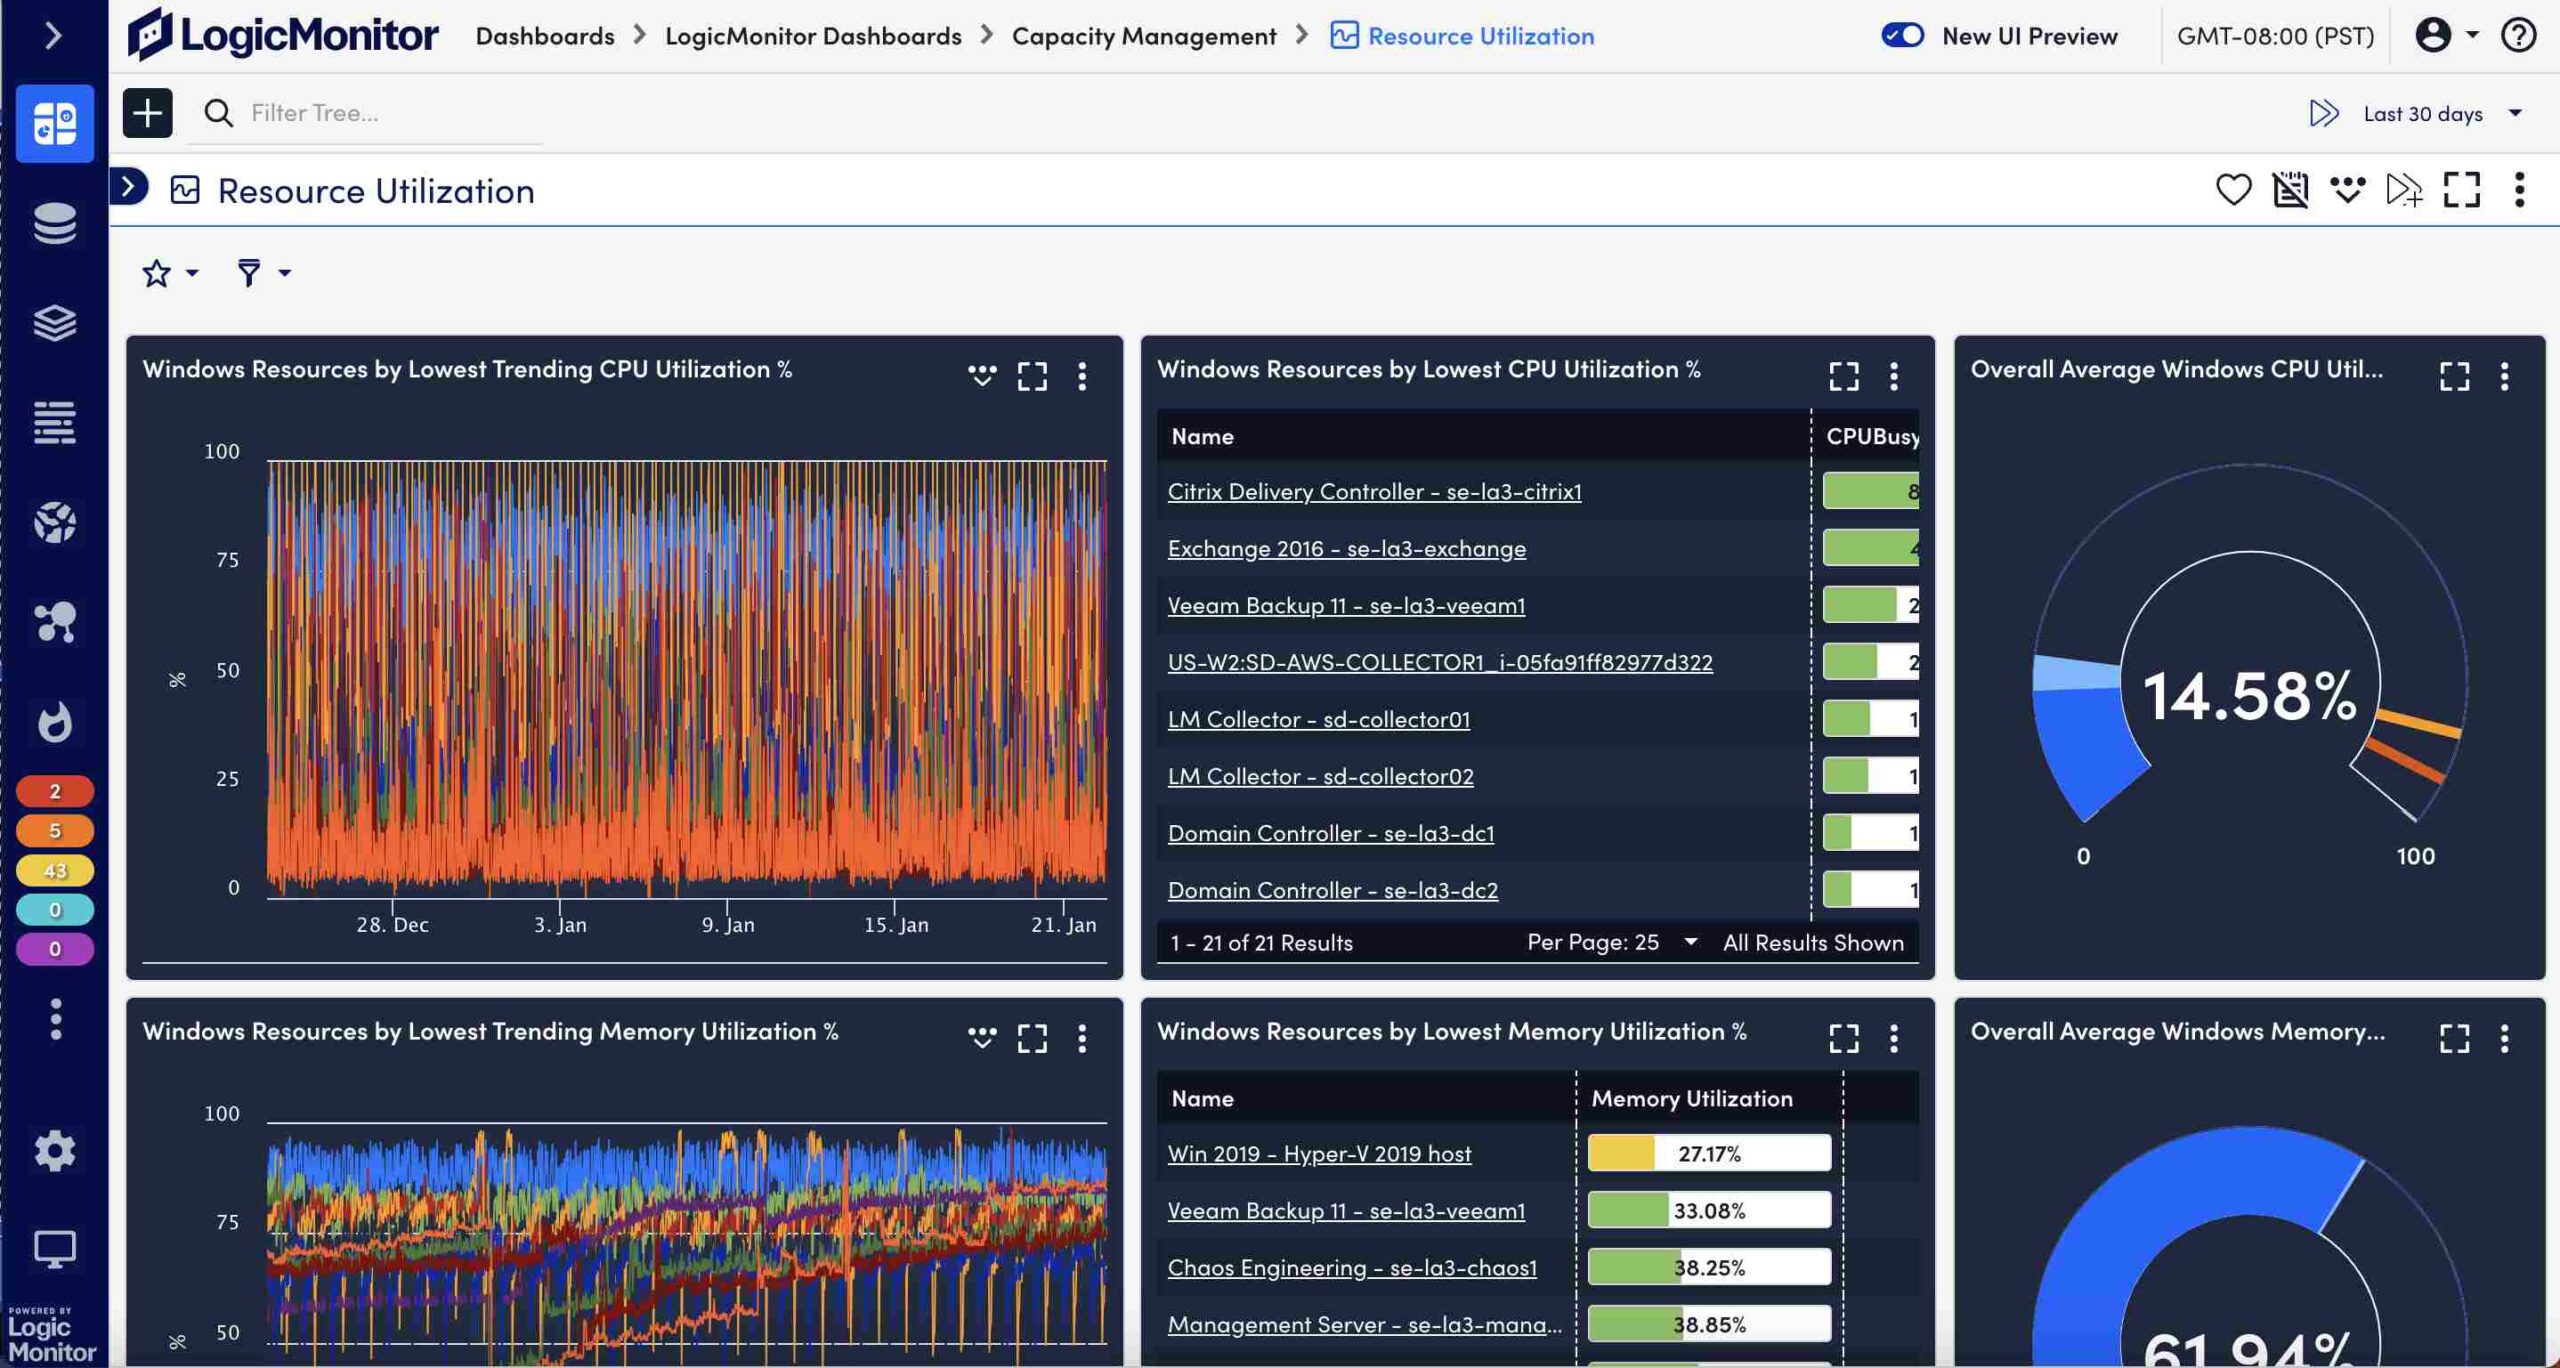
Storage monitoring that scales with you
Graph and alert on utilization, performance, and health metrics like capacity, IOPs, disk usage and more across LUNs, RAID Groups, Storage Pools, and Drives. LogicMonitor automatically discovers new components as your system grows – eliminating any gaps in visibility.

Monitor in minutes
LogicMonitor’s automated discovery starts monitoring and alerting in a matter of minutes without any manual configuration. That’s right; no configuration required. Working with a vendor that doesn’t allow autodiscovery? Just enter a hostname or IP address to quickly discover and add all related storage systems.
Powerful dashboards
Visualize historical trends and forecast future needs. Build drag-and-drop dashboards to view high-level storage metrics or dive deep into granular metrics with ease. See and share data across teams and customers to enable collaboration like never before.
Flexible alerting
Preconfigured and custom alerts are set with dynamic thresholds. Easily route alerts to different teams based on severity, device, technology, groups, or even time of day.
Related solutions


Trusted by:


Storage monitoring FAQs
- What is storage monitoring?
Storage monitoring offers a solution for evaluating storage infrastructure in real time. An effective storage monitoring solution is crucial to the overall health of IT infrastructure.
- How can I manage my storage performance?
Graph and alert on utilization, performance, and health metrics like capacity, IOPs, disk usage and more across LUNs, RAID Groups, Storage Pools, and Drives with storage monitoring.
- What is an advantage of performing capacity monitoring in a storage environment?
When you constantly monitor your storage environment, you can plan when capacity expansion of the hard disks becomes necessary, thus preventing storage space problems. Hardware problems can be detected at an early stage.
- How is storage information collected?
Enter a hostname or an IP address, and LogicMonitor automatically discovers all related storage systems. LogicMonitor automatically discovers new components as you grow your system so you can eliminate any gap in visibility.
- Benefits of storage monitoring?
Benefits of storage monitoring include constantly evaluating capacity for optimal perfomrance, gaining visibility into your entire infrasture, ability to track your systems, and understanding/pinpointing root causes.