How to Monitor Kubernetes Without an Agent on Every Node
When it comes to monitoring Kubernetes, LogicMonitor’s agentless approach enables you to comprehensively monitor your cluster and the health and performance of the resources within without requiring an agent on every node. Find out how to bypass the hassle of node-based agents in our most recent blog post.
3 min read
December 5, 2018
In this article
NEWSLETTER
Subscribe to our newsletter
Get the latest blogs, whitepapers, eGuides, and more straight into your inbox.
Thank you!
Your video will begin shortly
SHARE
In this article
LogicMonitor is an agentless monitoring solution. What we really mean by “agentless” is that we don’t require an agent on every monitored server (physical or virtual). One LogicMonitor Collector – a lightweight application that takes just seconds to install – can monitor hundreds or even thousands of devices, including servers, virtual machines, network switches, storage systems, cloud resources, containers, and more. As an agentless solution, LogicMonitor is easier to set up than a traditional agent-based monitoring (because you only have one lightweight app to install), and takes fewer IT cycles to manage over time (e.g. because you don’t have to worry about maintaining consistent versions across agents). When it comes to monitoring Kubernetes, LogicMonitor’s agentless approach enables you to comprehensively monitor your cluster and the health and performance of the resources within without requiring an agent on every node.
LogicMonitor’s Kubernetes Monitoring relies on two primary applications for monitoring:
An application, Argus, running in the cluster for discovery
A Dockerized LogicMonitor Collector running in the cluster for data collection
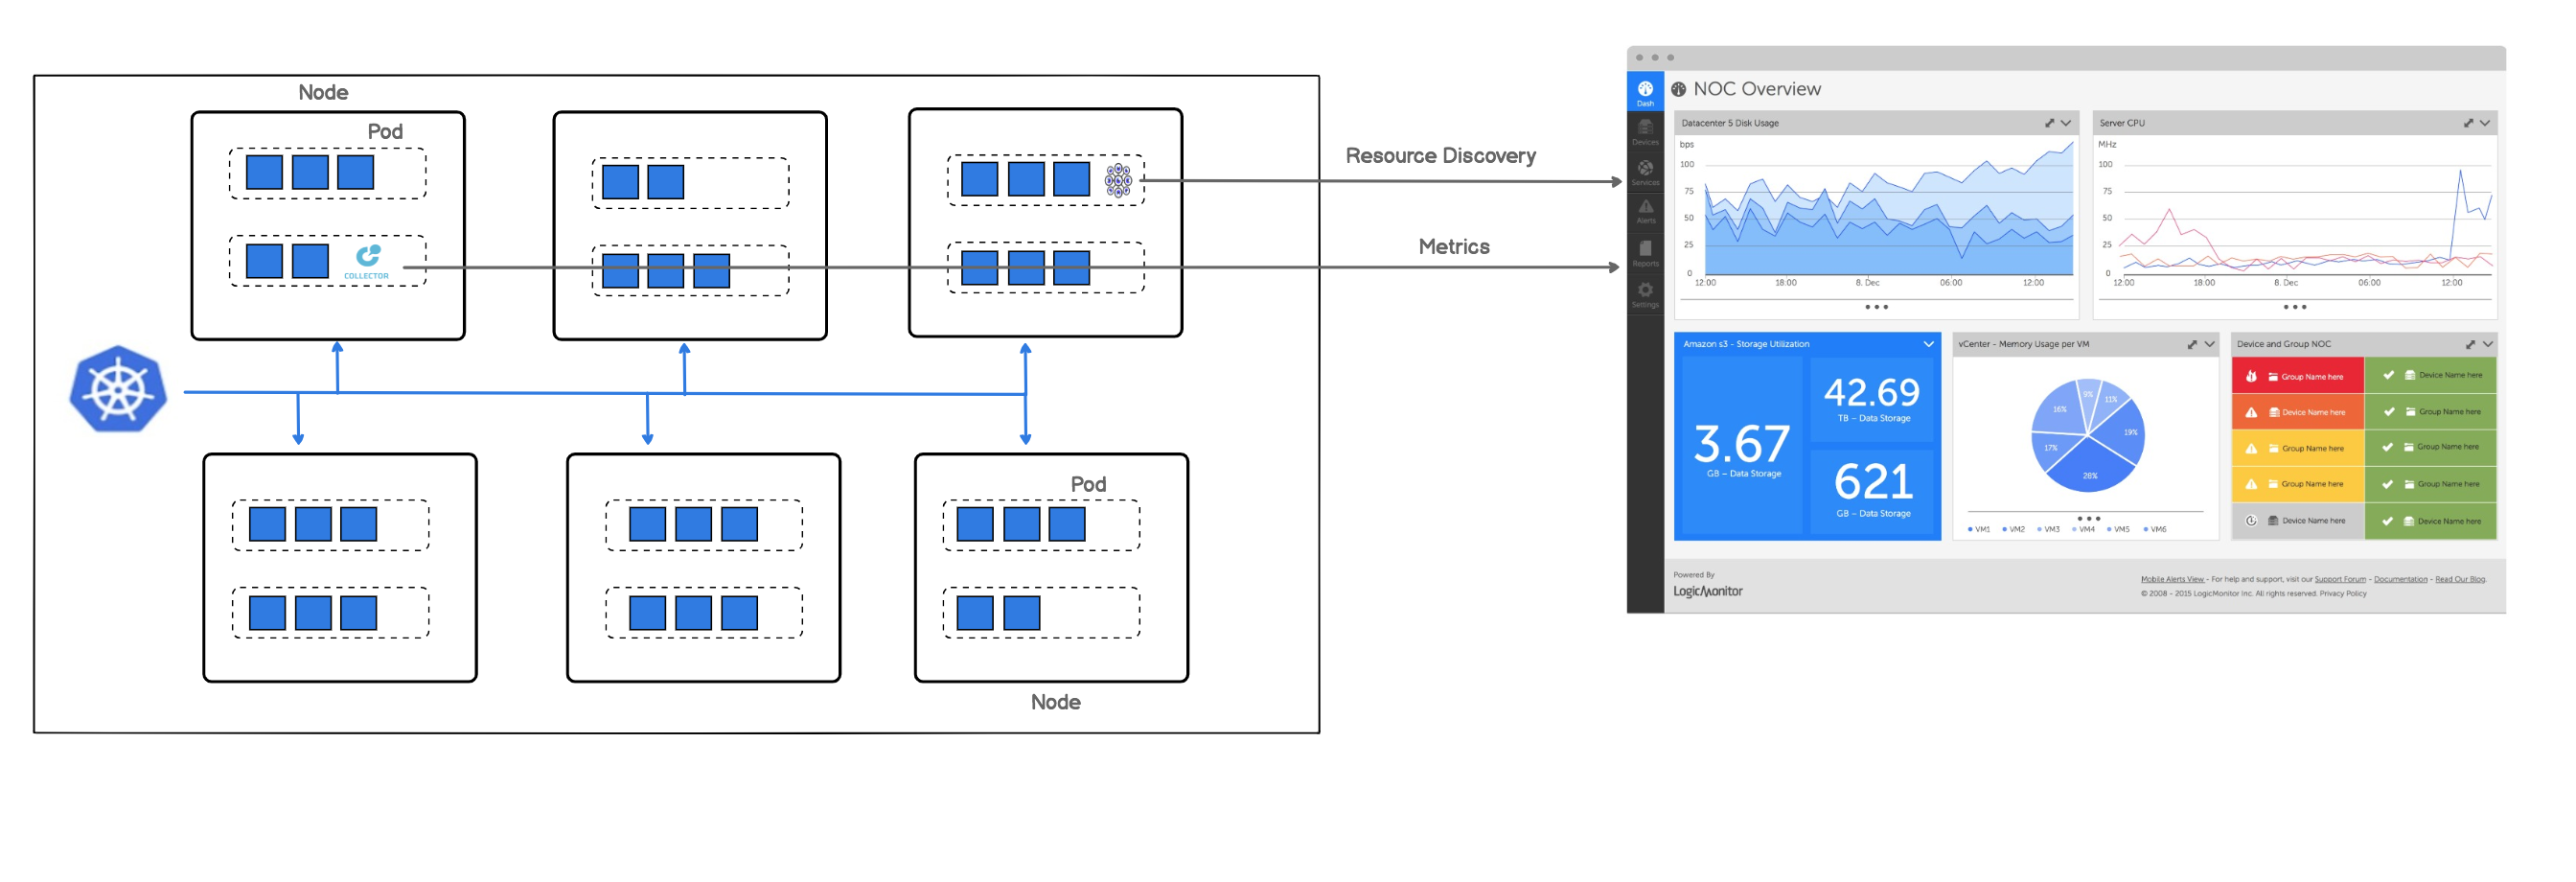
The first application, Argus, runs as one pod and uses event-based discovery alongside LogicMonitor’s API to ensure monitoring is always up to date with what is running in the cluster. The second application, LogicMonitor’s Collector, collects data for Kubernetes nodes, pods, containers, and services via the Kubernetes API, as well as more traditional protocols like SNMP or JMX, to ensure that cluster resource performance and health are comprehensively monitored. In all, these two pods running in your cluster is all that is required to start monitoring Kubernetes with LogicMonitor.
A diagram of how LogicMonitor’s Kubernetes monitoring works, including components necessary for discovery and monitoring.
Although running an agent on every node in a Kubernetes cluster can be made easier, for exampleby using a daemon set, there are also disadvantages with using agent-based monitoring for cluster architectures relying on master and worker relationships. The Kubernetes Master handles orchestration and scheduling. It is important to monitor the master components (i.e. kube-apiserver, kube-scheduler, controller-manager), to ensure the desired state of the cluster is enforced. However, with agent-based monitoring, you’ll likely end up with multiple data collection requests to these master components – one for each agent. As a result, agent-based can be overly taxing on the Kubernetes Master, in addition to being more difficult to configure and manage.
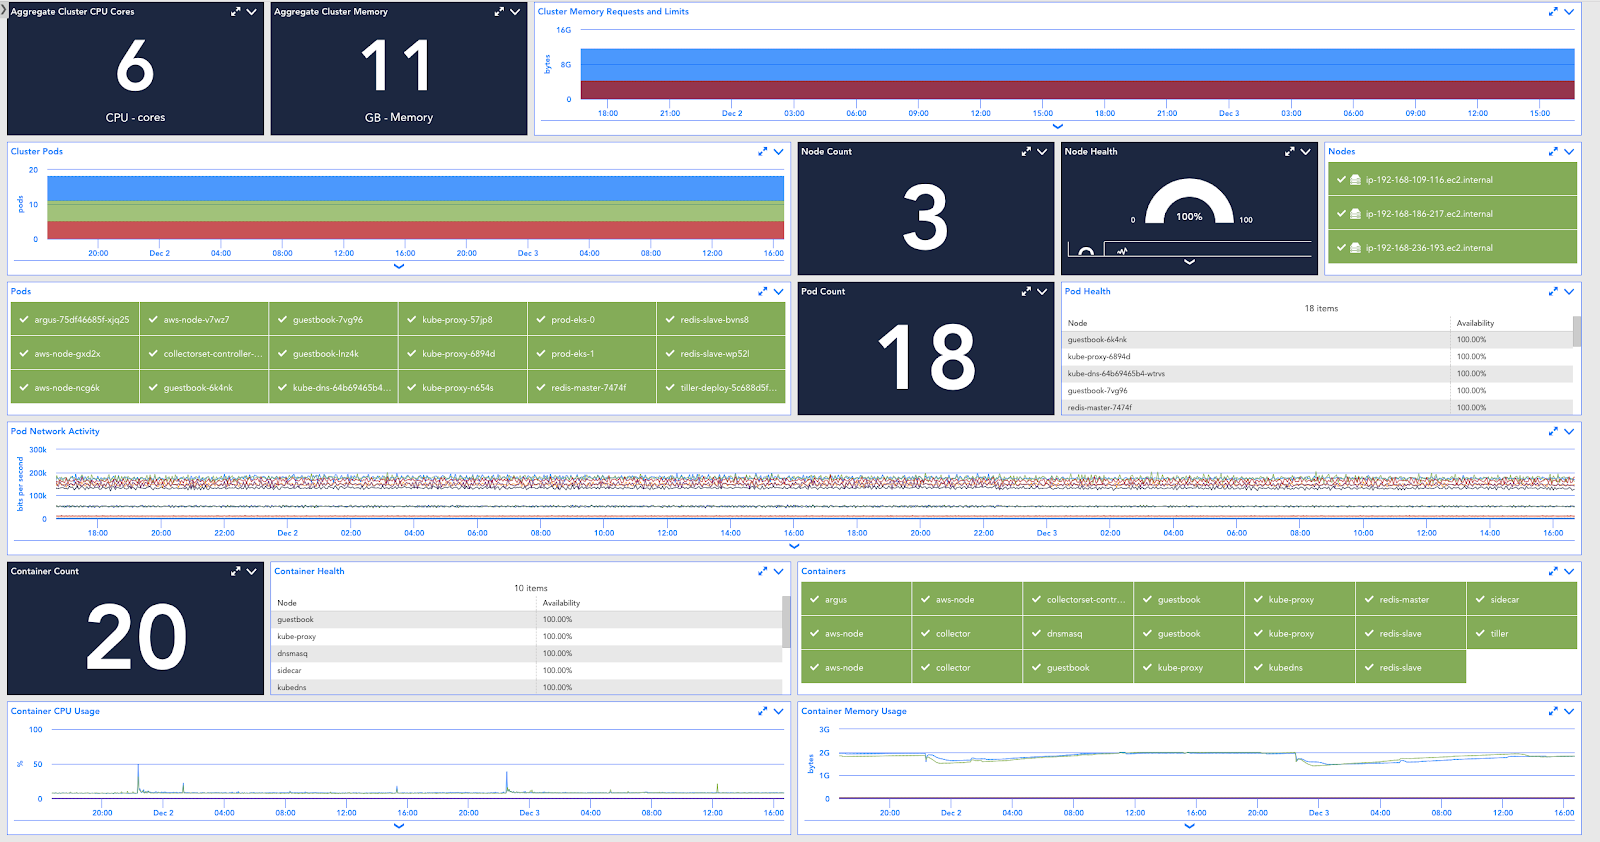
In addition to being agentless, LogicMonitor has comprehensive metrics for Kubernetes nodes, pods, containers, services, master components, and common applications, so you get instant visibility into your cluster’s health and performance. Pre-configured alert thresholds mean you get out-of-the-box monitoring and alerting. Data is retained at the granularity at which it is collected for up to two years, which enables you to have long-term visibility into the performance of your applications.
A LogicMonitor Dashboard displaying metrics for Nodes, Pods, Containers, and Services in a Kubernetes Cluster.
With LogicMonitor, you can get comprehensive Kubernetes monitoring without the hassle of node-based agents. Sign up for a free trial today!