Using Dynamic Thresholding to Monitor Your Cloud Platforms
Using dynamic thresholding on your cloud platforms means that you can easily generate alerts for anomalies. Using dynamic thresholding will even alert you early when systems are changing over time. Learn more!
Whether you are new to the Cloud, mid-transition, or a professional at cloud or hybrid systems, no one likes being bothered with useless alerts. The options are simple:
Ignore the alert and hope it goes away
Spend hours tuning and adjusting alerts
Let the system tell you when an alert should be looked at
If you take the approach of ignoring the alert like a bad cold-call, you risk the chance of missing a critical alert and watching your system crash around you. No one likes to open their inbox to a few hundred alerts they have been ignoring.
You could spend hours tuning and adjusting your alerts and monitoring, only to find out that the ephemeral nature of the Cloud means that some of those well-tuned instances have spun down to be replaced by new instances. You may also spend the time and later find out that the demand on your system has changed significantly, rendering these changes almost useless. Also, remember that tuning you did late Thursday night because you were tired of a cloud service bouncing back and forth between alerting and fine? You didn’t notice that your cat Fluffy sat on the keyboard while you refilled your drink and changed that warning threshold from “95” to “95afhyDESTROYKEYBOARD128”.
Monitor Your Cloud Platforms With Confidence
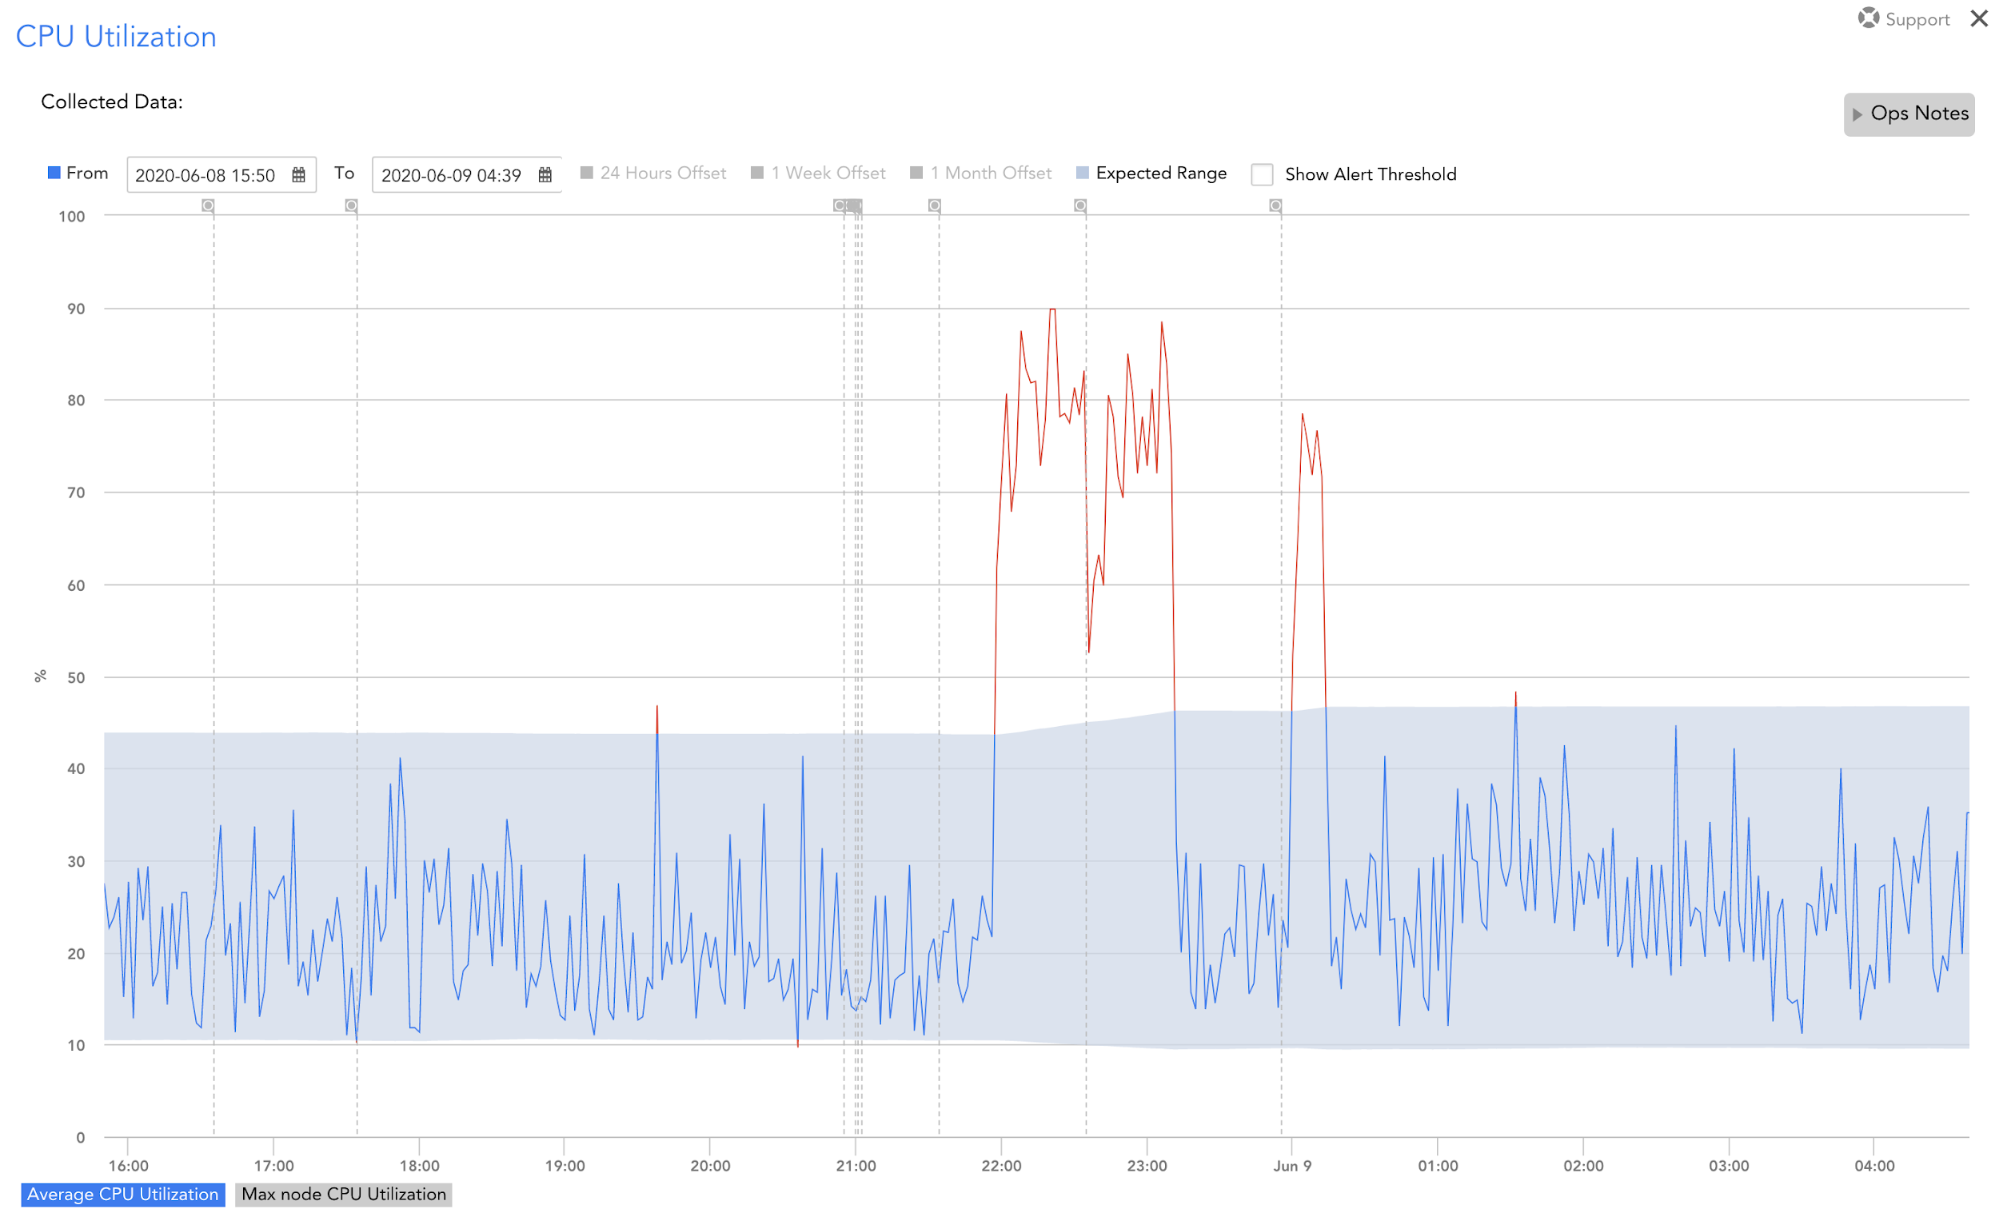
Don’t worry, there is a smarter way. Using dynamic thresholding on your cloud platforms means that you can rest easy knowing that it will generate alerts for anomalies. Using dynamic thresholding will even alert you early when systems are changing over time, giving you plenty of time to remove Fluffy from your laptop and make any changes you need to prevent downtime.
Let the System Work for You
Cloud monitoring can be difficult in the best of cases. In reality, it is even harder. Complications from having multiple environments spread across multiple clouds and on-premise devices can keep you up at night. LogicMonitor can help you monitor your performance across Amazon Web Services (AWS), Microsoft Azure, Google Cloud Platform (GCP), and your own hardware. Utilizing LogicMonitor’s Dynamic Thresholds across these different environments means that you don’t have to log in to each system to get a report, and you also have the confidence that your system will warn you early when systemic changes are threatening system health.
Dynamic Thresholds not only knows when and how to alert you to issues, but they can also suppress alerts that may otherwise be triggered when it detects time-based patterns. This allows you to rest easy knowing that alerts will be meaningful and if there is an issue at any time, it will be alerted to you.
Visualize Success
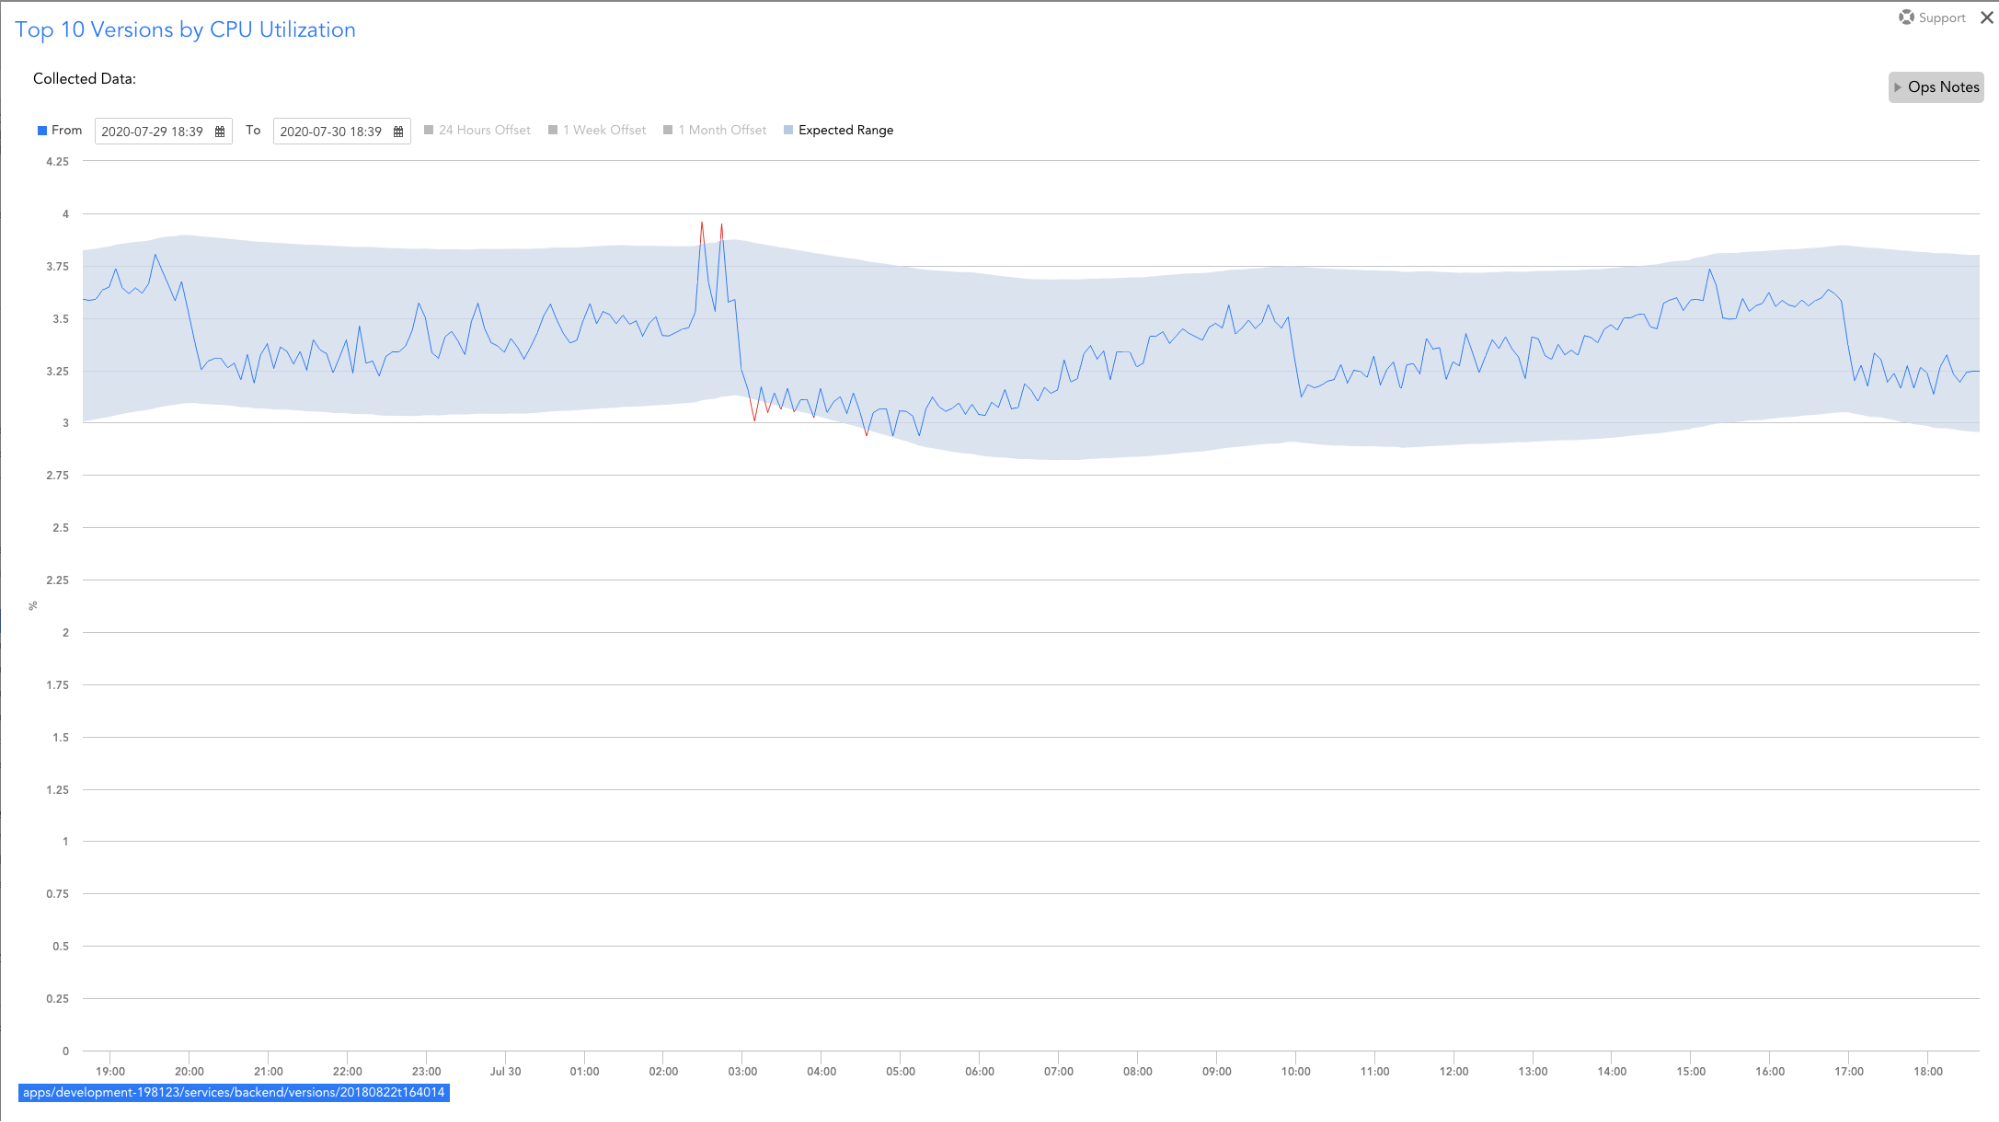
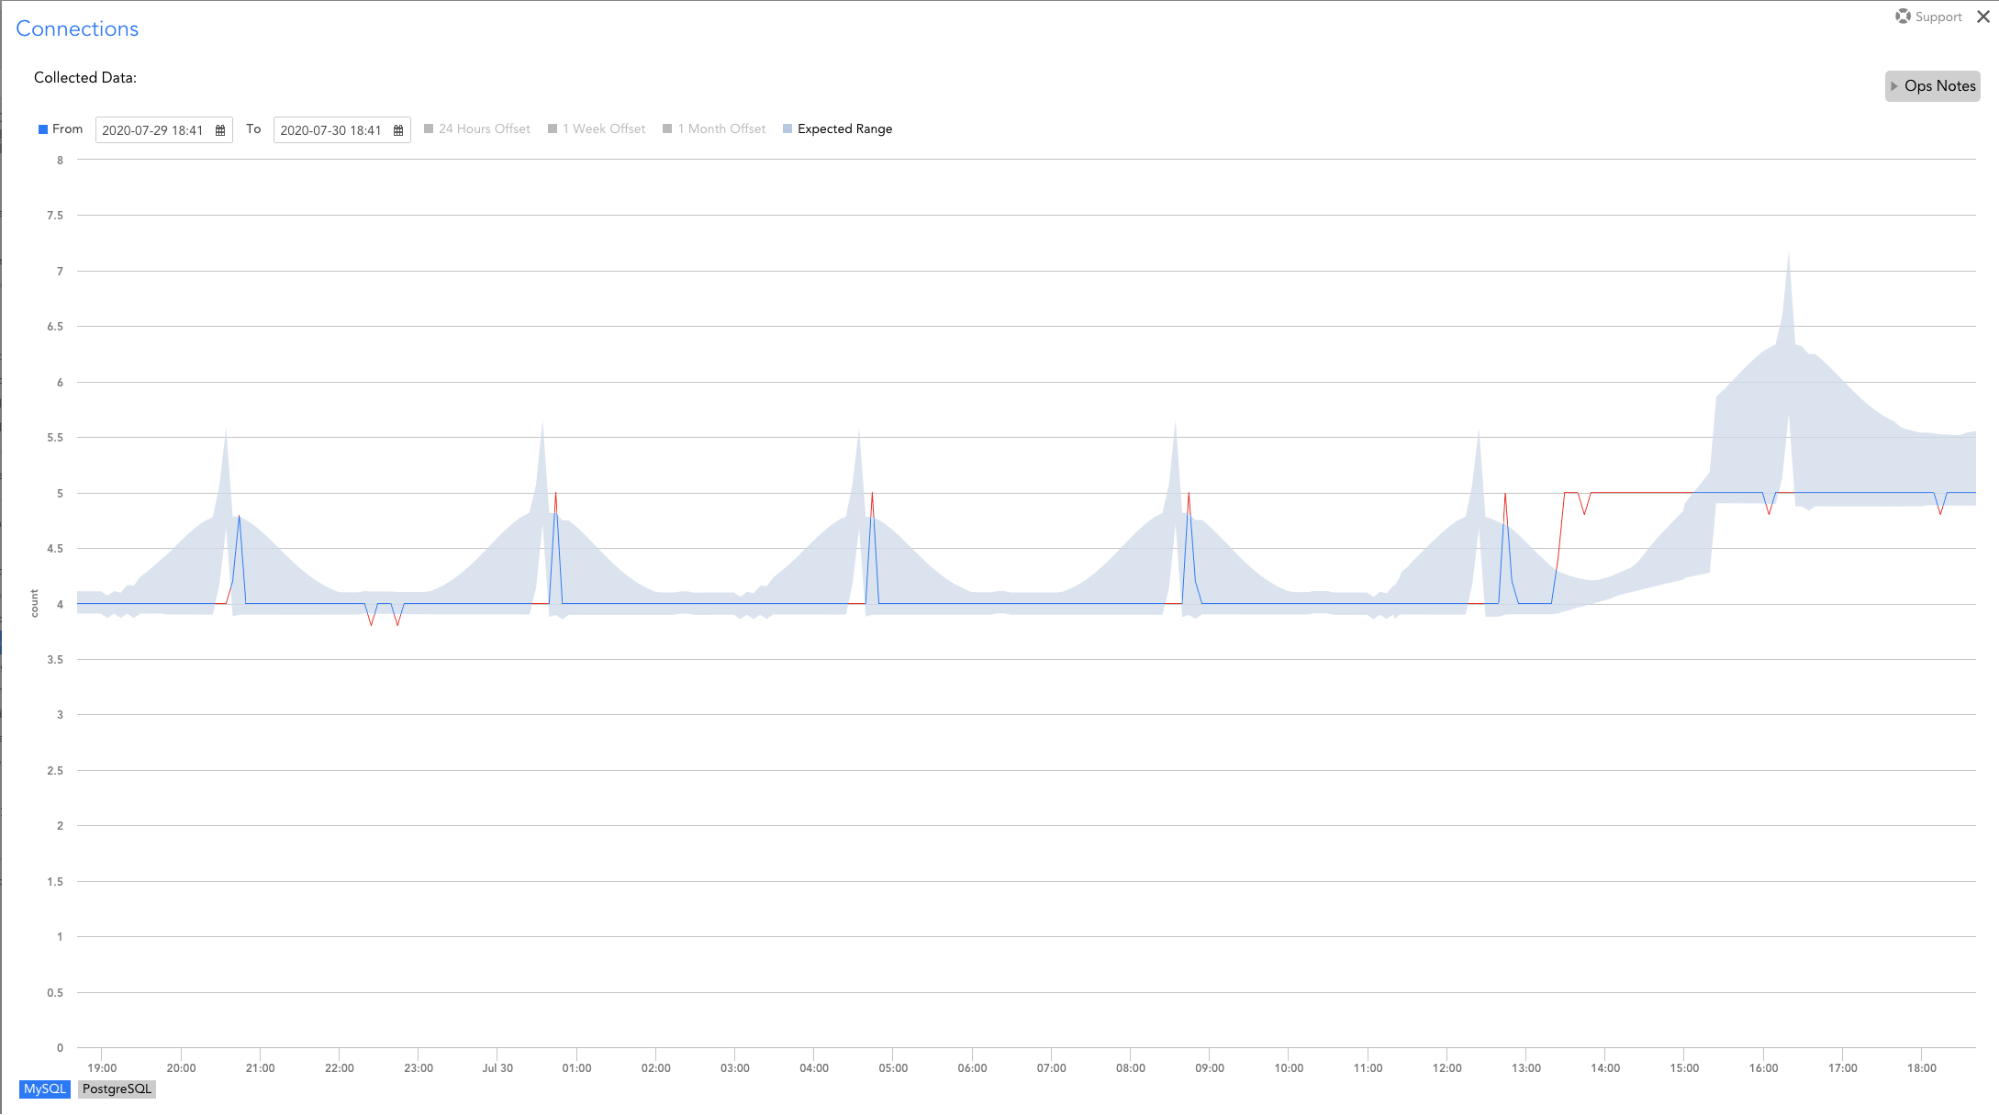
Our cloud monitoring can be viewed next to your on-premise monitoring and across your cloud instances. This means you can visualize your data at the touch of a button. You can visualize this data with an understanding of how Dynamic Thresholds will react to the data and see the bands where alerts would not be sent. This allows you to understand and even tune your thresholding if you want. Or, you can kick back and relax knowing that it is being handled by LogicMonitor.
Combined with other features from LogicMonitor’s Early Warning System – such as root cause analysis and forecasting – dynamic thresholds can help you more proactively prevent problems that result in business impact. To learn more about LogicMonitor’s AIOps Early Warning System or to see it in action, sign up for a free trial.
Disclaimer: The views expressed on this blog are those of the author and do not necessarily reflect the views of LogicMonitor or its affiliates.