If you’re in IT operations, you’ve likely faced the disconnect firsthand: your dashboards say everything’s green, but your business stakeholders are asking why the website is slow, the customer portal is timing out, or a regional service is underperforming. Your team is usually on top of issues, such as monitoring infrastructure health, resolving alerts, and keeping systems online. But the business isn’t looking at device uptime. They’re thinking in terms of services and outcomes that affect customer experiences and the bottom line.
That’s why we built Dynamic Service Insights (DSI)—one of the latest product enhancements from LogicMonitor that helps ITOps teams think beyond devices and finally connect their work to what the business actually cares about.
What Is Dynamic Service Insights?
Dynamic Service Insights delivers clear, scalable service-level visibility by intelligently grouping infrastructure components using tags and mapping them to the services they support. It helps operations teams shift from traditional, device-centric monitoring to a service-first observability model.
Previously, creating services meant manual setup and constant upkeep. It was difficult to scale services and oversee multiple services at once. Now, rules and tags keep services aligned and updated automatically—no queries, no custom models.
Why It Matters Now
IT teams are thinking about observability beyond whether servers are online. They’re tying infrastructure performance to business impact. Based on customer interactions, we are embarking on this strategic shift in how we think about observability.
CIOs, CTOs, and stakeholders across the enterprise want to know what services are impacted by IT infrastructure, how those issues affect users or revenue, and whether the investment in IT is delivering measurable results.
With DSI, ITOps teams finally have the tools to provide those answers. You can show leadership which services are healthy, which are degraded, and how quickly you’re responding to disruptions. This turns IT from a perceived cost center into a valuable business enabler.
How Dynamic Service Insights Works
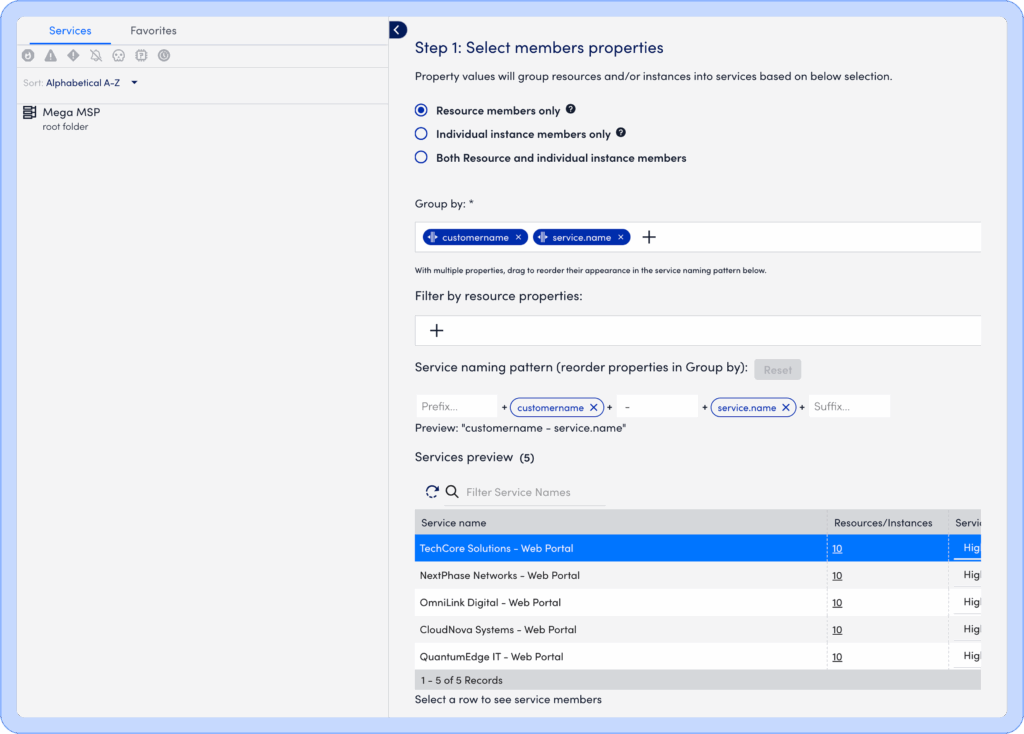
DSI is built on powerful, flexible automation. Service creation is rule-based and tag-driven, making it easy to onboard services at scale. Whether you’re tracking a customer-facing app, a regional compute cluster, or a core backend system, you can define it in seconds using tag properties already in your LogicMonitor Envision environment.
After categorizing a service, select properties and tags to define the service.Arrange services in a hierarchical structure for more structured visibility.
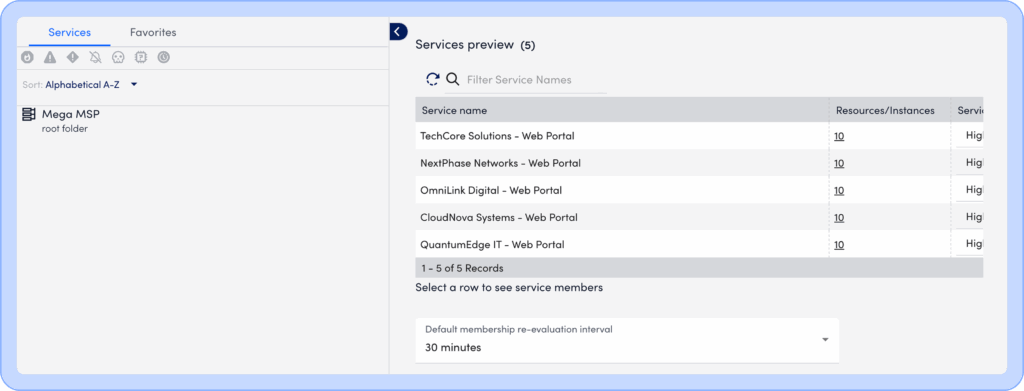
Once defined, DSI automatically selects relevant metrics using intelligent filters and workflows, surfacing key performance indicators that reflect true service health. Each service comes with a configurable dashboard, which can show real-time status, KPI trends, and degradation insights such as the percentage of members down, giving you immediate clarity without additional configuration.
See metrics related to the data sources behind your business services.
Troubleshooting is faster too with direct drill-down from a high-level service alert into the logs, metrics, and topology for shorter time-to-resolution, and improved root cause analysis.
How We Stack Up Against the Competition
What sets DSI apart from other solutions is its simplicity and speed-to-value. Unlike offerings from Splunk or ScienceLogic, which often require complex modeling or extensive tuning, DSI delivers extensive value with easy configuration and tagging. You don’t need to build custom queries or maintain brittle service models, and it’s ready for any size team.
Pricing and Getting Started
DSI, available in packs of 25 services and included with LogicMonitor Advanced and Signature platform packages, makes it easy to start small—like with an AWS environment, storage layer, or regional cloud deployment—and expand into business-facing services as you see results.
With the right tagging strategy and a few simple rules, you can model your most important services in a matter of minutes, then use those insights to report to leadership, optimize resources, maintain uptime and reduce incident noise.
A New Way to Tell the Story of IT
In a world where IT is increasingly expected to drive business results, DSI helps you make the case. It’s how you show that uptime is measured beyond metrics and 9’s, but with measurable business outcome.
If you’re ready to elevate your monitoring strategy and speak the language of the business, talk to your LogicMonitor team about getting started with DSI today.
Ready to explore Dynamic Service Insights within LogicMonitor Envision?
With over 12 years of experience, Ismath is a dynamic product marketing leader known for crafting impactful messaging, executing successful product launches, and driving strategic marketing initiatives for enterprises and growing SaaS companies. A proven collaborator, Ismath excels at building relationships across product, sales, and leadership teams, while consistently delivering high-priority solutions.
Disclaimer: The views expressed on this blog are those of the author and do not necessarily reflect the views of LogicMonitor or its affiliates.