Sometimes you just have to do it yourself. When managing proprietary applications, there is no suite of utilities available - you will likely have to implement your own solutions. Custom solutions, however, still require monitoring. This blog will demonstrate how TechOps at LogicMonitor has implemented custom monitoring for some of our internal tools.
9 min read
November 3, 2016
In this article
NEWSLETTER
Subscribe to our newsletter
Get the latest blogs, whitepapers, eGuides, and more straight into your inbox.
Thank you!
Your video will begin shortly
SHARE
In this article
Sometimes you just have to do it yourself. When managing proprietary applications, there is no suite of utilities available – you will likely have to implement your own solutions. Custom solutions, however, still require monitoring. This blog will demonstrate how TechOps at LogicMonitor has implemented custom monitoring for some of our internal tools.
Back in May, we announced the release of our proprietary Time Series Database (TSDB) for storing your data. We didn’t announce all of the internal tools required to support our new TSDB. Development provided a great TSDB, but not the tools needed to run it in production, so we on the TechOps team set out to build some of the operational infrastructure to backup user data from the new TSDB architecture.
Once we had a working system in place to back up all of your TSDB data, we needed to monitor that system. Without going into detail, I’ll say that our TSDB backup system has several components that need to be monitored, including a metadata database, external storage, backup agents, and a centralized backup scheduler, along with with performance metrics such as network throughput, CPU utilization, memory utilization, and disk performance.
Most of this stuff is a piece of cake to monitor right out of the box using LogicMonitor, but our bespoke backup agents and scheduler were both written in Go, the efficient and scalable open source programming language from Google, and didn’t inherently lend themselves to monitoring. The rest of this blog will cover just how simple it was to expose custom metrics from these Go applications and monitor them with LogicMonitor.
Overview
Go makes it unbelievably simple to create a simple HTTP server inside of any application. This functionality, combined with LogicMonitor’s Webpage data collection method, allowed us to quickly expose custom metrics from our code and start using that data to monitor our infrastructure.
Exposing Application Metrics
The most difficult part of the process is determining exactly which metrics you want to expose from your code. Since every system and application is different, I’ll start with the basics and provide an example of using the Go runtime library to expose performance metrics about the Go runtime itself:
import ( "encoding/json" "log" "net/http" "runtime")
func Performance(w http.ResponseWriter, req *http.Request) { results := make(map[string]float32)
// get number of Goroutines // https://golang.org/pkg/runtime/#NumGoroutine numRoutines := runtime.NumGoroutine() results["GoRoutines"] = float32(numRoutines)
// get memory stats // https://golang.org/pkg/runtime/#MemStats var memStats runtime.MemStats runtime.ReadMemStats(&memStats)
// bytes allocated and not yet freed results["MemAlloc"] = float32(memStats.Alloc) // number of frees results["MemFrees"] = float32(memStats.Frees) // bytes allocated and not yet freed results["MemHeapAlloc"] = float32(memStats.HeapAlloc) // bytes in idle spans results["MemHeapIdle"] = float32(memStats.HeapIdle) // bytes in non-idle span results["MemHeapInUse"] = float32(memStats.HeapInuse) // total number of allocated objects results["MemHeapObjects"] = float32(memStats.HeapObjects) // bytes obtained from system results["MemHeapSys"] = float32(memStats.HeapSys) // number of mallocs results["MemMallocs"] = float32(memStats.Mallocs) // total number of garbage collections results["MemNumGc"] = float32(memStats.NumGC) //total time that the garbage collector has paused the program results["MemPauseTotalNs"] = float32(memStats.PauseTotalNs) // bytes obtained from system results["MemSys"] = float32(memStats.Sys) resp, err := json.Marshal(results) if err != nil { log.Printf("error: couldn't marshal queue metrics to json") w.WriteHeader(http.StatusInternalServerError) } else { w.Write(resp) }}
This block of code will return a JSON string containing metrics about the Go runtime, exemplified by the following:
The metrics you’re able to expose are only limited by your imagination. You’re able to write whatever code you need to grab a given metric from your application, convert it to JSON, and respond. Here’s a basic outline:
import (
 "encoding/json"
 "log"
 "net/http"
)

func FooMetric(w http.ResponseWriter, req *http.Request) {
 // Calculate or retrieve your datapoint here
 results := getFooMetric()

 resp, err := json.Marshal(results)
 if err != nil {
  log.Printf("error: couldn't marshal queue metrics to json")
  w.WriteHeader(http.StatusInternalServerError)
 } else {
  w.Write(resp)
 }
}
Serving Application Metrics
Once you’ve assembled a few functions to compile the metrics you need, it’s trivial to spin up a simple HTTP server and expose the metrics from your app:
import (
 "log"
 "net/http"
)

func StartServer() error {
 // https://golang.org/pkg/net/http
 // Create a multiplexer to handle request routing
 h := http.NewServeMux()

 // Add resource handlers to route requests
 // The first argument, 'pattern', is used to match a request path
 // and forward that request to the function specified by the
 // second argument, 'handler'
 // https://golang.org/pkg/net/http/#HandleFunc
 //
 // In this case, we're mapping the URL
 // https://localhost:8080/stats/performance
 // to the function we created above name Performance and mapping
 // https://localhost:8080/stats/foo to the function FooMetric
 h.HandleFunc("/stats/performance", Performance)
 h.HandleFunc("/stats/foo", FooMetric)

 // Create the HTTP server, passing in desired listener port,
 // our multiplexer, and some timeout configurations
 // https://golang.org/pkg/net/http/#Server
 srv := &http.Server{
  Addr: 8080,
  Handler: h,
  ReadTimeout: 10 * time.Second,
  WriteTimeout: 10 * time.Second,
 }


 // Start the HTTP server
 // https://golang.org/pkg/net/http/#Server.ListenAndServe
 log.Printf("info: Stats server started on localhost" + statsPort)
 log.Fatal(srv.ListenAndServe())
 return nil
}
Bonus Go also makes it extremely easy to output a real-time stack trace (which isn’t particularly applicable for using an application with LogicMonitor, but too useful not to share), as exemplified in the following:
That’s it! Now you can serve this function from your HTTP server and view a stacktrace in your browser. Just add h.HandleFunc(“/stacktrace”, Stacktrace) to your HTTP server handlers.
Putting It All Together
In order to facilitate inserting our code into your existing application, I’ll put everything together in a struct and then demonstrate how to include this HTTP server in your application’s startup.
Here’s our completed struct:
package app

 import (
  "encoding/json"
  "log"
  "net/http"
  "runtime"
 )

 const statsPort = ":8080"

 type StatsServer struct {}

 func s *StatsServer) Performance(
  w http.ResponseWriter,
  req *http.Request,
 ) {
  results := make(map[string]float32)

  // get number of Goroutines
  // https://golang.org/pkg/runtime/#NumGoroutine
  numRoutines := runtime.NumGoroutine()
  results["GoRoutines"] = float32(numRoutines)

  // get memory stats
  // https://golang.org/pkg/runtime/#MemStats
  var memStats runtime.MemStats
  runtime.ReadMemStats(&memStats)

  // bytes allocated and not yet freed
  results["MemAlloc"] = float32(memStats.Alloc)

  // number of frees
  results["MemFrees"] = float32(memStats.Frees)

  // bytes allocated and not yet freed
  results["MemHeapAlloc"] = float32(memStats.HeapAlloc)

  // bytes in idle spans
  results["MemHeapIdle"] = float32(memStats.HeapIdle)

  // bytes in non-idle span
  results["MemHeapInUse"] = float32(memStats.HeapInuse)

  // total number of allocated objects
  results["MemHeapObjects"] = float32(memStats.HeapObjects)

  // bytes obtained from system
  results["MemHeapSys"] = float32(memStats.HeapSys)

  // number of mallocs
  results["MemMallocs"] = float32(memStats.Mallocs)
  // total number of garbage collections
  results["MemNumGc"] = float32(memStats.NumGC)

  //total time that the garbage collector has paused the program
  results["MemPauseTotalNs"] = float32(memStats.PauseTotalNs)

  // bytes obtained from system
  results["MemSys"] = float32(memStats.Sys)

  resp, err := json.Marshal(results)
  if err != nil {
   log.Printf("error: couldn't marshal queue metrics to json")
   w.WriteHeader(http.StatusInternalServerError)
  } else {
   w.Write(resp)
  }
 }

 func (s *StatsServer) Stacktrace(
 w http.ResponseWriter,
 req *http.Request,
 ) {
  buf := make([]byte, 1<<16)
  runtime.Stack(buf, true)

  w.Write(buf)
 }

 func s *StatsServer) StartServer() error {
  // https://golang.org/pkg/net/http

  // Create a multiplexer to handle request routing
  h := http.NewServeMux()

  // Add resource handlers to route requests
  // The first argument, 'pattern', is used to match a request path
  // and forward that request to the function specified by the
  // second argument, 'handler'
  // https://golang.org/pkg/net/http/#HandleFunc
  //
  // In this case, we're mapping the URL
  // https://localhost:8080/stats/performance
  // to the function we created above name Performance and mapping
  // https://localhost:8080/stats/foo to the function FooMetric
  h.HandleFunc("/stats/performance", Performance)
  h.HandleFunc("/stats/foo", FooMetric)

  // Create the HTTP server, passing in desired listener port,
  // our multiplexer, and some timeout configurations
  // https://golang.org/pkg/net/http/#Server
  srv := &http.Server{
   Addr: 8080,
   Handler: h,
   ReadTimeout: 10 * time.Second,
   WriteTimeout: 10 * time.Second,
  }

  // Start the HTTP server
  // https://golang.org/pkg/net/http/#Server.ListenAndServe
  log.Printf("info: Stats server started on localhost" + statsPort)
  log.Fatal(srv.ListenAndServe())
  return nil
 }
Now, including the HTTP server in our app is as simple as adding the lines below to the application’s startup function.
// initialize monitoring metric server
// NOTE: We must start the server as a go function or ListenAndServe
// will block further code execution
go func() {
 stats := StatsServer{}
 stats.StartServer()
}()
You can now view your metrics by sending HTTP requests to the application.
Now that your app is serving data, it’s time to start monitoring.
Bringing Everything Together Inside LogicMonitor
Consuming your exposed metrics is incredibly simple using a Webpage Datasource.
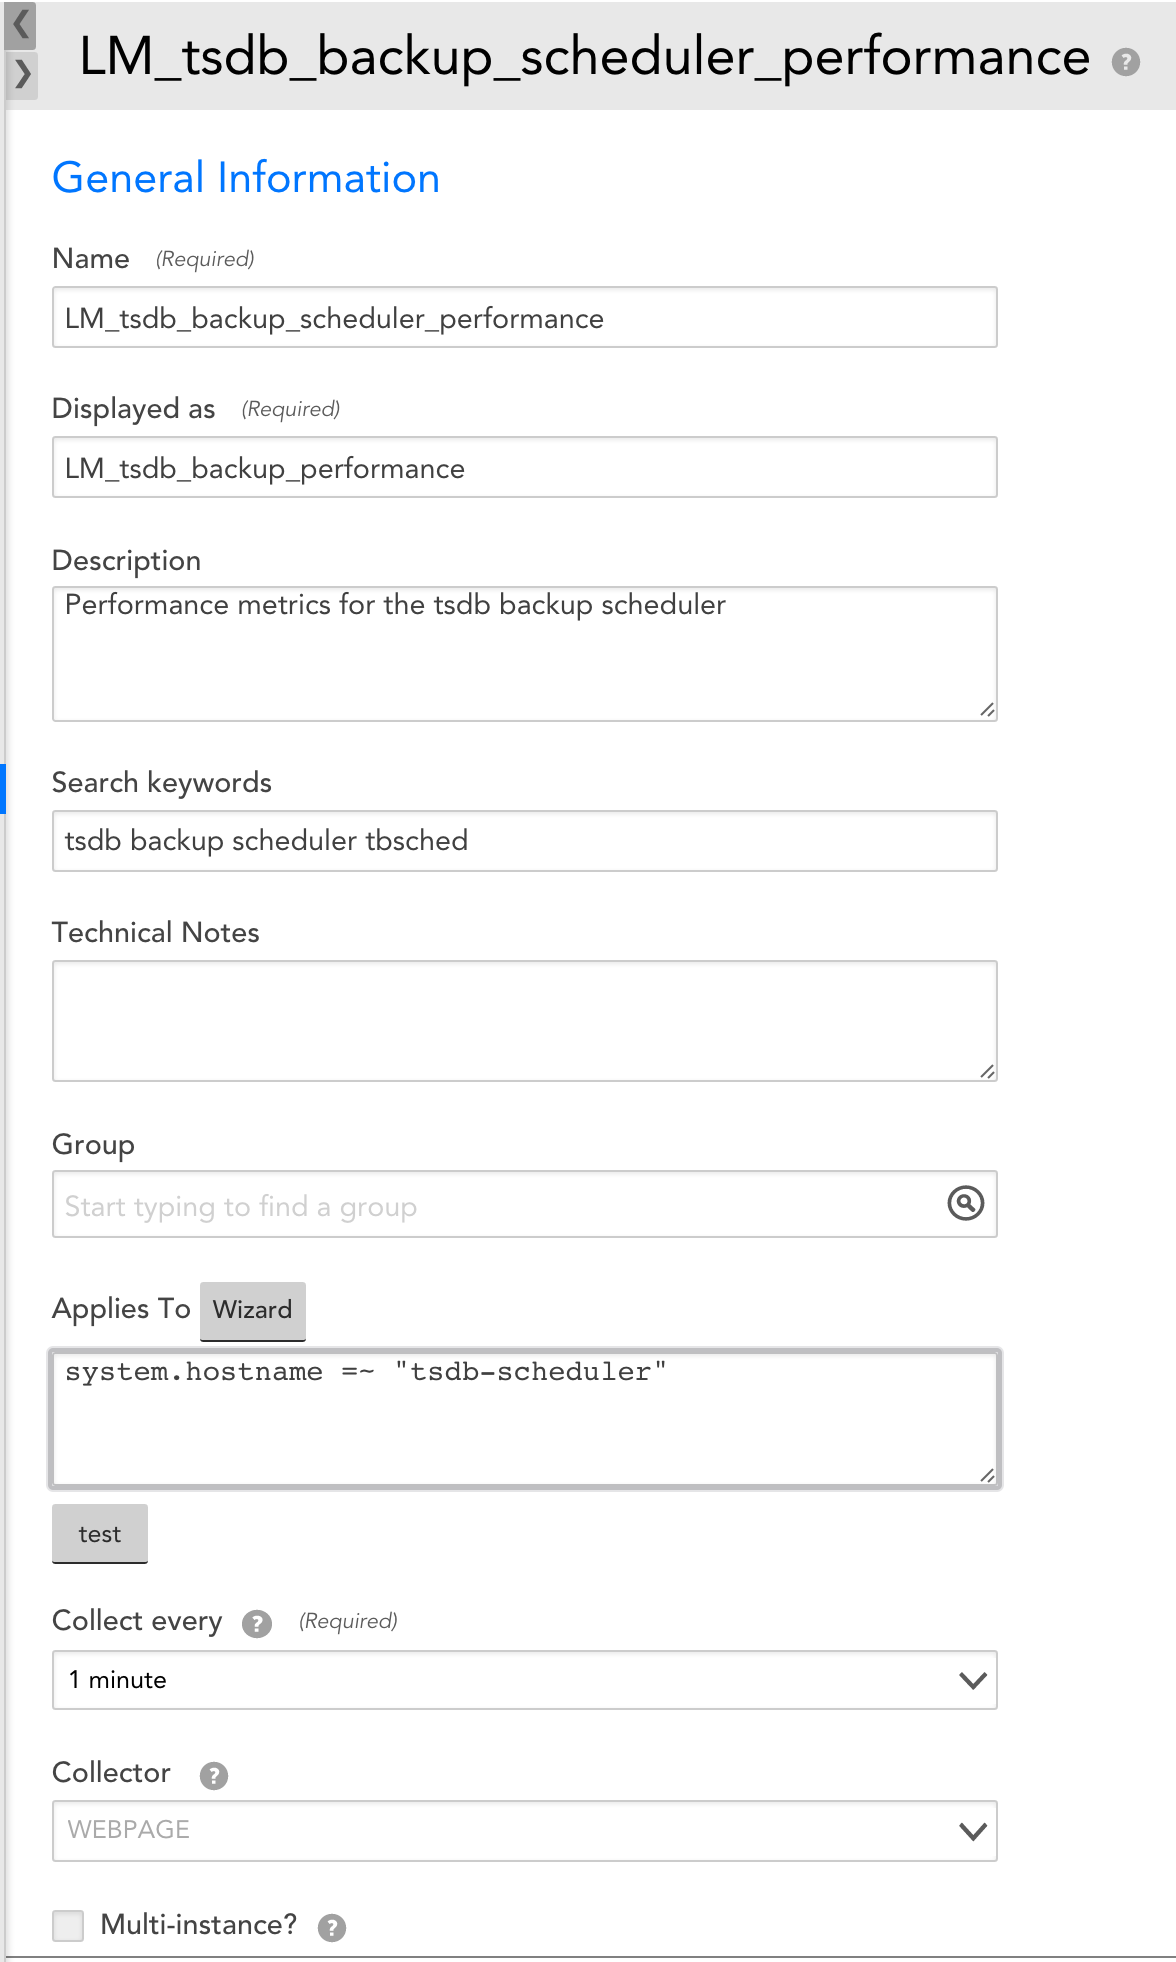
For example, here’s how we configured the datasource to monitor the performance of our TSDB backup scheduler:
The value system.hostname in the Applies-To is configured to match any and all of the servers where you may be running this application.
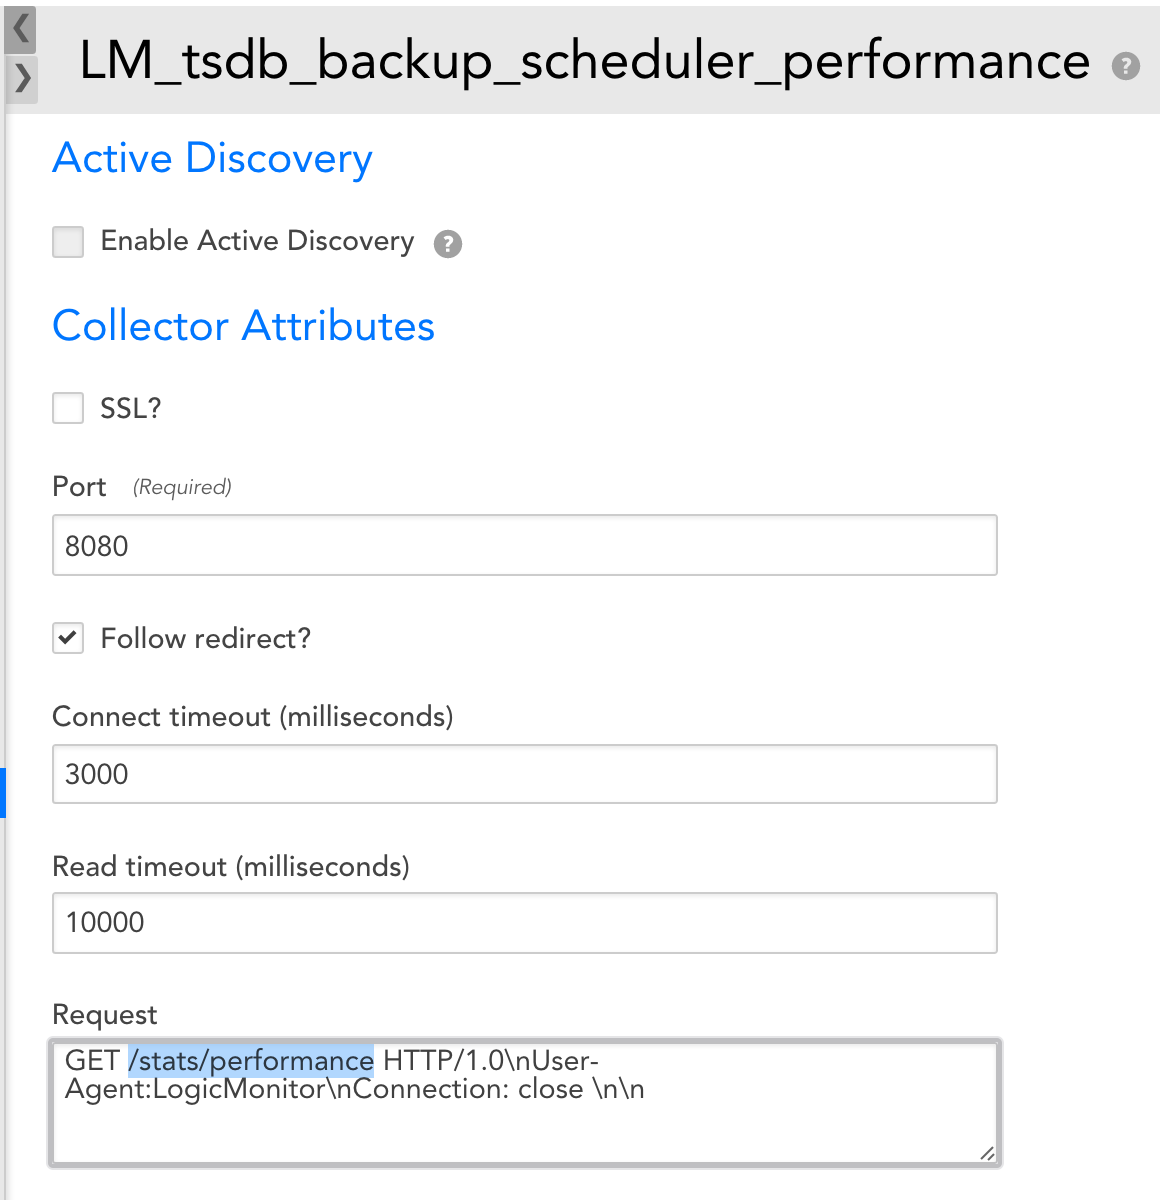
Notice that we’re using the resource endpoint configured in our Go HTTP server.
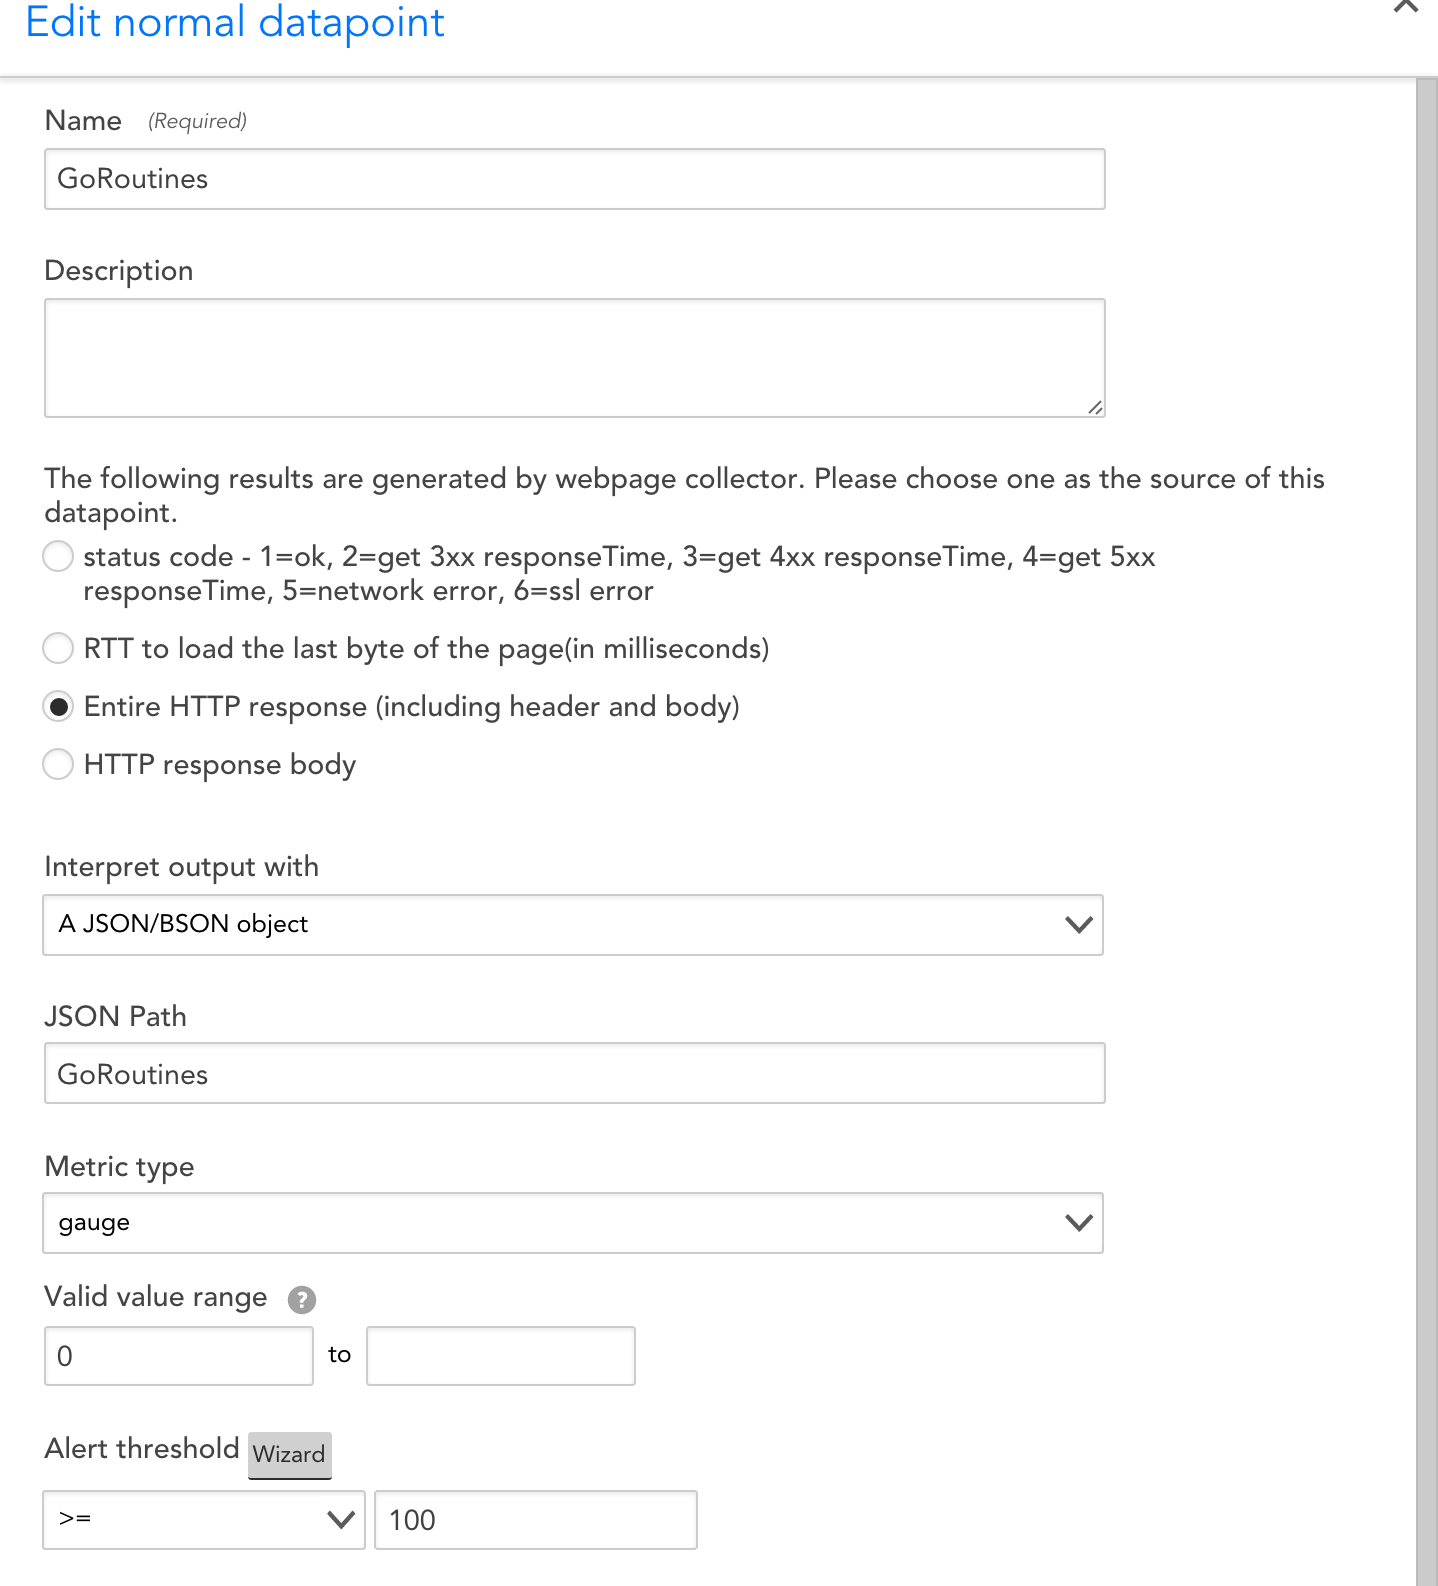
For the final step, here’s an example of adding a JSON datapoint to your datasource:
Make sure to update the JSON Path field to match the path to a given datapoint within the JSON response.
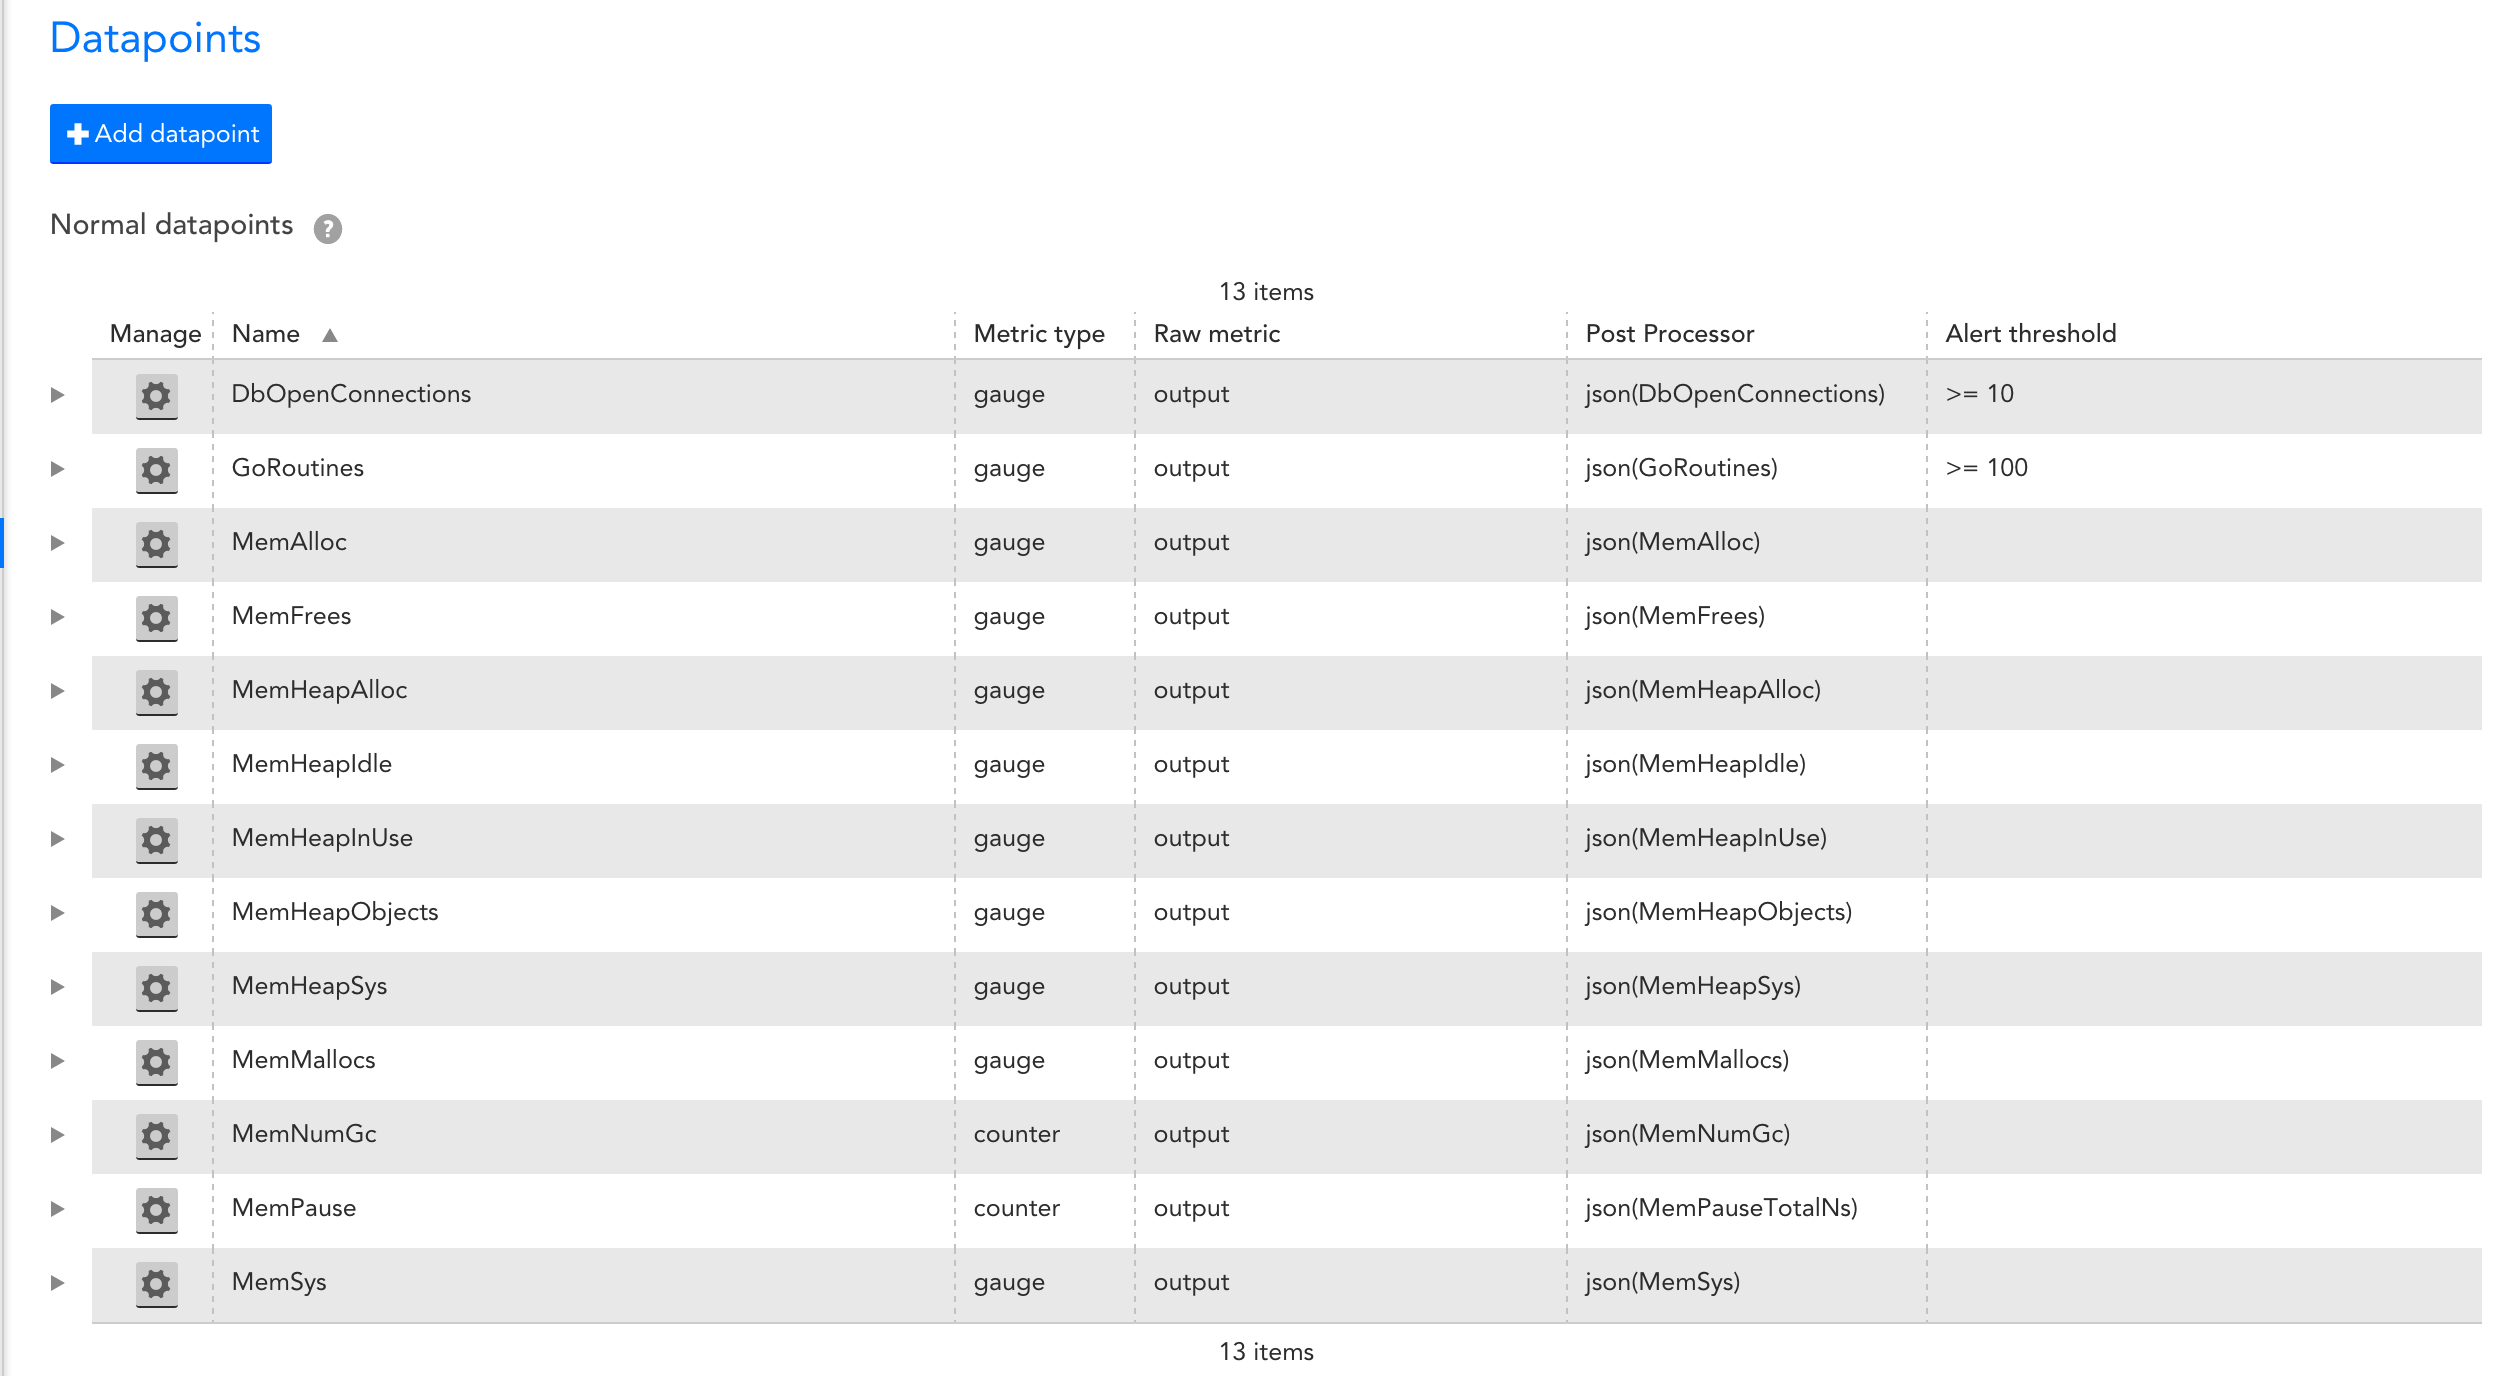
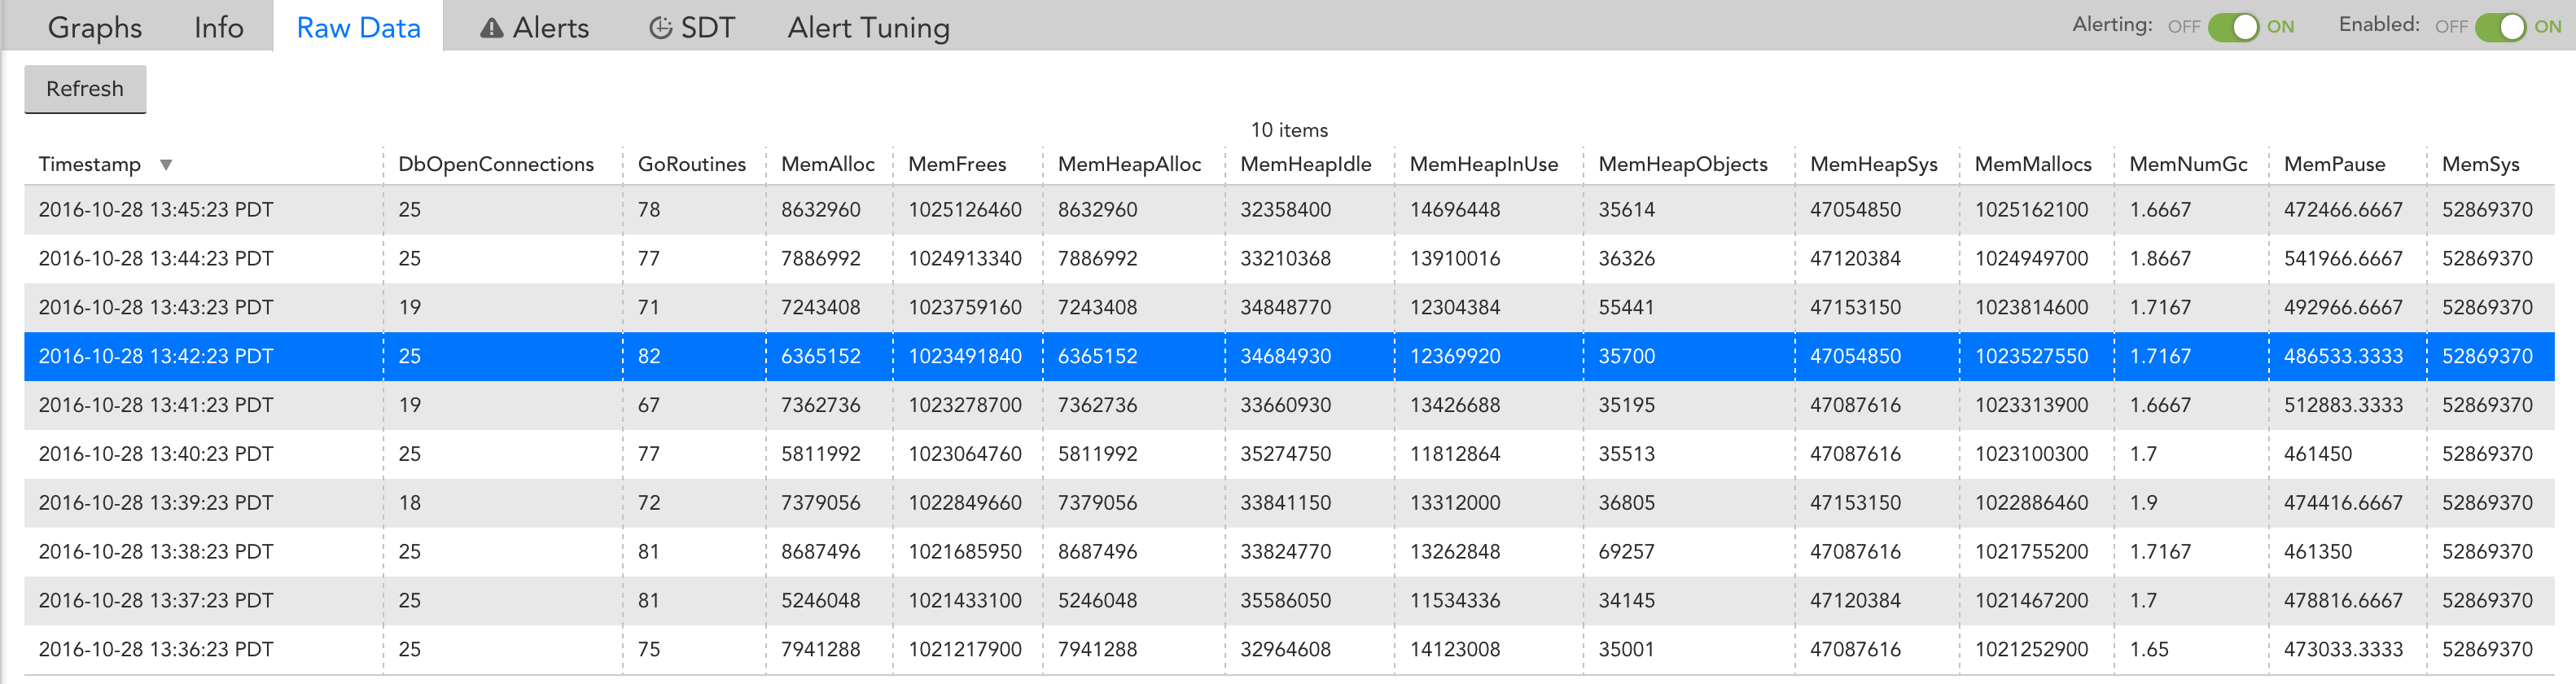
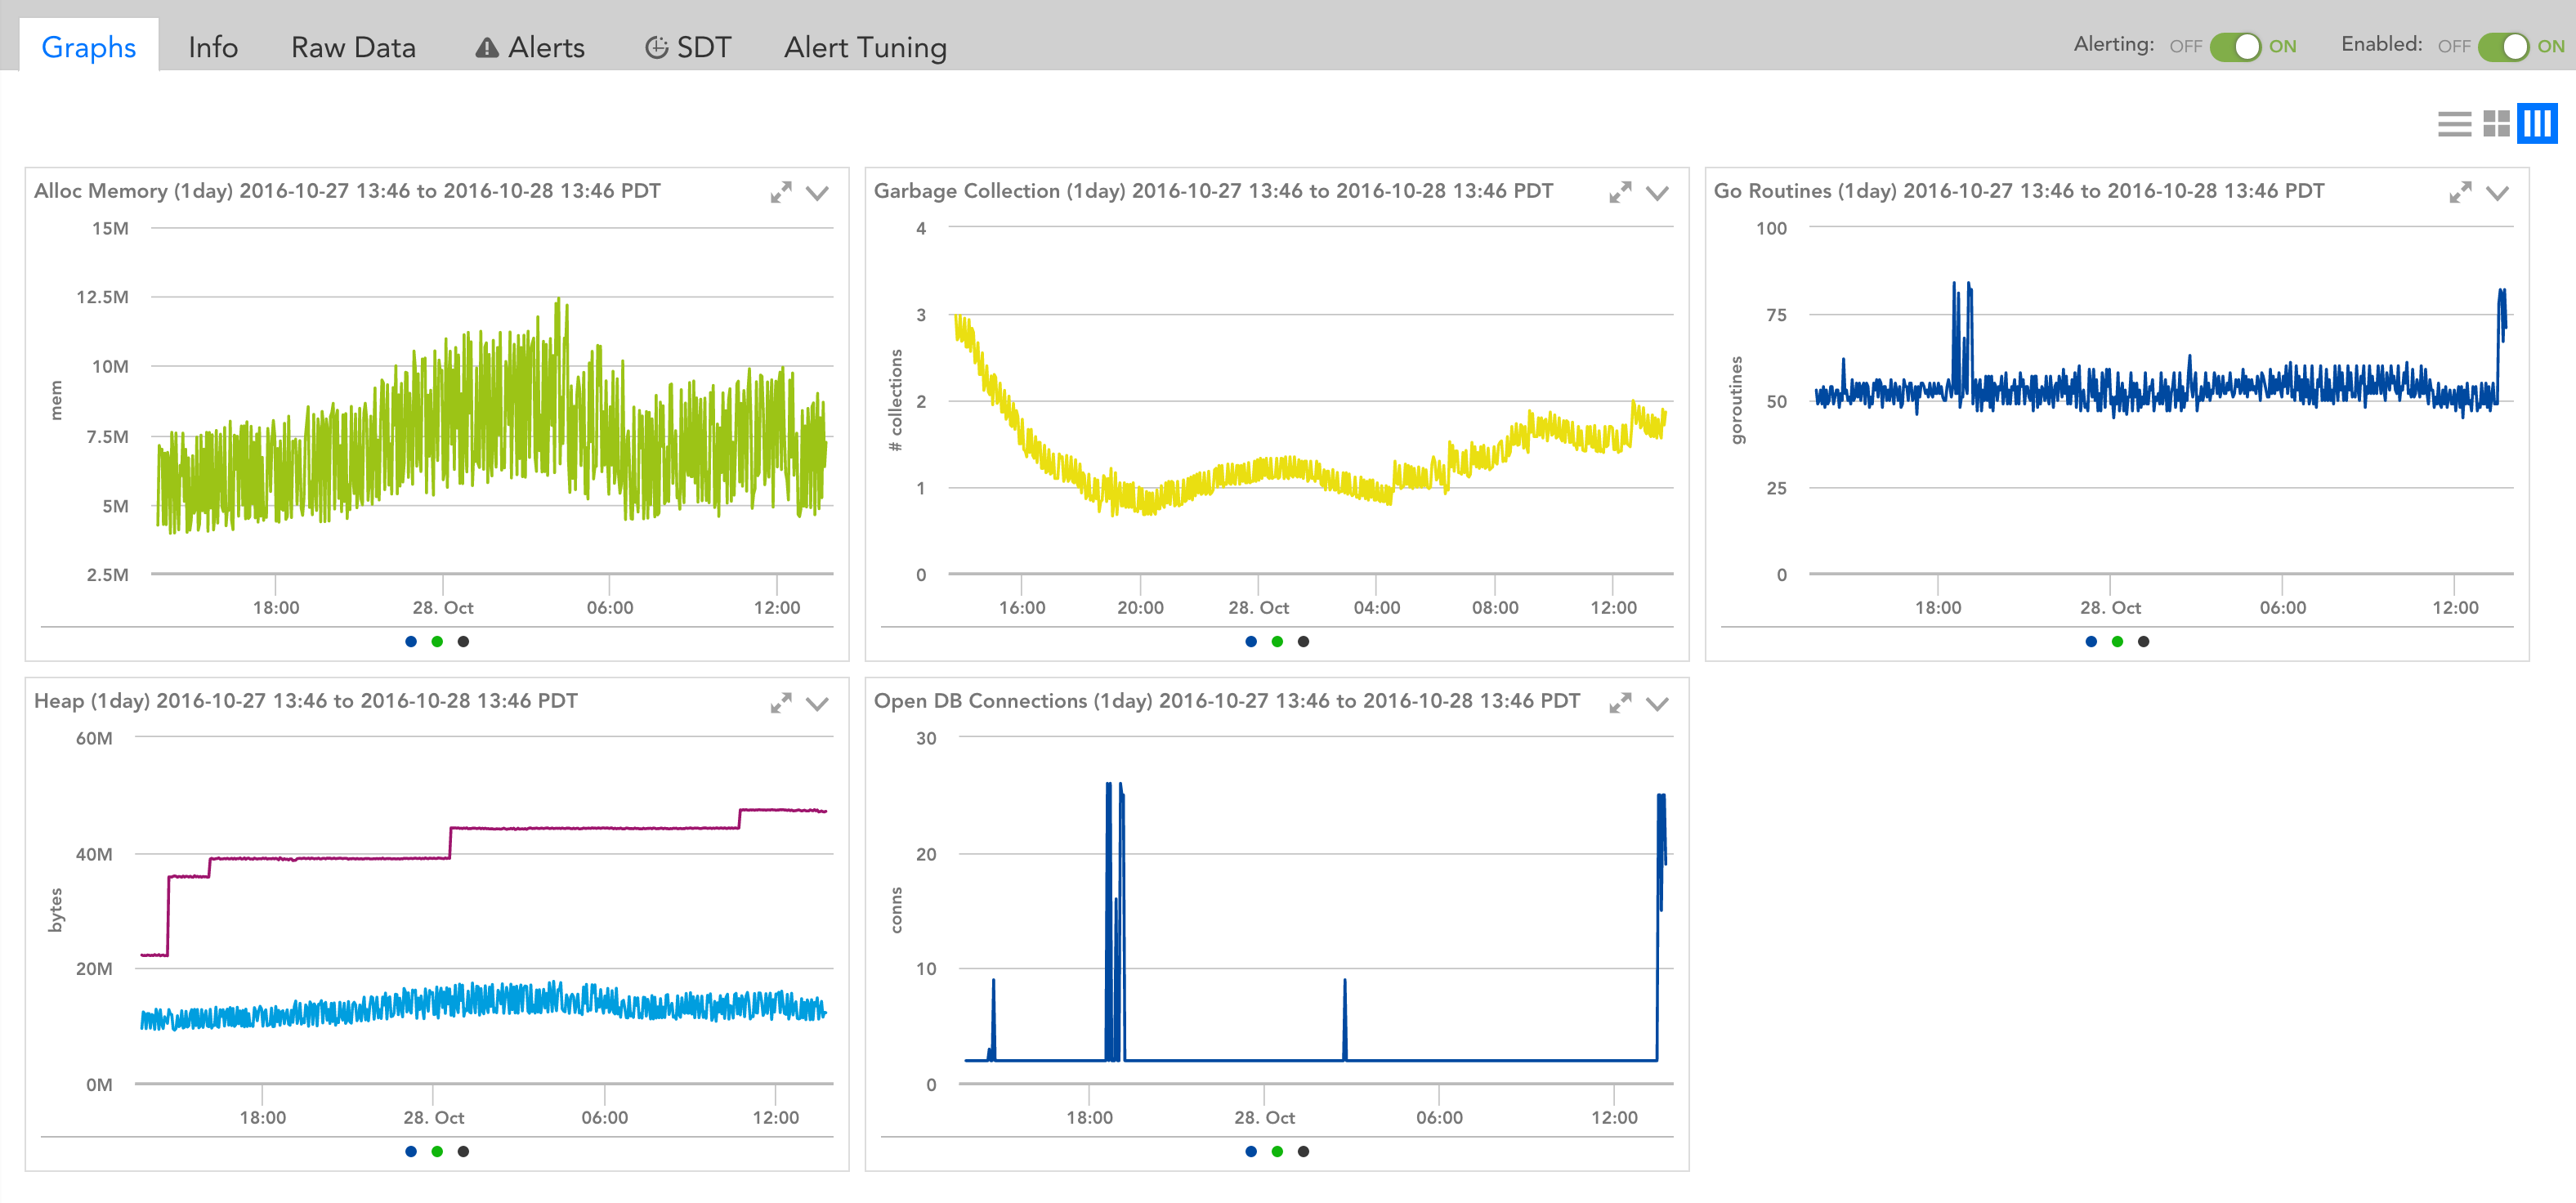
That’s it! LogicMonitor is now collecting data from the application. Metrics can be viewed by navigating to the monitored device and locating the datasource.
Notice the datapoints corresponding to the runtime metrics exposed in the Go code.
Now we can be confident that if, for any reason, backups of customer data are not completing in a timely manner, our Operations team will know about it in a timely manner. After all, even if you are not instrumenting your custom applications, there are still two monitoring systems that will tell you about issues – your customers and your boss. We want to make sure that we know of, and can address, any issue before those two systems trigger.
Disclaimer: The views expressed on this blog are those of the author and do not necessarily reflect the views of LogicMonitor or its affiliates.