

Use this guide to write a DotNet (.Net) application emitting traces using the OpenTelemetry Protocol (OTLP) Specification. All you need is .NET Framework 4.6.2+ or .NET Core 2.1+ and a basic understanding of developing applications on the .Net framework.
Initialize New Project
First, we will create a new console application and add the following packages to enable OpenTelemetry. These can either be installed using an IDE or by a command line like below.
dotnet new console --output getting-started
// Add dotnet packagesdotnet add package Opentelemetrydotnet add package Opentelemetry.Exporter.OpentelemetryProtocol
Create Resource Detectors
A resource describes the object that generated the telemetry signals. Essentially, it must be the name of the service or application. OpenTelemetry has defined the standards to describe the service execution env, viz. hostname, hostType (cloud, container, serverless), namespace, cloud-resource-id, etc.
In this example, we are defining the resource with a few env var settings of the application.
 var resourceList = new List<KeyValuePair<string, object>>();
 resourceList.Add(newKeyValuePair<string,object>
("service.namespace","US-West-1"));
 resourceList.Add(new KeyValuePair<string, object>("host.name",
"prodsvc.us-west-1.example.com"));
 resourceList.Add(new KeyValuePair<string, object>("host.type",
"system"));
Construct TracerProvider
The sdk/trace package contains support for OpenTelemetry distributed tracing. TracerProvider is the entry point of the OpenTelemetry API.
Here, CreateTracerProviderBuilder returns a new and configured TracerProvider.
 TracerProviderBuilder tracerProvider =
Sdk.CreateTracerProviderBuilder();
Configure Resource Builder
The AddService method of ResourceBuilder can be used to add the following attributes to Resource:
- string serviceName
- string serviceNamespace
- string serviceVersion
- bool autoGeneratedServiceInstanceId → if false, the fifth parameter must be set
- string serviceInstanceId
The following document defines standard attributes for resources. Resource Builder Specification.
 string serviceName = "product-service";
 string instanceId = "product-service-instance-id";
 tracerProvider.AddAspNetCoreInstrumentation();
 tracerProvider.SetResourceBuilder(ResourceBuilder.CreateDefault()
      .AddService(serviceName, null, null, false,
$"{instanceId}").AddAttributes(resourceList));
 tracerProvider.SetSampler(new AlwaysOnSampler());
 tracerProvider.AddSource("TestActivitySource");
Init Trace Exporter
You can configure the OtlpExporter through OtlpExporterOptions properties:
- Endpoint: Target to which the exporter is going to send traces or metrics. The endpoint must be a valid Uri with the scheme (HTTP or HTTPS) and host and may contain a port and path.
- Headers: Optional headers for the connection.
- TimeoutMilliseconds: Max waiting time for the backend to process a batch.
- ExportProcessorType: Whether the exporter should use Batch or Simple exporting processor.
- BatchExportProcessorOptions: Configuration options for the batch exporter. Only used if ExportProcessorType is set to Batch.
We need to set the OTLP_ENDPOINT environment variable in order to send traces to the collector using the OTLP exporter.
var otlpEndpoint =Environment.GetEnvironmentVariable("OTLP_ENDPOINT")
??"http://localhost:55680";
 tracerProvider.AddOtlpExporter(opt => opt.Endpoint =
new Uri(otlpEndpoint)).Build();
Create Tracer
Using OpenTelemetry.API Shim is only recommended if you want to use OpenTelemetry terminology like Tracer and Span instead of ActivitySource and Activity.
In the following example, we are using OpenTelemetry.API Shim to generate spans.
var tracer = TracerProvider.Default.GetTracer("TestActivitySource");Create a Span and Define Span Attributes
A span is a single execution of an operation. It is identified by a set of attributes, which are sometimes referred to as span tags. Application owners are free to choose the attributes which can capture required information for the spans. There is no limit to the number of span attributes per span.
In this example, we are defining two-span attributes for our sample applications.
using (var parentSpan = tracer.StartActiveSpan("parent span"))
       {
           parentSpan.SetAttribute("priority", "business.priority");
           parentSpan.SetAttribute("prodEnv", true);
           parentSpan.UpdateName("parent span new name");
  }
Add Events/Logs to Spans
Spans can be enriched with some execution logs/events that happened during the execution of the span. This information will help provide contextual logs always tied up with the respective span.
 var childSpan = tracer.StartSpan("child span");
 childSpan.AddEvent("Authentication").SetAttribute("Username",
"value").SetAttribute("Id", 101);
 childSpan.SetStatus(OpenTelemetry.Trace.Status.Ok);
 childSpan.End();
Putting It Together
using System;
using System.Collections.Generic;
using OpenTelemetry;
using OpenTelemetry.Resources;
using OpenTelemetry.Trace;

public class Program
{
   public static void Main()
   {
       // Only Required when using insecure (http) endpoint
AppContext.SetSwitch("System.Net.Http.SocketsHttpHandler.
   Http2UnencryptedSupport", true);

      var resourceList = new List<KeyValuePair<string, object>>();
      resourceList.Add(new KeyValuePair<string, object>("service.namespace",
         "US-West-1"));
      resourceList.Add(new KeyValuePair<string, object>("host.name",
   "prodsvc.us-west-1.example.com"));
      resourceList.Add(new KeyValuePair<string, object>("host.type",
   "system"));

      TracerProviderBuilder tracerProvider =Sdk.CreateTracerProviderBuilder();

      string serviceName = "product-service";
      string instanceId = "product-service-instance-id";
      tracerProvider.AddAspNetCoreInstrumentation();
      tracerProvider.SetResourceBuilder(ResourceBuilder.CreateDefault()
      .AddService(serviceName, null, null, false,
 	$"{instanceId}").AddAttributes(resourceList));
      tracerProvider.SetSampler(new AlwaysOnSampler());
      tracerProvider.AddSource("TestActivitySource");

      var otlpEndpoint = Environment.GetEnvironmentVariable("OTLP_ENDPOINT")
 	?? "http://localhost:55680";
      tracerProvider.AddOtlpExporter(opt => opt.Endpoint = new
 	Uri(otlpEndpoint)).Build();
      var tracer = TracerProvider.Default.GetTracer("TestActivitySource");

      using (var parentSpan = tracer.StartActiveSpan("parent span"))
      {
           parentSpan.SetAttribute("priority", "business.priority");
           parentSpan.SetAttribute("prodEnv", true);
           parentSpan.UpdateName("parent span new name");

           var childSpan = tracer.StartSpan("child span");
           childSpan.AddEvent("Authentication").SetAttribute("Username",
 	   "value").SetAttribute("Id", 101);
           childSpan.SetStatus(OpenTelemetry.Trace.Status.Ok);
           childSpan.End();
       }
   }
}
Run The Application
Finally, we run this instrumented application to get traces in the LogicMonitor platform.
dotnet run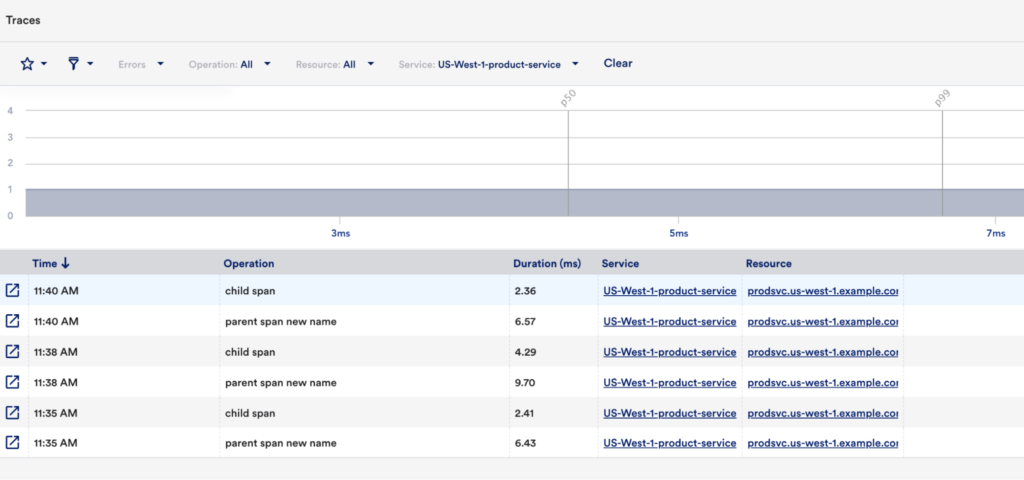
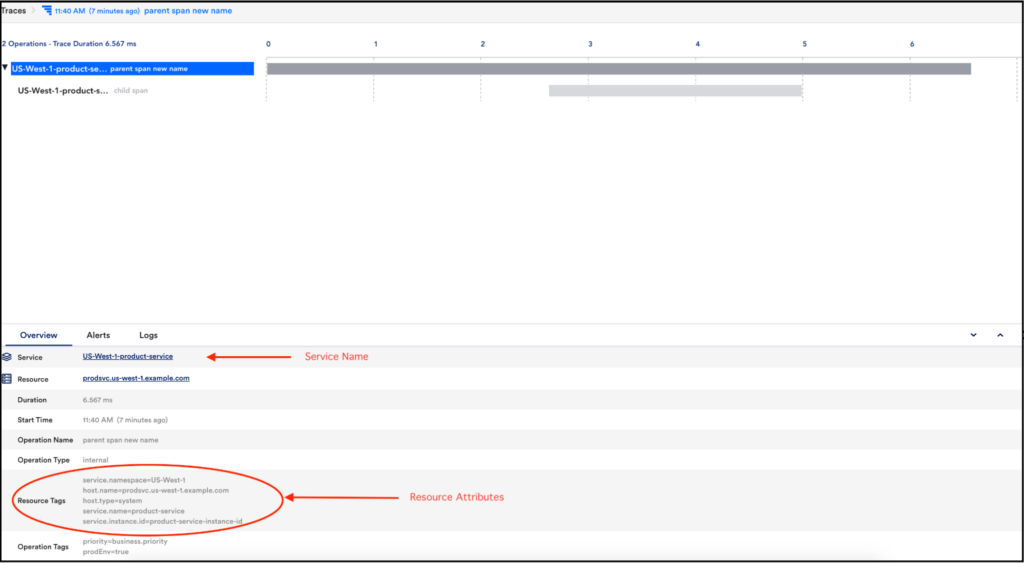
Constructed Trace
Resource labels:
     -> service.namespace: STRING(US-West-1)
     -> host.name: STRING(prodsvc.us-west-1.example.com)
     -> host.type: STRING(system)
     -> service.name: STRING(product-service)
     -> service.instance.id: STRING(product-service-instance-id)
InstrumentationLibrarySpans #0
InstrumentationLibrary TestActivitySource
Span #0
    Trace ID       : 7b7d18466ee42b45b797a30fbc55f09e
    Parent ID      : 204b306e1ba7124d
    ID             : 8fd6f7414b2a4a4a
    Name           : child span
    Kind           : SPAN_KIND_INTERNAL
    Start time     : 2021-07-26 18:33:25.300514 +0530 IST
    End time       : 2021-07-26 18:33:25.302944 +0530 IST
    Status code    : STATUS_CODE_OK
    Status message :
Attributes:
     -> UserName: STRING(value)
     -> Id: INT(101)
Events:
SpanEvent #0
     -> Name: sample event
     -> Timestamp: 1627304605301466000
     -> DroppedAttributesCount: 0
Span #1
    Trace ID       : 7b7d18466ee42b45b797a30fbc55f09e
    Parent ID      :
    ID             : 204b306e1ba7124d
    Name           : parent span new name
    Kind           : SPAN_KIND_INTERNAL
    Start time     : 2021-07-26 18:33:25.29771 +0530 IST
    End time       : 2021-07-26 18:33:25.334138 +0530 IST
    Status code    : STATUS_CODE_UNSET
    Status message :
Attributes:
     -> priority: STRING(business.priority)
     -> prodEnv: BOOL(true)
Conclusion
Congratulations, you have just written a .Net application emitting traces using the OpenTelemetry Protocol (OTLP) Specification. Feel free to use this code as a reference when you get started with instrumenting your business application with OTLP specifications. LogicMonitor APM specification is 100% OTLP compliant with no vendor lock-in. To receive and visualize traces of multiple services for troubleshooting with the LogicMonitor platform, sign up for a free trial account here. Check back for more blogs covering application instrumentation steps for distributed tracing with OpenTelemetry standards across multiple languages.


