

Kubernetes allows DevOps teams to deploy containerized applications faster and makes managing containers at scale significantly easier. Obtaining visibility into these containerized applications is key to maximizing application/service performance and proactively preventing downtime. Because the availability of containerized workloads relies on Kubernetes orchestration, you should also monitor Kubernetes cluster resources. With LogicMonitor’s new Kubernetes Monitoring Integration you can comprehensively monitor your Kubernetes clusters and the containerized applications running within them, alongside your existing hybrid IT infrastructure in a single pane of glass.
LogicMonitor’s Kubernetes Monitoring integration relies on an application that can be installed via Helm and that runs as one pod in your cluster, which means there’s no need to install an agent on every node. This application listens to the Kubernetes event stream and uses LogicMonitor’s API to ensure that your monitoring is always up to date, even as the resources within the cluster change. Data is automatically collected for Kubernetes nodes, pods, containers, services, and master components (e.g. scheduler, api-server, controller-manager). Pre-configured alert thresholds provide meaningful alerts out of the box. Applications are automatically detected and monitored based on best practices, using LogicMonitor’s extensive library of monitoring templates. This means that you’ll get instant visibility into your containerized applications without the hassle of editing configuration files, having to rely on matching container image names, or manually configuring monitoring. Additionally, LogicMonitor retains this granular performance data for up to two years. Combined, these benefits enable LogicMonitor to monitor your Kubernetes clusters with fewer required tools and processes than alternative solutions.
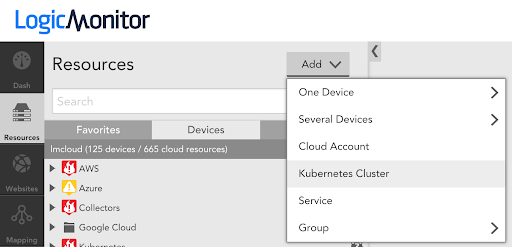
To get started, simply select the ‘Add Kubernetes Monitoring’ option from the Resources page within LogicMonitor:
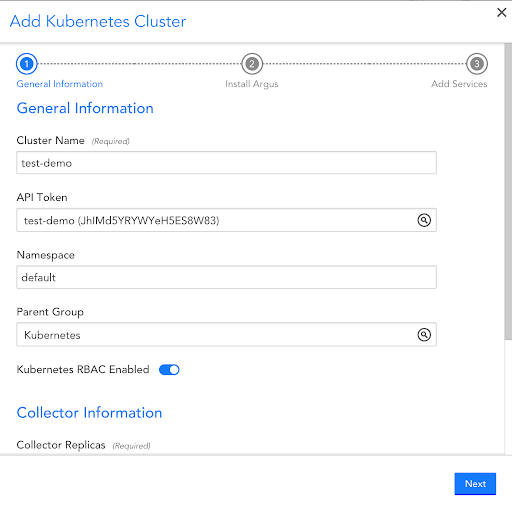
You’ll be prompted to enter in some information about how and where your monitored cluster will display in the LogicMonitor resource tree, as well as what API Tokens will be used, what namespace the integration application should run in, and how many LogicMonitor Collectors you want running:
The information you enter will be used in the next step to display the Helm commands you’ll need for installation:
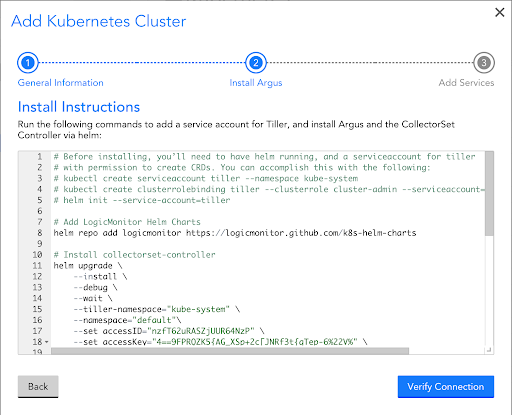
You can copy and paste the helm commands directly to install the integration in your cluster:
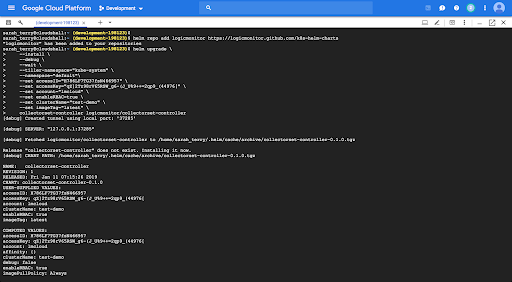
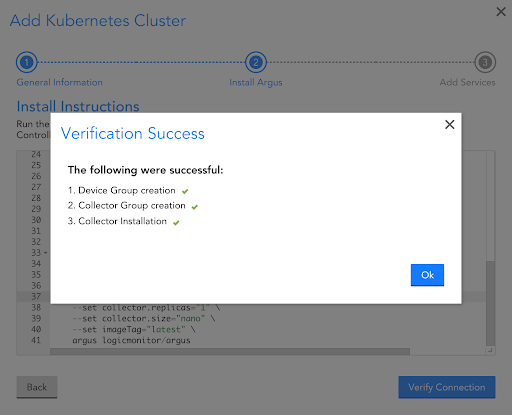
After installing, you should be able to verify that everything was appropriately created in LogicMonitor:
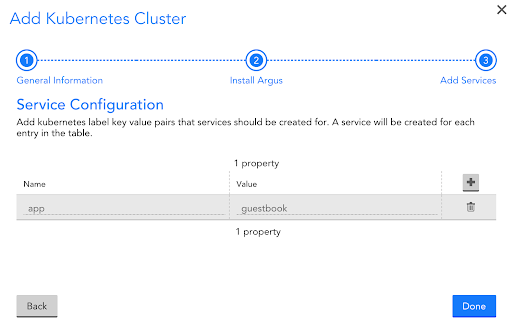
In the last step of the wizard, you can create LogicMonitor Services based on Kubernetes label key-value pairs. This result is a logical service for each label key-value pair that groups together the Nodes and Pods with the label, and aggregates metrics across them to achieve cluster-wide statistics. This enables you to track aggregate health and performance for a specific label, regardless of changes in underlying resources:
After finishing the wizard you’ll see a new Resource Group in LogicMonitor that represents your monitored Kubernetes cluster, a Service Group that includes the services created based on label key-value pairs, and a Dashboard Group that includes automated dashboards that provide instant visibility into your cluster.
The Resource Group includes:
- nodes, grouped by worker-role
- pods, grouped by namespace
- services, grouped by namespace
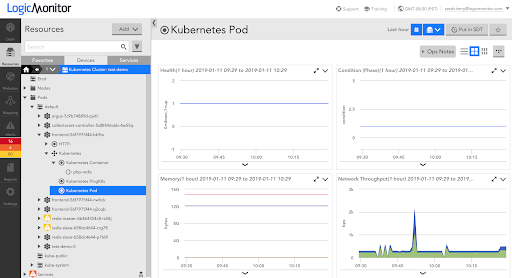
Each of these resources are automatically monitored, and Containers are automatically discovered and monitored for each pod:
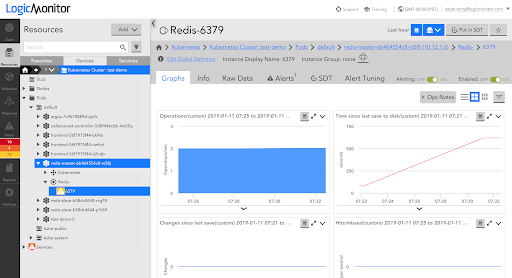
Additionally, containerized applications will be automatically discovered and monitored. For example, this cluster is running the Kubernetes example Guestbook application, and LogicMonitor has automatically applied monitoring for Redis on all Redis pods:
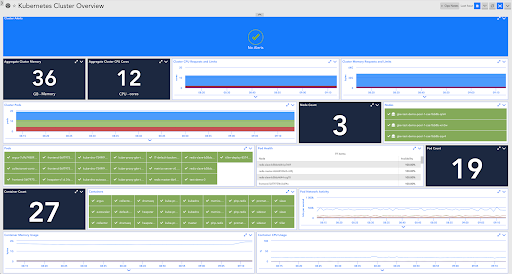
The dashboard shown is created automatically and provides comprehensive visibility into cluster health in an at-a-glance format, so you can easily assess the health of your cluster and even identify where applications are consuming too many resources.
It’s as easy as that! With LogicMonitor you get comprehensive visibility into your Kubernetes environments in minutes, and present it alongside the rest of your cloud and on-premisess infrastructure, all in a single pane of glass.
If you’re not a customer yet and want to check out LogicMonitor’s industry-leading hybrid monitoring capabilities, start your free trial today.


