LM Envision Application Topology: A New Way To Visualize Application Connections
LogicMonitor's application topology visualizes traces in real time, while also allowing you to view logs, alerts, spans and metadata associated with individual services. See how!
Finding service relationships and diagnosing bottlenecks within an application can be incredibly difficult to accomplish, especially if your applications are spread across multiple services, with both internal and external service calls.
Although users could get granular visibility into individual traces using our Distributed Tracing features, they couldn’t see how their services were connected across different traces.
Our new Application Topology makes that painful process a lot easier by allowing you to visualize those relationships in real-time and view any logs, alerts, spans, and metadata associated with individual services. When you send application traces into LogicMonitor, our Envision platform automatically generates topological maps based on ingested data. You can use these maps to view critical metrics like overall throughput, latency, and error rates that are associated with services within your application.
Using Application Topology
To get started with Application Topology, you first need to make sure that your application is sending traces to the LM Envision platform. To get started with Tracing, check out our support docs here.
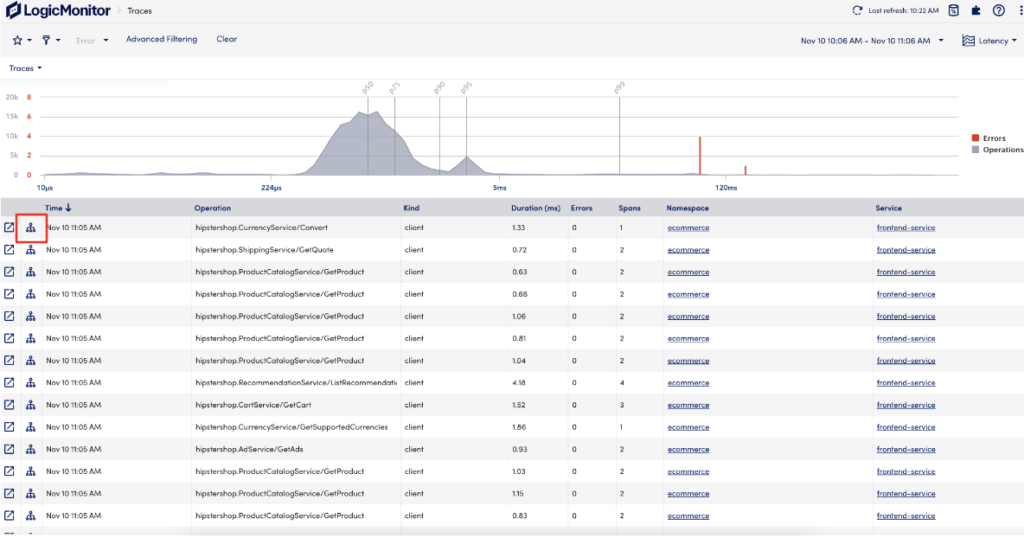
Once traces are sent to LM Envision, navigate to the Traces page within your LogicMonitor portal.
Select the Topology icon in any row in the Traces table to navigate to Application Topology.
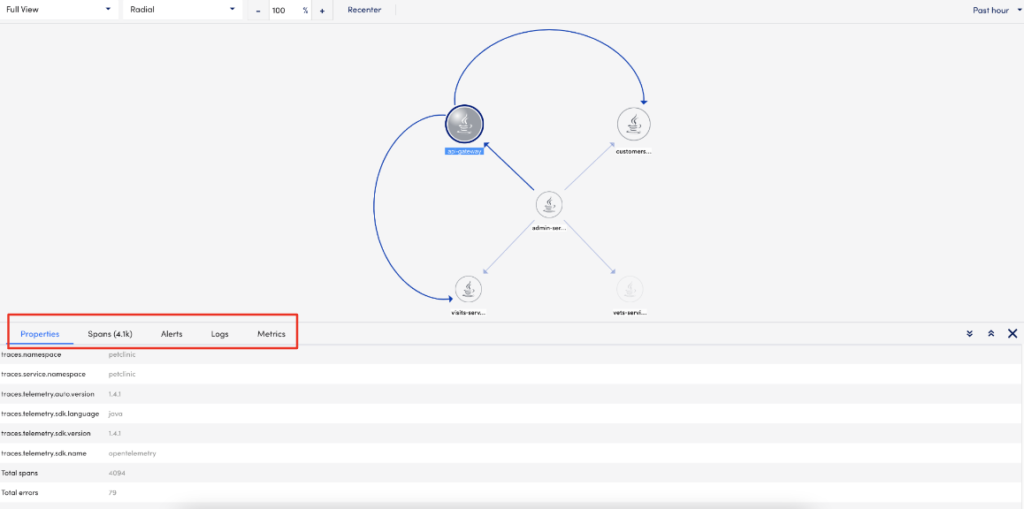
On this page, you can see all of the services within a given namespace (application) and other mission critical details like upstream and downstream dependencies, metadata, alerts, logs, and metrics.
Triage Alerts to the Root Cause
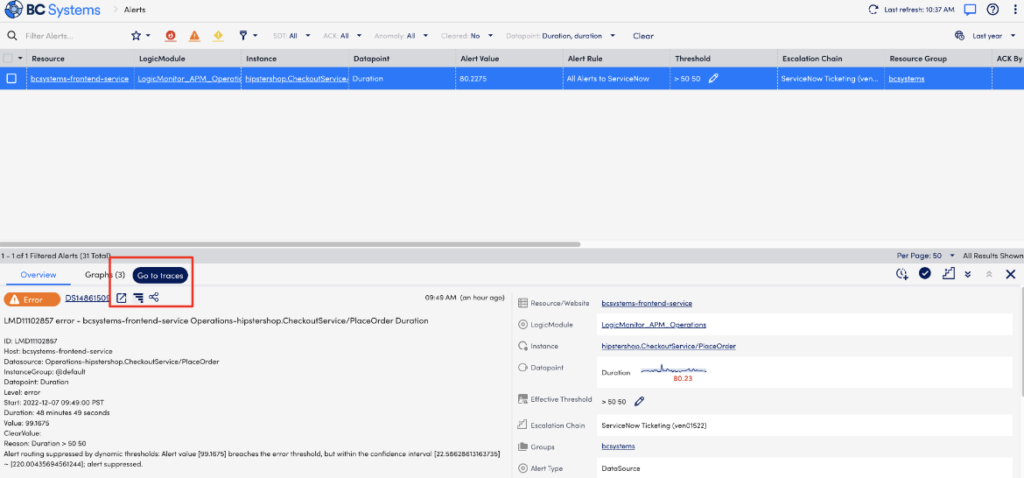
Say you’ve received an alert that one of the services in your application has exceeded an alert threshold, and you need to investigate where the issue is and resolve it quickly.
First, you would navigate to the Alerts page to get a quick overview of the alert details, characteristics, and other high-level information. From here, you could click on the Traces icon to navigate directly to the Traces page for the affected Service in an alert.
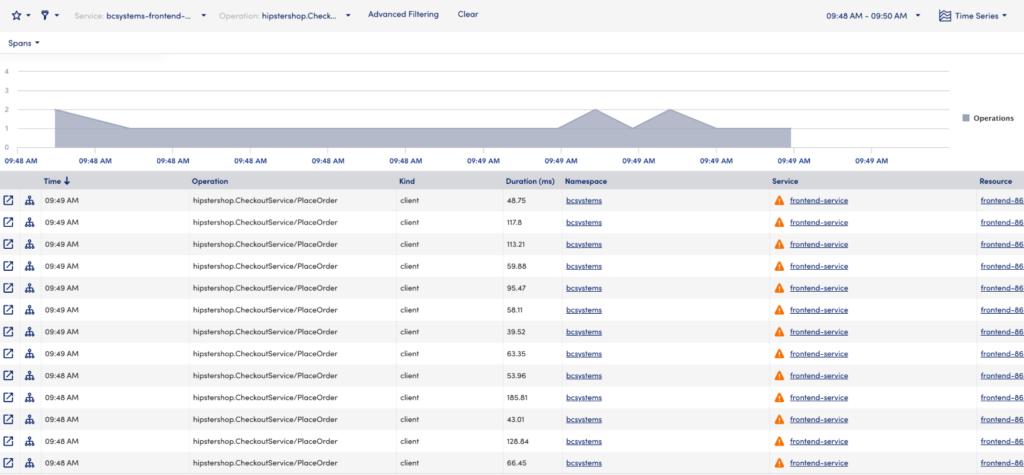
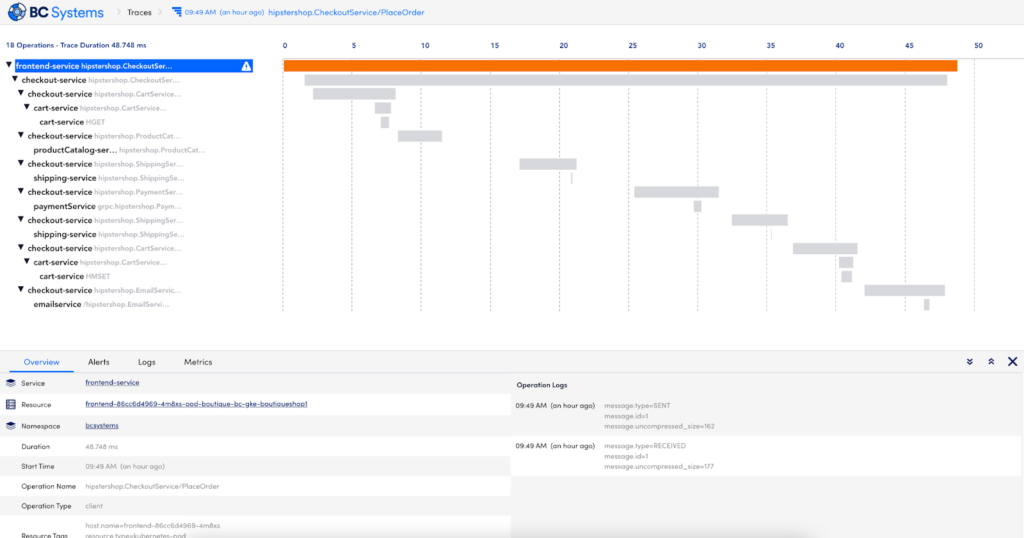
Once here, you’ll see all of the ingested spans that correspond to the alert conditions within the alert’s time range. You can then click on any row within the table to see the full granular trace that was captured and recorded.
On this page, you can see the full timeline of events, how long each of those processes took, see metadata, and any related alerts, logs, and metrics. Most importantly, you can see the exact span that’s causing the alert and logs to determine how to fix the problem.
These views are extremely helpful in identifying a few things:
What’s the overall blast radius for this alert?
How many users were affected?
What’s the exact process or service that caused this alert?
However, answering these questions together to get the full picture is more difficult to accomplish:
Was this an issue in other traces outside of this alert?
Are there any other potential upstream or downstream related issues that I may not have been aware of?
This is where LM Envision’s Application Topology unlocks that insight.
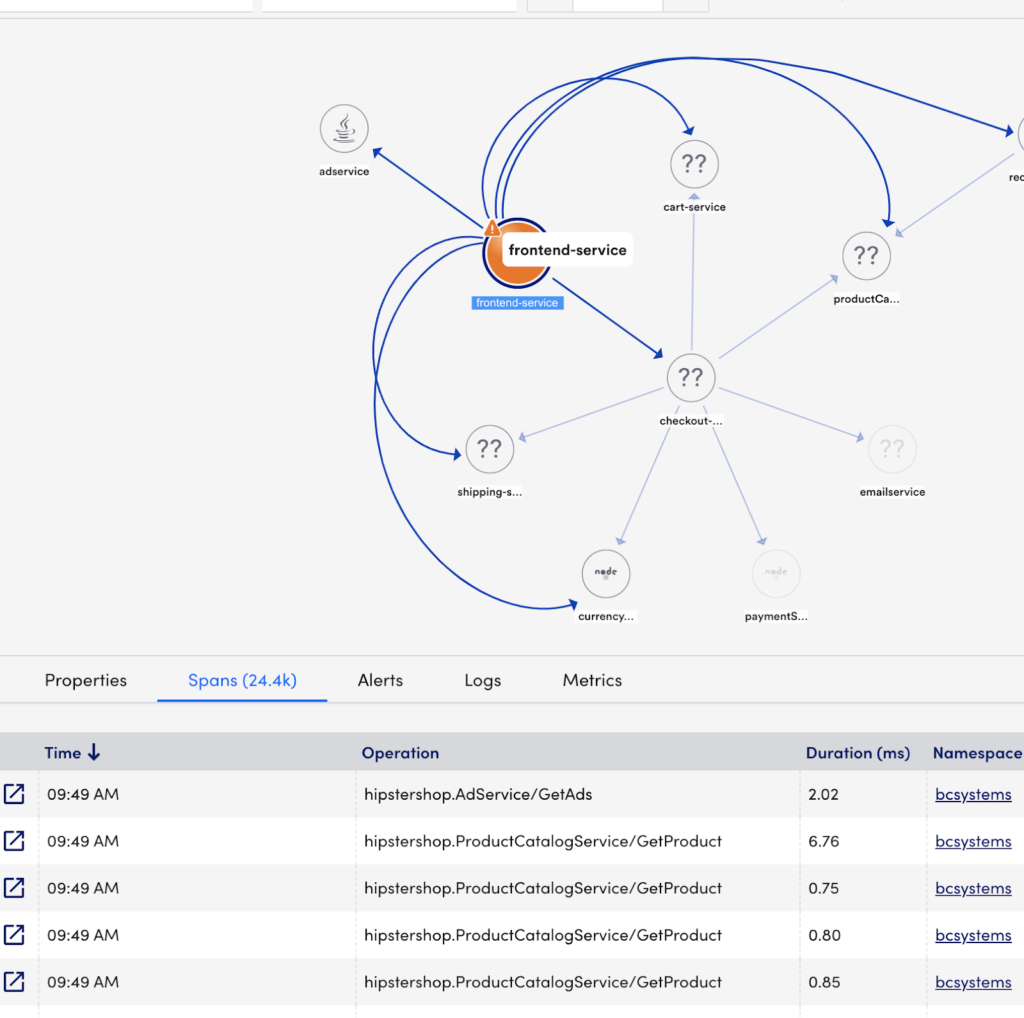
On the same Traces page, you can click on the Topology icon within each row to view the full Topology map for a given Application namespace.
Once there, you’ll see that only the frontend-service was in an alerted state, and you can also see just how many downstream services are dependent on your frontend-service performing well and staying operationalThese insights are fundamental to understanding how you should prioritize solving issues within your application.
Now you’ll be able to uncover not only what’s slow and where it’s slow, but also have much more confidence that you’ve diagnosed the underlying issue and eliminate the guesswork when troubleshooting and triaging application alerts.
The next step in our evolution is to connect these Application Topology maps with LM Envision’s existing Infrastructure Topology maps so that users can uncover even deeper relationships between their applications and the underlying resources powering them. Stay tuned to learn more!
LM Envision Application Topology is now generally available to all users with an APM License. Contact your LM Customer Success Manager to get started or sign-up for a free 14-day trial today!
Disclaimer: The views expressed on this blog are those of the author and do not necessarily reflect the views of LogicMonitor or its affiliates.