
In this article


Imagine it’s 3 AM, you’ve just been paged for a critical issue- queues filling up quickly, and you don’t know why. You turn to logs, looking for something abnormal, a change that could explain what is happening so you can fix it. Sound familiar? Unfortunately, searching through logs to uncover changes is a time-consuming process. Wouldn’t it be nice if these changes were surfaced automatically, and even put into the context of the metrics-based alerts you were originally paged for? This is exactly what we’re on a mission to do with LM Logs.
In January of this year LogicMonitor acquired Unomaly, an AIOps company focused on intelligent log analysis. Since then, we’ve been hard at work integrating Unomaly’s product into LogicMonitor to bring metrics and logs together, so we can help users reduce MTTR. Our new offering, built from Unomaly, is called LM Logs. Its goal is to identify log anomalies, correlate them with the right monitored resources in LogicMonitor, and surface them as contextual intelligence alongside metric alerts. You can easily go from “what” is wrong, as made clear by the metric, to “why” it happened, as explained by the logs.
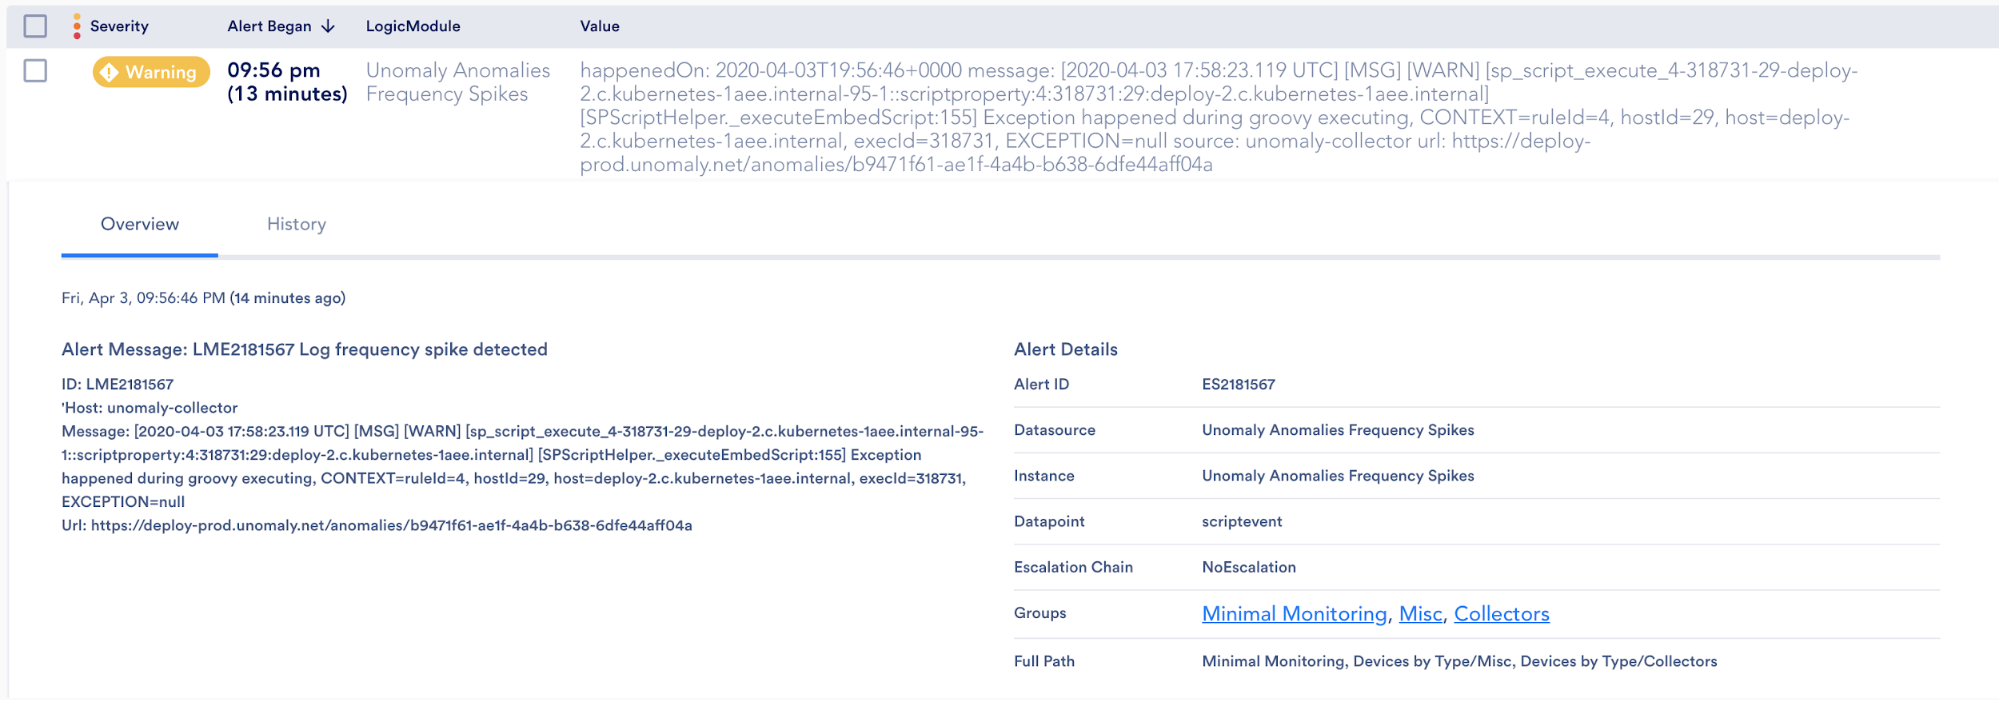
While working towards a fully integrated product with LM Logs, and to more quickly provide value to our existing customers, we developed an initial API-based integration that uses LogicMonitor EventSources and DataSources to display logs from Unomaly directly in the LogicMonitor platform.
The dashboard below illustrates the power of bringing metrics and logs together. As the Inbound connections for the application spikes, we can see memory and CPU usage dropping, page load time and disk utilization increasing, and a spike at the same time in log anomalies.
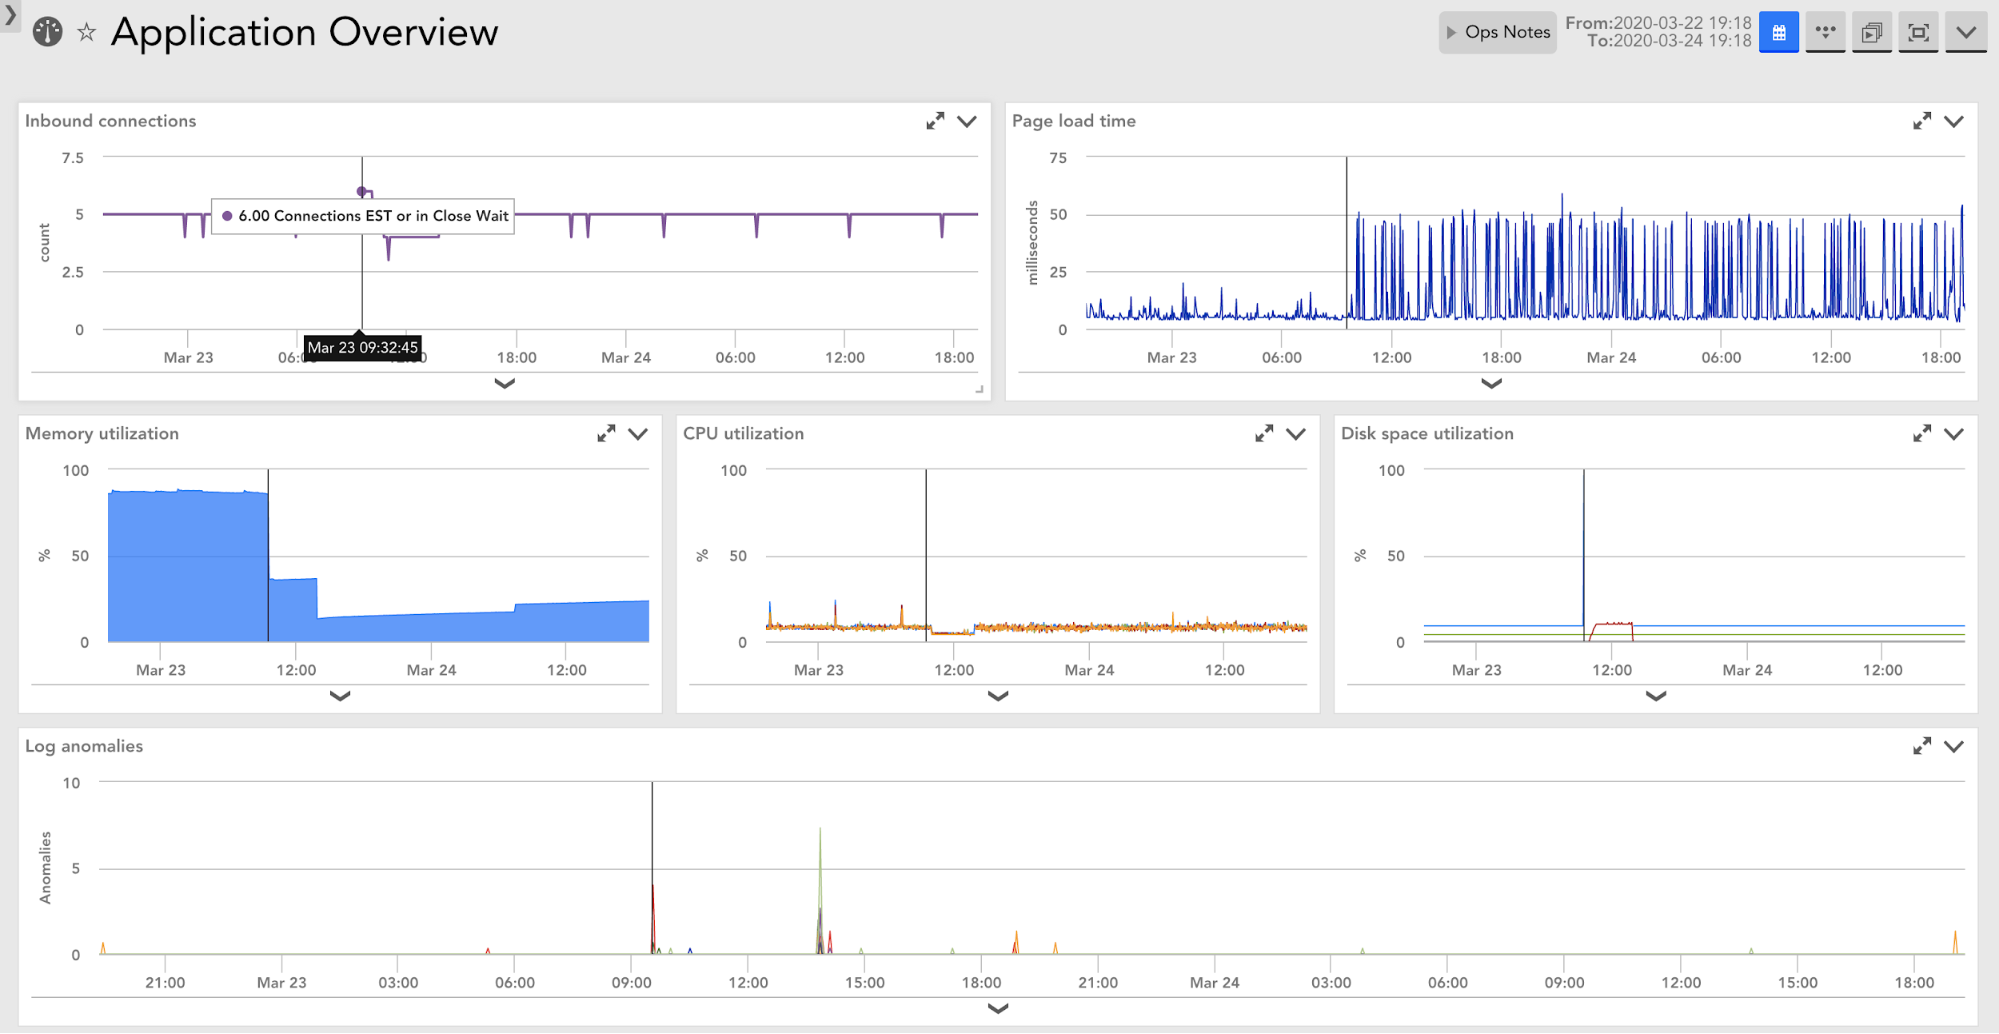
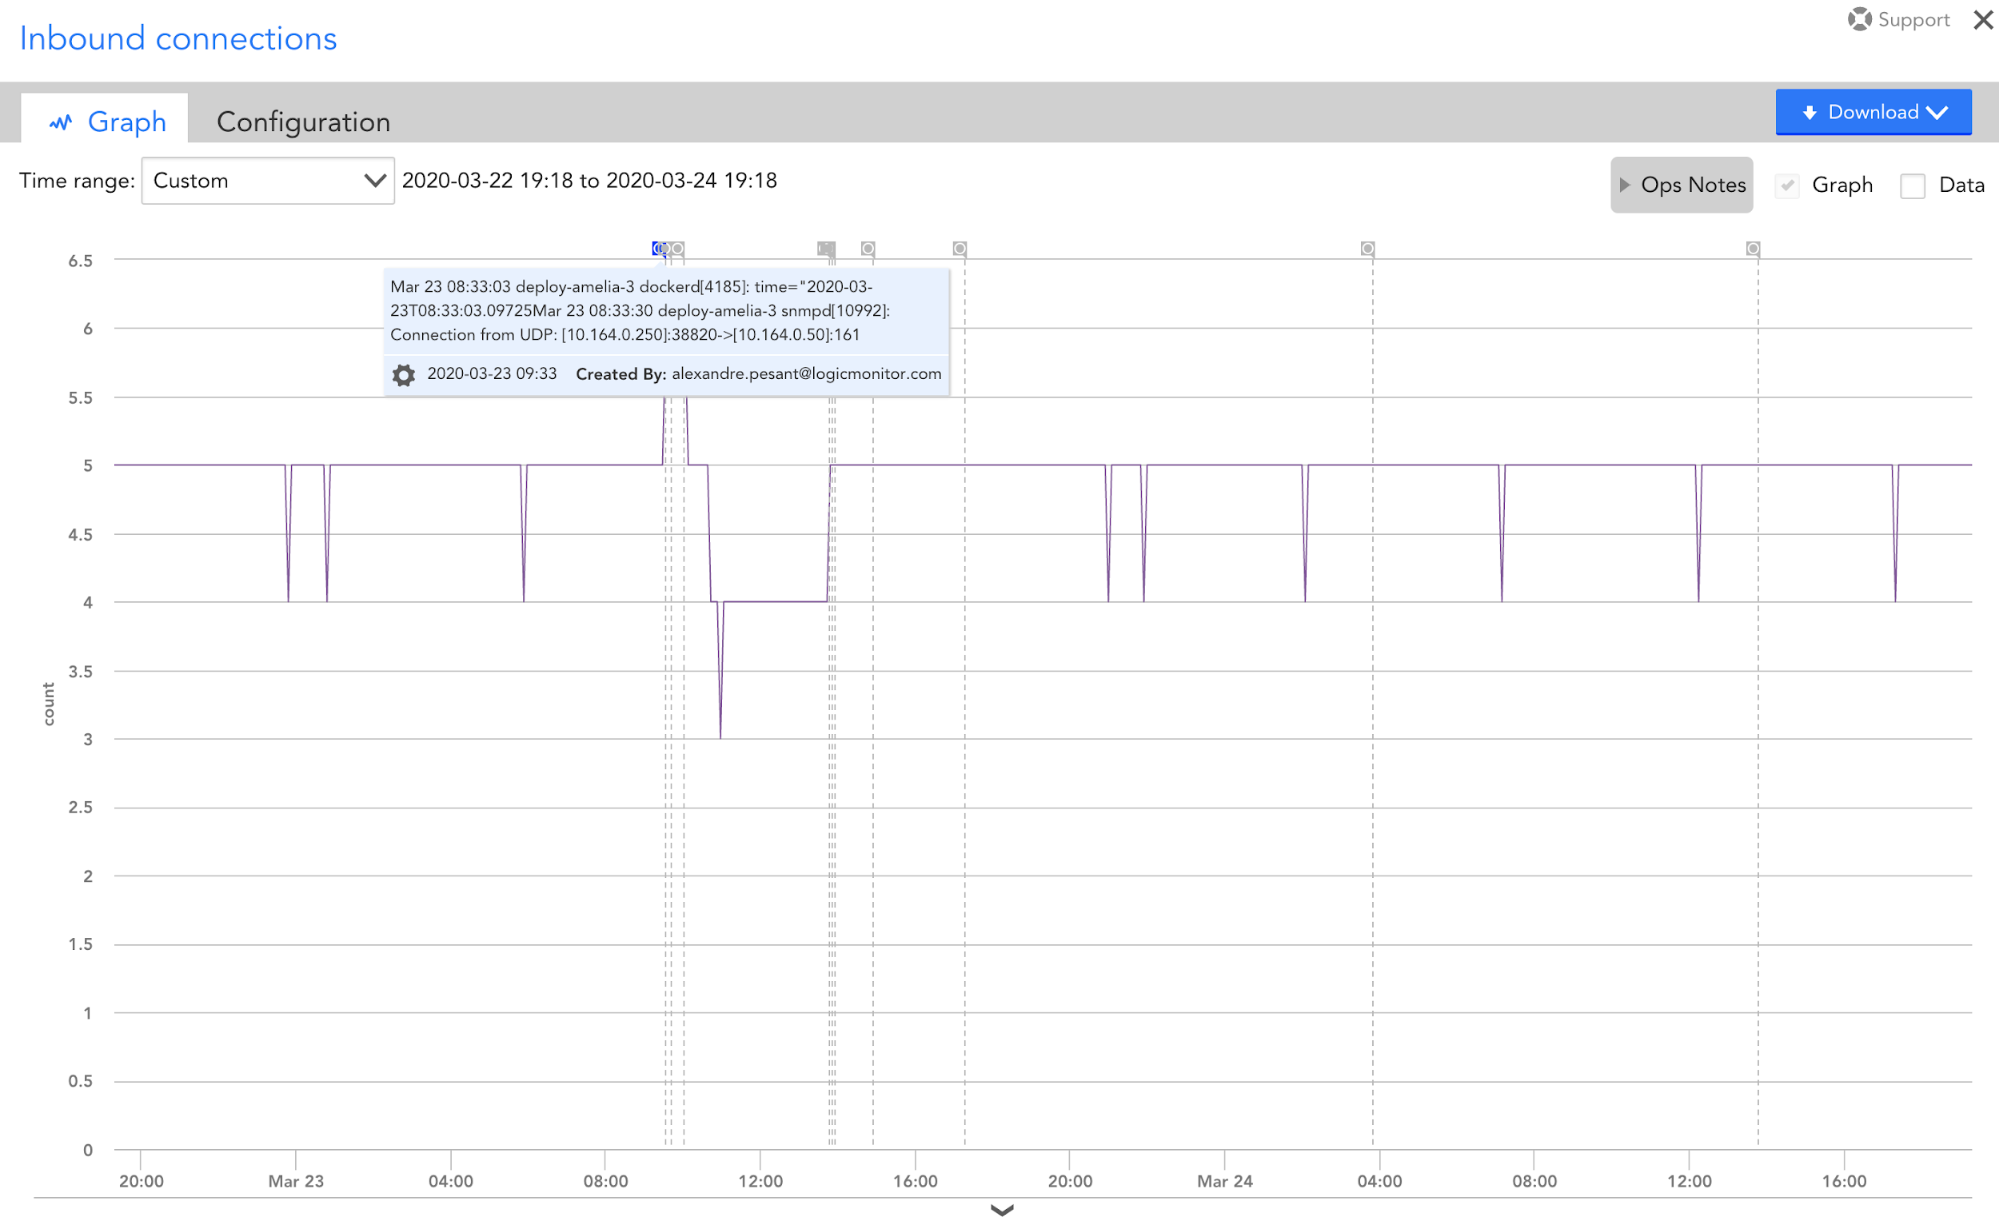
We can drill down with our new integration (via OpsNotes or EventSources) to view the messages for the log events during this time frame to identify the root cause faster.
We have several customers using this integration already to troubleshoot faster, such as global retailer Ted Baker. “Unomaly’s intelligence-first approach to surfacing logs makes it easier to see which logs are important. Bringing these logs directly into LogicMonitor so we have them right at our fingertips when an issue occurs can really help us decrease MTTR,” said Jan Stone, Lead Monitoring Analyst at Ted Baker
This is just a glimpse into the value we will be able to provide by bringing metrics and logs together with LM Logs. Learn more about our LM Logs platform here. We also offer a 14 day trial of our logs platform, you can sign up here!


Subscribe to our blog
Get articles like this delivered straight to your inbox