Monitoring Azure MariaDB Instances with LogicMonitor
Azure’s MariaDB instances make it easy to run a database in the cloud, and with LogicMonitor’s you can gain even further insight into your environment.
Released in 2009, MariaDB is a popular open-source fork of the MySQL relational database management system. MariaDB is intended as a drop-in replacement for MySQL, so data and table definitions, protocols, structures, and connectors require little to no modification in order to migrate. MariaDB also contains several enhancements, including faster indexes and cache, increased connection thread pools, and support for more storage engines.
Benefits of Azure managed MariaDB instances
Azure’s managed database services reduce the cost and management overhead typically associated with running the database on your own and provide other benefits such as high availability and automated backups. LogicMonitor recently added monitoring coverage for Azure MariaDB managed instances and provides a DataSource to measure and alert on MariaDB performance metrics. These metrics give insight into the behavior of your MariaDB managed instances and are crucial to maintaining the performance, availability, and reliability of your database infrastructure alongside your existing cloud and on-premise infrastructure – all from a single pane of glass.
Once you add your Azure environment and enable the new MariaDB service, database instances are discovered automatically. If your LogicModules aren’t up to date, browse the repository and import the Azure MariaDB DataSource to begin collecting data.
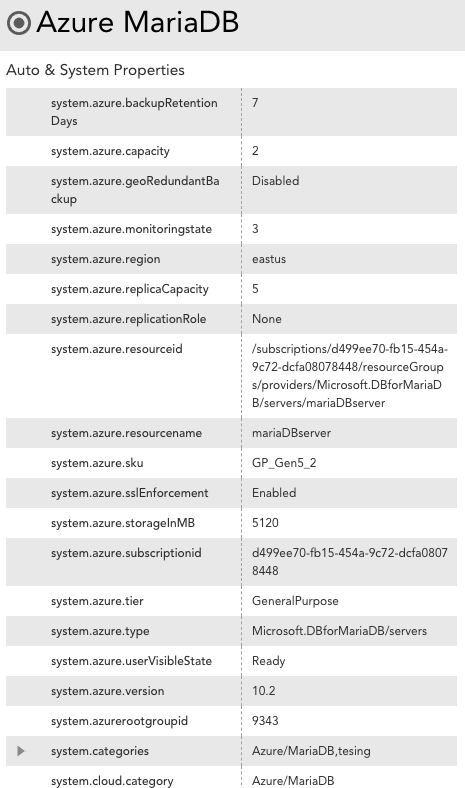
Managed instances automatically populate with useful metadata, such as SKU and backup retention. You can rely on these properties to help manage inventory through reporting, or even dynamically group resources based on these values.
Key MariaDB performance metrics
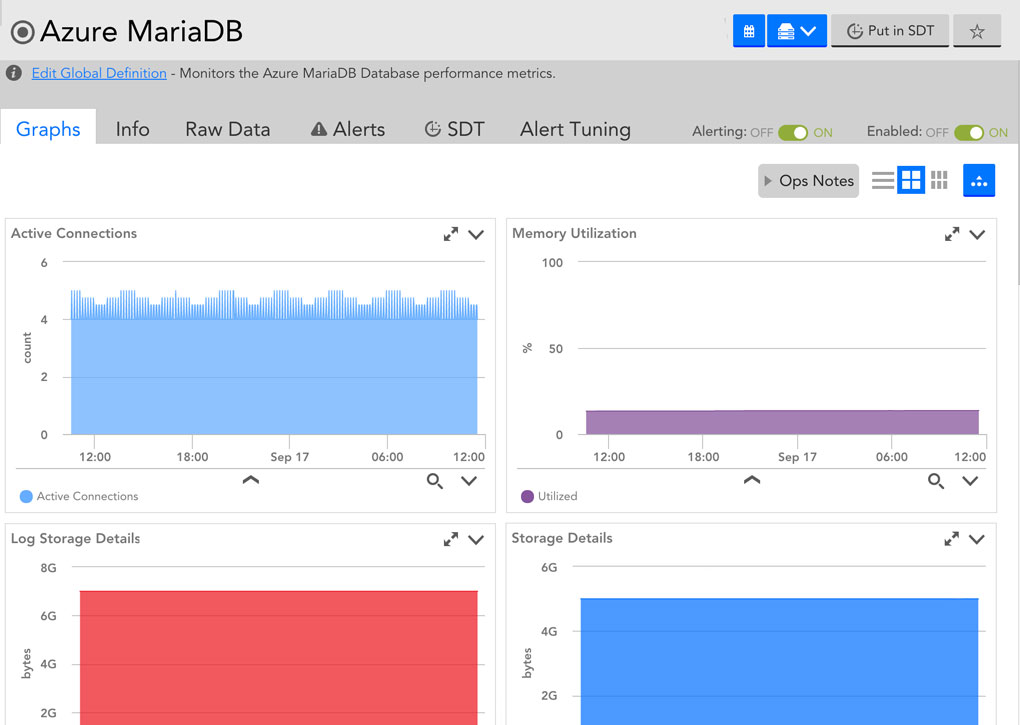
LogicMonitor polls directly from Azure Monitor and begins populating all available datapoints, including the number of active and failed connections, memory and CPU consumption, and storage usage. Default alert thresholds provide advanced notification when potential issues are detected. As a best practice, we recommend keeping tabs on the following datapoints:
CPUPercent: It’s important to monitor CPU usage when tracking performance. By default, we will alert when this approaches the 90% range. A higher sustained usage may indicate the allocated CPU capacity is not adequate for the workload, and continuous alerts here may indicate it’s necessary to allocate additional vCores to the server.
MemoryPercent: Similar to CPU usage, LogicMonitor measures memory consumption from your MariaDB instance. An alert will trigger when memory approaches full usage for a sustained amount of time. Since Azure allocates memory based on CPU, increasing the vCore count or upgrading the server to a higher pricing tier may help with resolution.
ConnectionsFailed: This tracks the number of failed connections per second to the database. Since Azure places limits on the maximum number of connections you can have based on tiers, LogicMonitor will alert when the number of failed connections isn’t equal to zero, which indicates the limit has been reached.
Enhance your MariaDB monitoring with LogicMonitor
Azure’s managed MariaDB instances make it easy to run a database in the cloud, and with LogicMonitor’s extensive cloud and on-premises monitoring, you can gain even further insight into the performance of your environment. Try it free, or book a free demo today!
Disclaimer: The views expressed on this blog are those of the author and do not necessarily reflect the views of LogicMonitor or its affiliates.