NodeJS Application Manual Instrumentation for Distributed Traces

NodeJS Application Manual Instrumentation for Distributed Traces

In this blog series, we are covering application instrumentation steps for distributed tracing with OpenTelemetry standards across multiple languages. Earlier, we covered Java Application Manual Instrumentation for Distributed Traces, Golang Application Instrumentation for Distributed Traces, and DotNet Application Instrumentation for Distributed Traces. Here we are going to cover the instrumentation for NodeJS.

Initialize the New Project

As all NodeJS projects start with “npm init”, we will do the same for our project. But before that, we will create a separate directory.

Go ahead, make a directory for the project and change it to that directory.

mkdir "InstrumentationProject"
cd "InstrumentationProject"

Now that we have our directory, let’s initialize our nodeJS project.

npm init esm -y

This will initiate the project with ES-6 modules and create package.json. Next, let’s grab our dependencies.

npm i @opentelemetry/sdk-trace-base @opentelemetry/api @opentelemetry/resources
@opentelemetry/exporter-collector
@opentelemetry/semantic-conventions

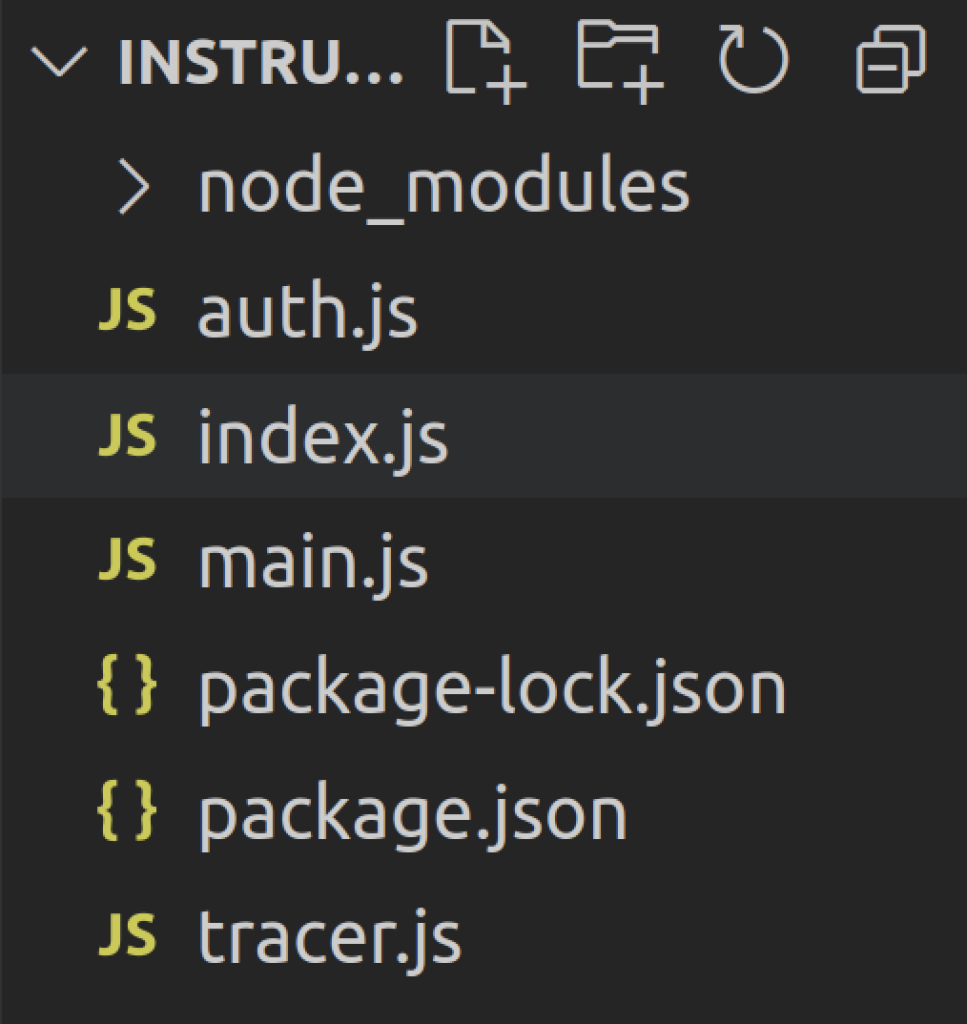
At this point, you will have all of the dependencies installed. Create a file named “tracer.js”. Your folder structure should look like this:

Node.js folder structure

You want your tracer.js to be run before anything else in your application so that all the required components for tracing are configured before an application starts taking requests.

To achieve this, edit index.js and add before module.exports.

require('./tracer')

Now we are ready to start initializing our Tracer Provider.

Initializing Tracer Provider

In this section, we will be editing tracer.js. Here are the required imports:

import { BasicTracerProvider, ConsoleSpanExporter, SimpleSpanProcessor } from "@opentelemetry/sdk-trace-base";
import { JaegerExporter } from '@opentelemetry/exporter-jaeger';
import { CollectorTraceExporter } from "@opentelemetry/exporter-collector";
import { Resource } from "@opentelemetry/resources";
import { SemanticResourceAttributes } from "@opentelemetry/semantic-conventions";

Let’s get an instance of BasicTracerProvider:

const provider = new BasicTracerProvider();

Set Resource Attributes

The resource attributes are used to describe the resource that is generating the telemetry data.

For example:

  • Name of the service
  • Deployment zone
  • Cloud provider
  • Type of host (VM, Container, Kubernetes)

Let us define a few resource attributes:

const resource = new Resource({
    [SemanticResourceAttributes.SERVICE_NAME]: 'authentication-service',
    [SemanticResourceAttributes.SERVICE_NAMESPACE]: 'US-WEST-1',
    'host.type': 'VM'
})

You can describe the resource attributes using the predefined keys in SemanticResourceAttributes or you can use custom attribute keys.

Go ahead and configure our newly defined resource attributes with the Tracer:

provider.resource = resource

Configuring Trace/Span Exporter

The exporter is a component that sends the collected telemetry data to a remote backend, locally running collector, or to a file. We can also export the collected data to the console, as we will see later.

Let’s initialize the exporters we will be using in this example:

const consoleSpanExporter = new ConsoleSpanExporter
const collectorTraceExporter = new CollectorTraceExporter

consoleSpanExporter: This is used to see the spans on the console.

collectorTraceExporter: This is used to export the traces in OpenTelemetry format.

Adding the Span Processor and Registering the Tracer

provider.addSpanProcessor(new SimpleSpanProcessor(consoleSpanExporter))
provider.addSpanProcessor(new SimpleSpanProcessor(collectorTraceExporter))
provider.register()

We are using SimpleSpanProcessor. You can also use BatchSpanProcessor, which sends the spans in batches for efficient use of system resources. You can customize the batch size.

Finally, we register our Tracer so that Opentelemetry APIs can use this tracer.

Instrumenting the Application

In this section, we will get to know the various aspects of instrumenting an application. You can find the code of the instrumented application towards the end.

A span is a single unit of work and traces are often made up of several spans. To enrich the span with more information about the operation, we leverage Span Attributes.

Creating a New Span

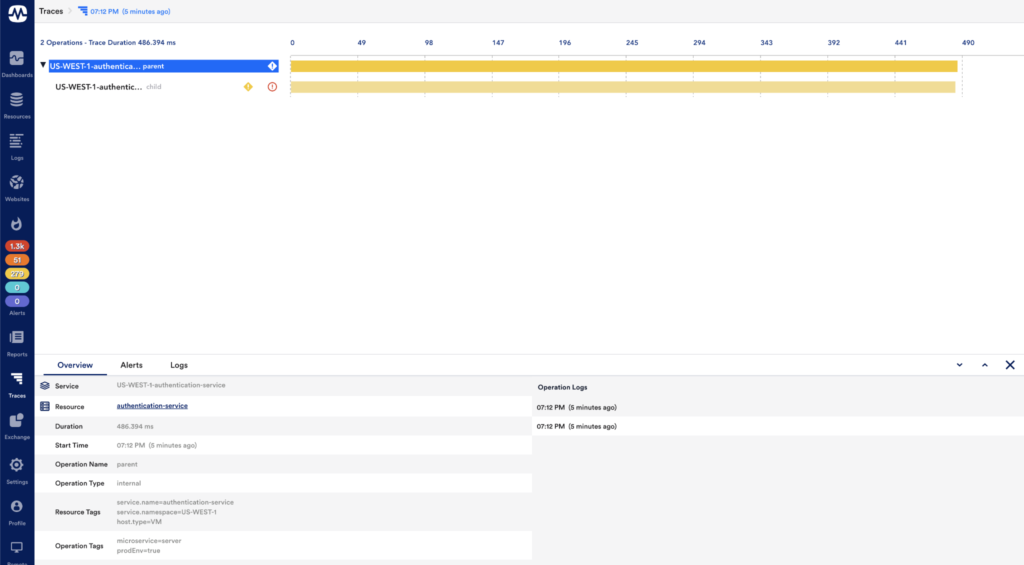
Here, ‘parent’ is the name that we want to give to the span.

const parentSpan = opentelemetry.trace.getTracer('default').startSpan('parent');

Adding Attributes to the Span

You can add any number of attributes to the span.

parentSpan.setAttribute("microservice","server")
parentSpan.setAttribute("prodEnv","true")
childFunction(parentSpan) //Passing the context the function
parentSpan.end() //DO NOT forget to end the span

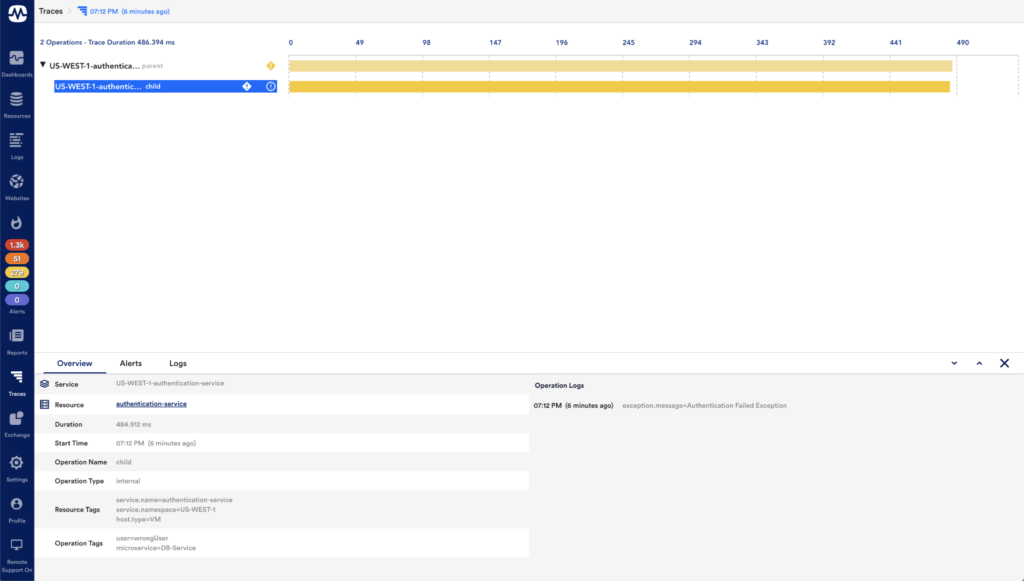
Creating the child span using parent span in the childFunction:

function childFunction(parentSpan) {

const ctx = opentelemetry.trace.setSpan(opentelemetry.context.active(), parentSpan);
const childSpan = opentelemetry.trace.getTracer('default').startSpan('child', undefined, ctx);
.
.
.
.
childSpan.end()
}

Setting a Span’s Status

By default, the status is UNSET. If you have encountered an error you can set the error status as:

childSpan.setStatus({
            code: SpanStatusCode.ERROR,
            message: 'Authentication failed.'
          })

Instrumented Application Code

index.js

require = require("esm")(module/* , options */)
require('./tracer')
module.exports = require("./main.js")

tracer.js

import { BasicTracerProvider, ConsoleSpanExporter, SimpleSpanProcessor } from "@opentelemetry/sdk-trace-base";
import { CollectorTraceExporter } from "@opentelemetry/exporter-collector";
import { Resource } from "@opentelemetry/resources";
import { SemanticResourceAttributes } from "@opentelemetry/semantic-conventions";

const provider = new BasicTracerProvider();


const resource = new Resource({
    [SemanticResourceAttributes.SERVICE_NAME]: 'authentication-service',
    [SemanticResourceAttributes.SERVICE_NAMESPACE]: 'US-WEST-1',
    'host.type': 'VM'
})


const consoleSpanExporter = new ConsoleSpanExporter
const collectorTraceExporter = new CollectorTraceExporter

provider.resource = resource

provider.addSpanProcessor(new SimpleSpanProcessor(consoleSpanExporter))
provider.addSpanProcessor(new SimpleSpanProcessor(collectorTraceExporter))
provider.register()

main.js

import Auth from './auth'
import opentelemetry from "@opentelemetry/api"
console.log("Hello")

const server = async (username, password) => {
    
    const parentSpan = opentelemetry.trace.getTracer('default').startSpan('parent');
    
    parentSpan.addEvent("Parent Span")
    parentSpan.setAttribute("microservice","server")
    parentSpan.setAttribute("prodEnv","true")
    parentSpan.addEvent("Received request")
    console.log("Got request")
    await Auth(parentSpan, username,password)

    console.log("SERVER END")
    parentSpan.end()
};

server("user1","password");
server("wrongUser","wrongPassword");

export {}

auth.js

import opentelemetry, { SpanStatusCode } from "@opentelemetry/api"

export default async function(parentSpan, username,password) {
    const ctx = opentelemetry.trace.setSpan(opentelemetry.context.active(), parentSpan);
    const childSpan = opentelemetry.trace.getTracer('default').startSpan('child', undefined, ctx);
    childSpan.setAttribute("user",username)
    childSpan.setAttribute("microservice","DB-Service")
    
    //Simulate a network delay
    await sleep(Math.floor(
        Math.random() * (500 - 200) + 200
      ))
    try{
        if (username==="user1" && password==="password") {
                
            //Success span
            console.log("Authenticated.")
            childSpan.addEvent("Authentication Failed", { authentication: "Successful" }  )

        } else {
            
            throw("Authentication Failed Exception")
            //Error Span

        }
    }
    catch(error) {
        console.log("Failed to Authenticate.")
        childSpan.recordException(error)
        childSpan.setStatus({
            code: SpanStatusCode.ERROR,
            message: 'Authentication failed.'
          })
    }
    finally {
        childSpan.end()
    }
}


function sleep(ms) {
  return new Promise((resolve) => {
    setTimeout(resolve, ms);
  });
}

Running the Application

From your project directory:

node index.js

Traces Received in LogicMonitor Platform

Traces Received in LogicMonitor Platform

Detailed View of Trace

Parent Span:

Detailed View of Trace

Child Span:

Child span

Conclusion

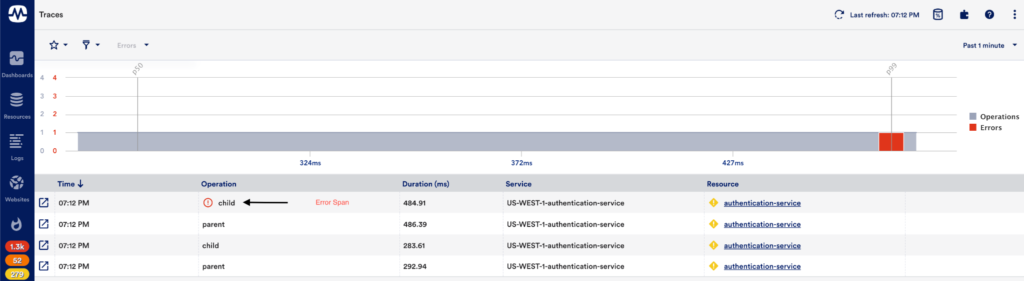
Congratulations, you have just written a NodeJS application emitting traces using the OpenTelemetry Protocol (OTLP) Specification. Feel free to use this code as a reference when you get started with instrumenting your business application with OTLP specifications. LogicMonitor APM specification is 100% OTLP compliant with no vendor lock-in. To receive and visualize traces of multiple services for troubleshooting with the LogicMonitor platform, sign up for a free trial account here. Check back for more blogs covering application instrumentation steps for distributed tracing with OpenTelemetry standards across multiple languages.