LogicMonitor allows users to digest data in multiple ways, including visual representations of raw data reports via dashboards. Check out our latest blog to find out how LogicMonitor Sales Engineer, Ian Bloom, is helping his clients get the most out of their LogicMonitor data.
3 min read
June 7, 2019
In this article
NEWSLETTER
Subscribe to our newsletter
Get the latest blogs, whitepapers, eGuides, and more straight into your inbox.
Thank you!
Your video will begin shortly
SHARE
In this article
As a Sales Engineer, I hear interesting product requests on a daily basis, and integrating LogicMonitor reports with LogicMonitor dashboards comes up frequently. LogicMonitor’s reporting engine has many useful functions from capacity planning to SLA calculation, and dashboards help users visually digest the raw data of reports.
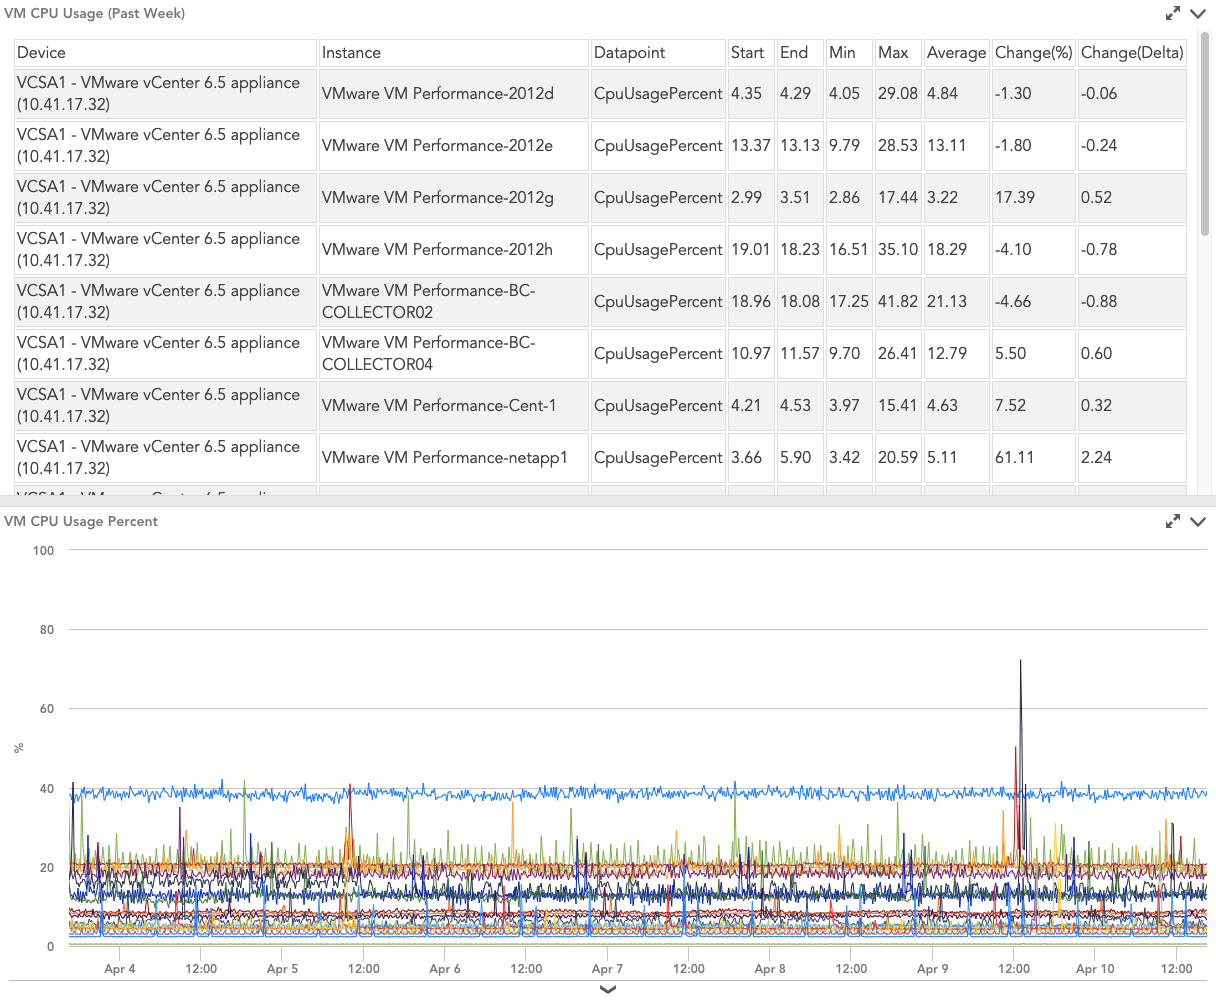
One common issue users face is determining CPU contention between VMs. We can take a look at CPU usage trends using the statistical analysis built into our resource metric trends report. This data can be helpful to lend perspective to dashboard graphs:
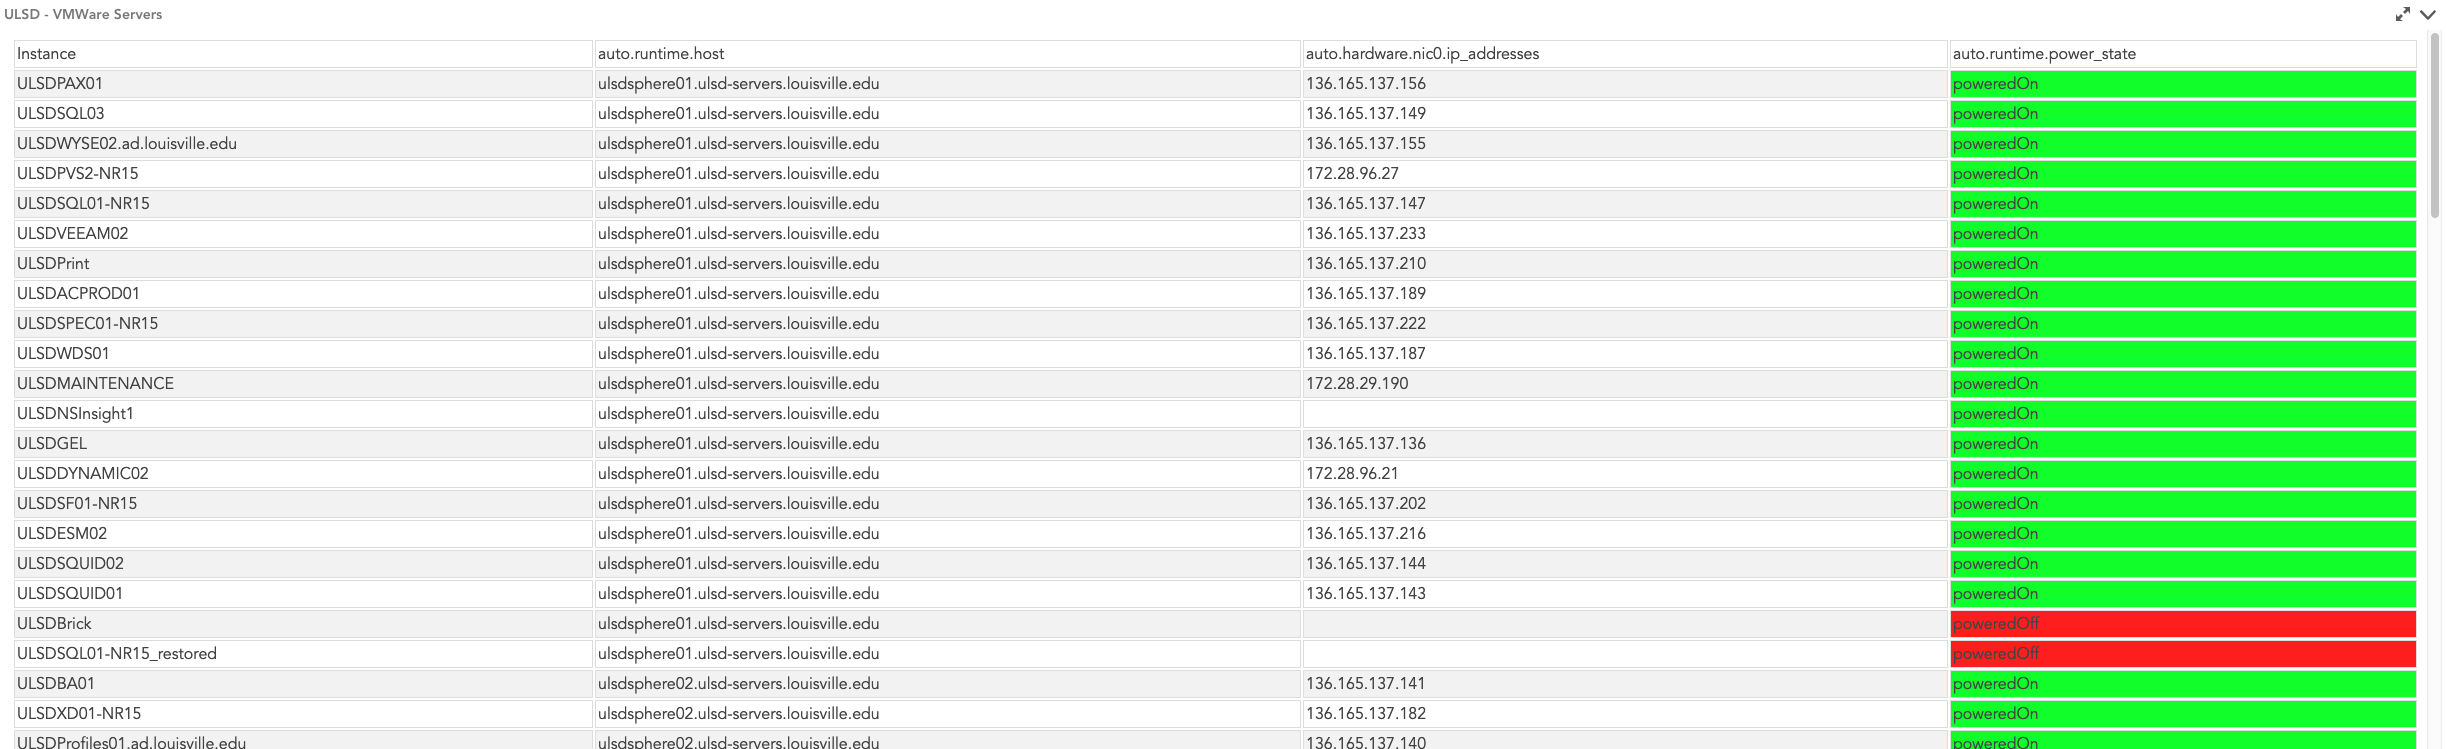
Resource inventory reports are a great way to audit the device and instance properties of LogicMonitor resources. Managed Service Provider (MSP) customers, for example, often use these reports to help clients understand supported infrastructure. Inventory reports are often useful for auditing the status of VMs and cloud resources.
I recently worked with a client to help track which VMs were on/off and which host each VM is running on. The example below includes conditional formatting to color cells based on VM power state:
LogicMonitor is capable of delivering reports in HTML, CSV, and PDF format. We will be using a DataSource to run, parse, and upload a CSV report to a text widget. To configure this DataSource, first, create a report, and create a text widget to POST the report to. Text widgets will render any HTML within which makes them a natural choice for this application. The DataSource we will use has the following AppliesTo() query:
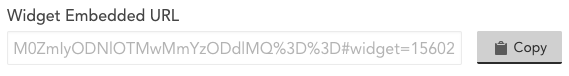
Lmaccess.id and lmaccess.key correspond to API credentials. Lmaccount is your portal’s subdomain (The XXX in XXX.logicmonitor.com). Widget_id can be found by managing a dashboard widget, generating a widget embedded URL, and navigating to the end of the URL:
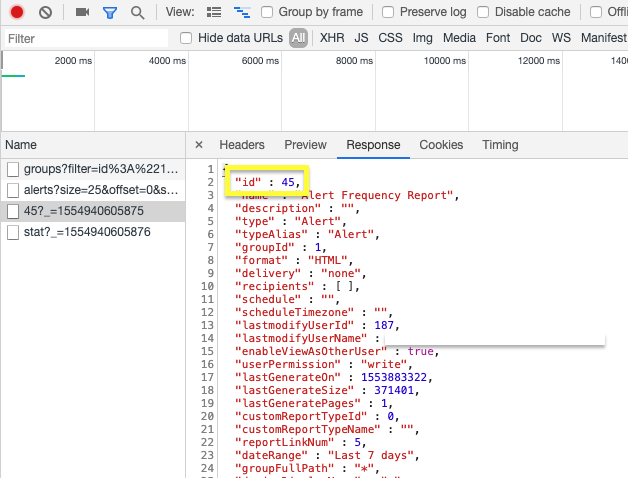
Report_id is a bit more difficult to find. Open your browser’s developer tools, then manage the report in question to find said report’s ID:
When those are applied to a device, the DataSource should automatically work its magic!
There is a function called TO_HTML() that uses a library called jsoup that makes parsing and building HTML quick and easy. This function takes the CSV report as input and outputs an HTML table. This is the function to modify if you’d like to include conditional formatting.
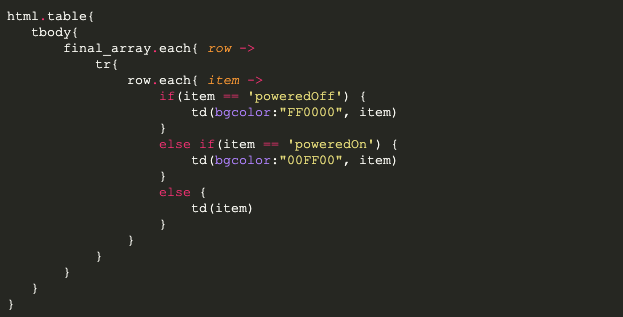
As an example, consider the following code snippet from the TO_HTML() function:
You can see that, depending on the value of the cell (‘item’ in this case), we can make changes to the HTML table element’s attributes (in this case the ‘bgcolor’). Out of the box, LogicMonitor’s style sheet is included within the TO_HTML() function, but if you’d like to theme your table a different way, feel free to modify the CSS contained within.
Want to see more? Try out the modules above or reach out to your customer success manager. If you’re considering LogicMonitor attend one of our weekly live demos or request a free trial.
Disclaimer: The views expressed on this blog are those of the author and do not necessarily reflect the views of LogicMonitor or its affiliates.