For CloudOps Teams
Cloud-inclusive Monitoring Solution Powered by AI
Cloud with confidence. Empower CloudOps teams to monitor resources across multiple clouds to deliver better migrations, optimize cloud resources and spend, and quickly assess root cause of performance and availability issues.
Monitoring that’s truly cloud-agnostic
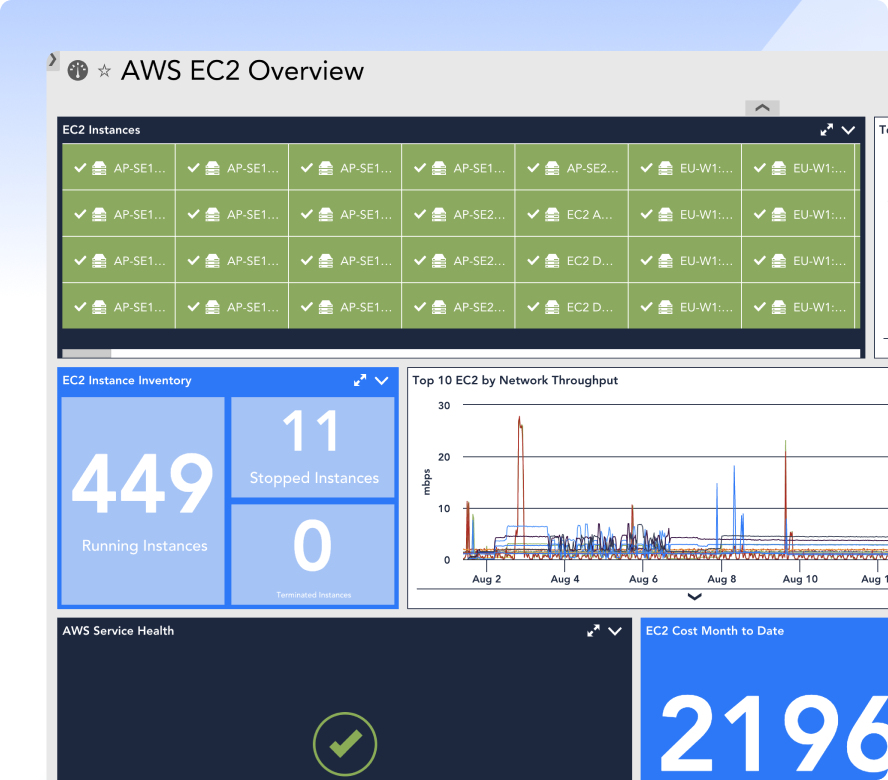
Simplify cloud monitoring, and achieve comprehensive visibility into AWS infrastructure health and performance that is otherwise challenging to obtain.
Install a collector on a Virtual Machine or Server in your Azure instance and you’ll be able to use LogicModules out-of-the-box to monitor critical Azure-hosted infrastructure performance metrics and build out dashboards that show all data critical to your Cloud Operations.
With a complete view across important GCP services, CloudOps teams are equipped with real-time visibility into the health and performance of their entire distributed environments, whether fully deployed in GCP or just getting started.

REPORT
2024 G2 Grid® Report for Cloud Monitoring
Compare the Top Cloud Monitoring Software of 2024 from validated, third-party data.
Built for modern CloudOps
Out-of-the-box benefits
Unify your Ops departments for the future of observability
Fast time to value
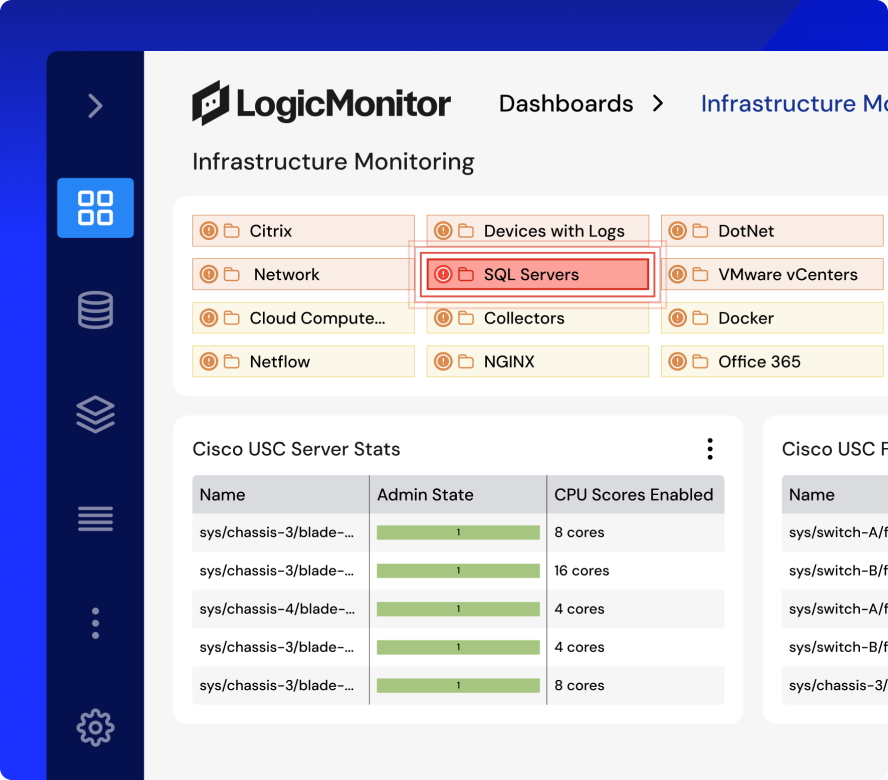
Complete visibility to your cloud environments with out-of-the-box data collection into cloud infrastructure and cloud services on AWS, Azure, and GCP, preconfigured alert thresholds, and intuitive dashboards let your team take action faster, without having to decide what to collect, deploying agents, where to set alert thresholds, or what to put on the dashboards.
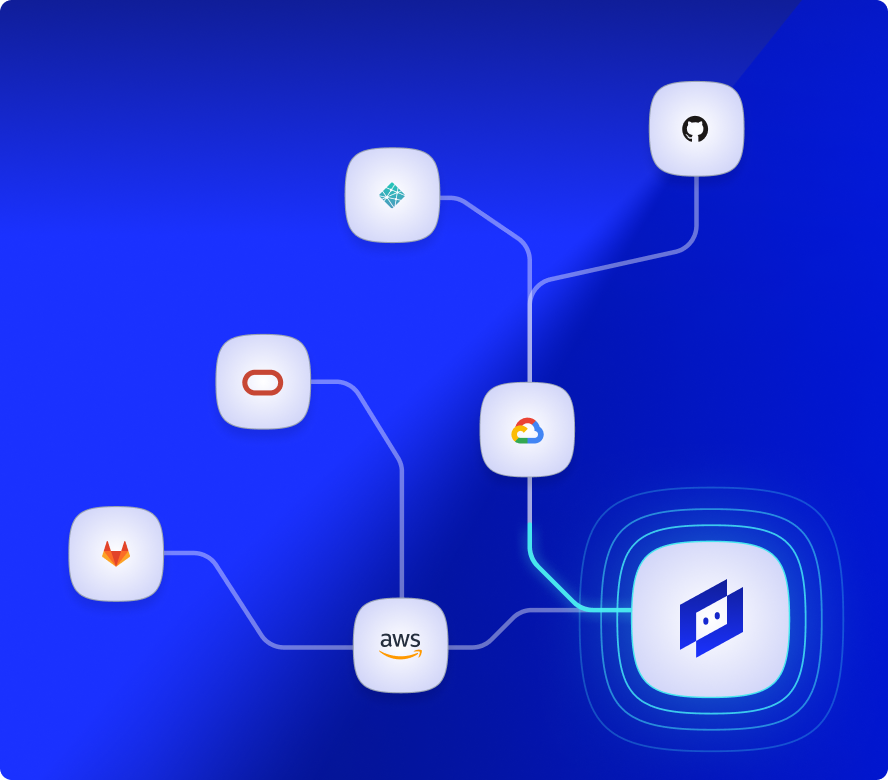
Seamless integration
Tailor your technology ecosystem to work the way you need it. Seamlessly integrate into your existing workflows to view cloud infrastructure across all clouds in a single pane of glass and alongside on-premises infrastructures. Simplify your team’s operations with alerting via your existing tools, such as Slack or ServiceNow, and use existing automation tooling like Puppet or Terraform to manage monitoring.

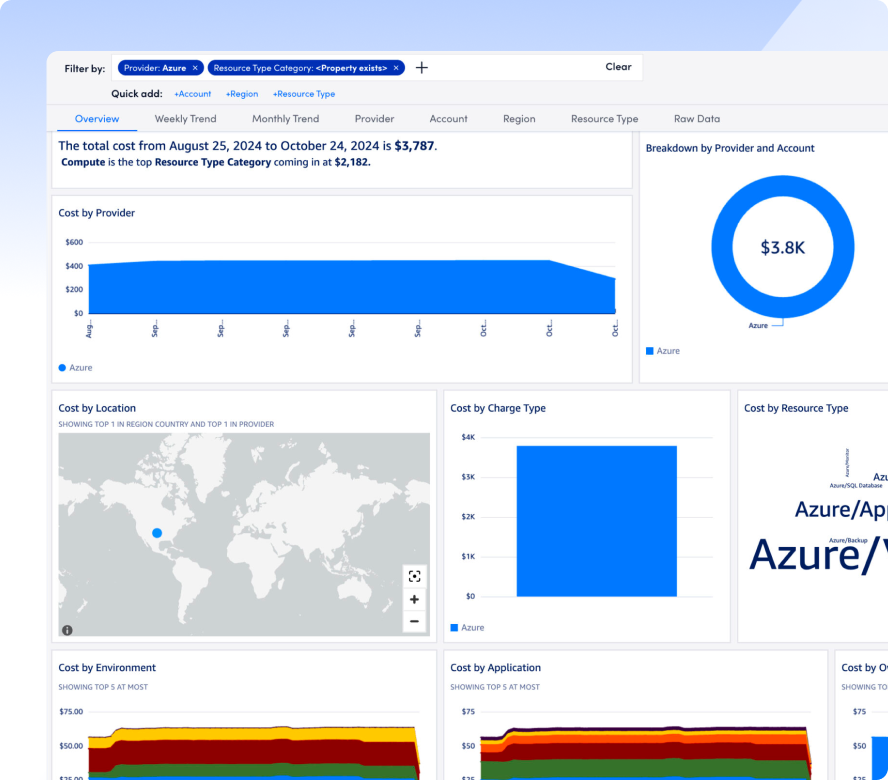
Intelligent costs insights
Billing monitoring with intelligent insights for Azure Cost Management, AWS Billing, and GCP enables visibility into spend alongside usage and performance. Give your team the tools they need to understand where to optimize and how to scale efficiently – without impacting your team’s productivity.
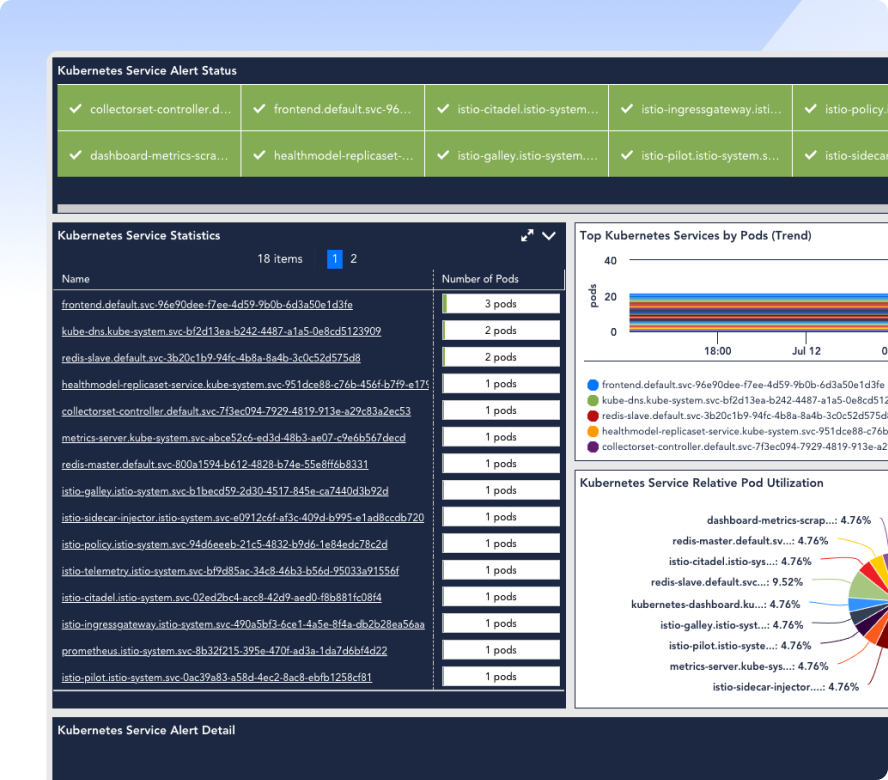
Cloud App monitoring
Monitor applications orchestrated by Kubernetes to get insights on resource utilizations, problems with application performance, and issues that could affect availability.
TRUSTED BY LEADING COMPANIES


Hybrid Observability powered by AI for cloud operations
Hybrid Observability powered by AI enables a truly cloud-inclusive monitoring solution for modern hybrid and multi-cloud enterprises by offering a single source of truth into all cloud services, applications and containers. By directly correlating cloud performance metrics and cloud provider health status to your infrastructure, CloudOps gets the insights they need across all clouds to work smarter, not harder.
Modern monitoring so you can monitor cloud with confidence
-
Eliminate silos Full visibilty across multi-cloud environments and teams to increase control and reduce risk.
-
Reduce time to value Simple, intuitive UI makes it easy for teams to see what’s happening and spend more time focusing on deployments.
-
Enable developers Empower dev teams to perform continuous delivery by building a self-service experience for building, releasing, and monitoring.
“Edwin AI will be 100x faster than a human and able to manage complex problems.”
“Edwin AI is not another AI tool, but an essential part of our IT team.”
“Capital Group has 1,000+ alerts/ day. LogicMonitor will eliminate that noise.”
“LogicMonitor tells you what’s happening in the environment.”
Solutions for CloudOps teams
LM’s cloud monitoring offering allows enterprises to maximize their investments in cloud services – with real-time visibility into the total performance of cloud deployment to empower cloud leaders to make informed, data-driven business decisions.
LM’s modern log analysis solution proactively identifies problems before they disrupt hybrid and cloud environments, detects root cause anomalies caused by deviations from standard event patterns, and provides context alongside infrastructure metrics to help troubleshoot issues faster.
LM APM enables optimizing user experience, detecting application latency, and identifying bottlenecks within your modern apps to resolve issues faster, maximize application resiliency and eliminate application silos across hybrid architectures.
RESOURCES
Check out our latest resources
See only what you need, right when you need it. Immediate actionable alerts with our dynamic topology and out-of-the-box CloudOps capabilities.