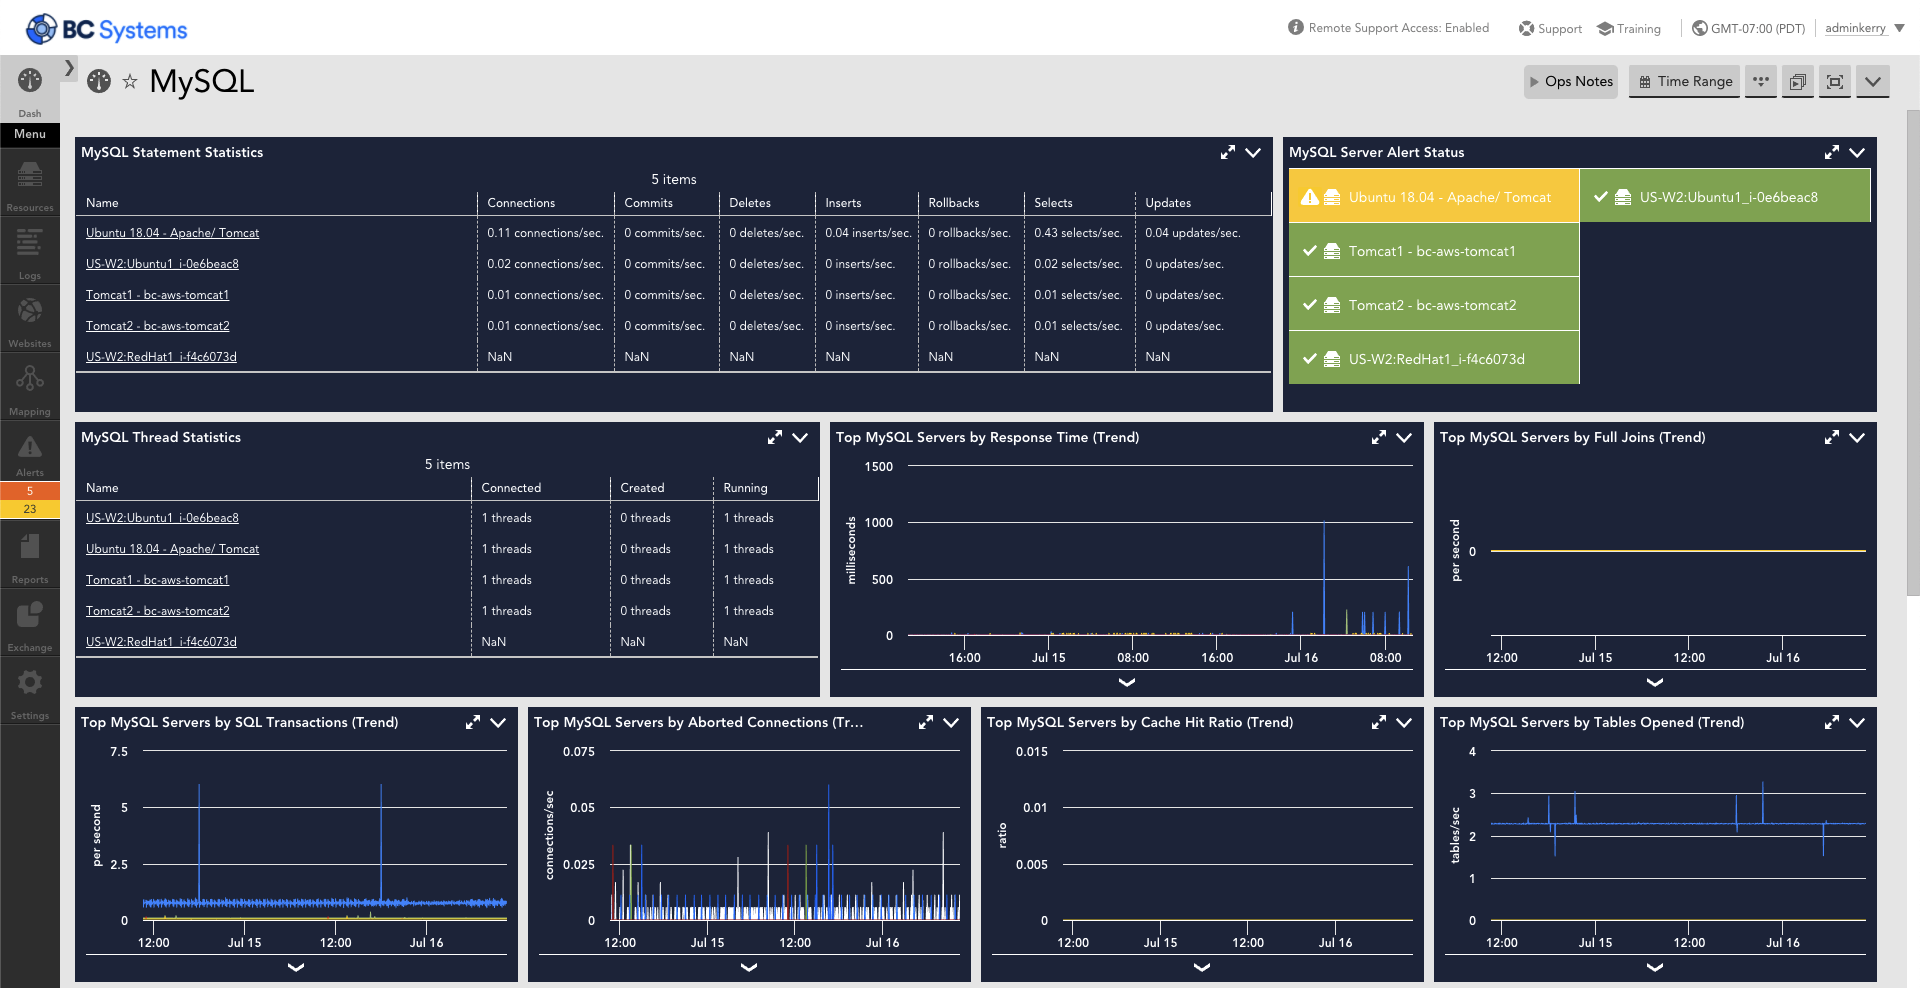
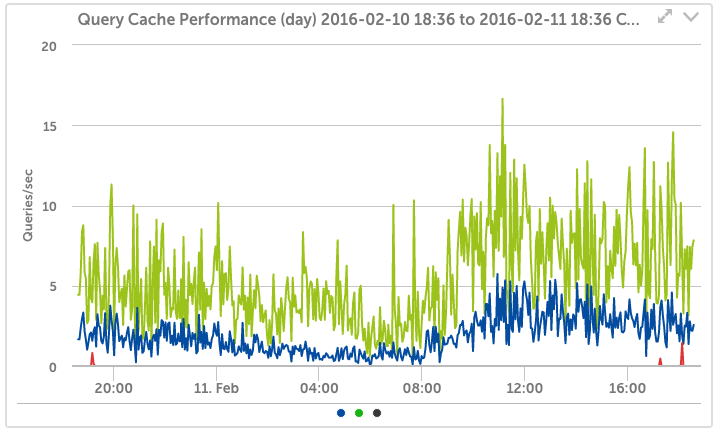
Join us at LM Elevate. Our annual conference for IT industry thought leaders, LogicMonitor users and partners. Register now!
LogicMonitor Logo LogicMonitor Logo
  • Why LogicMonitor
    • For Enterprises
    • For MSPs
  • Platform
    • Security
    • Integrations
    • Infrastructure Monitoring
    • Cloud Monitoring
    • Network Monitoring
    • Application Performance Monitoring
    • Log Analysis
    • Server Monitoring
    • + View all Solutions
  • Pricing
  • Resources
  • Support
Try it Free
Search:
  • Why LogicMonitor
    • For Enterprises
    • For MSPs
  • Platform
    • Security
    • Integrations
    • Infrastructure Monitoring
    • Cloud Monitoring
    • Network Monitoring
    • Application Performance Monitoring
    • Log Analysis
    • Server Monitoring
    • + View all Solutions
  • Pricing
  • Resources
  • Support
Try it Free
  • Platform
    • Integrations
    • Security
    • Platform Demo
  • Pricing
  • Why LogicMonitor
  • Case Studies
  • Support
    • Professional Services
    • Developer Documentation
    • Academy
    • Release Notes
  • About us
    • Leadership
    • Employee Spotlight
    • Press
    • Careers
    • Diversity & Culture
    • Contact / Locations
    • Events
  • Resources
  • Blog
  • Partner Program
  • Community
Integrations > Mysql

MySQL

MySQL is a popular open-source relational database management system. It is a common component of the LAMP (Linux, Apache, MySQL, Python/PHP/Perl) stack, and continues to be heavily relied upon in Cloud and containerized environments. As MySQL databases handle upwards of thousands of queries per second for business-critical or customer-facing applications, it is imperative to have a proactive MySQL monitoring strategy in place.

Agentless and comprehensive coverage in minutes.

LogicMonitor’s agentless Collector will automatically detect running MySQL databases and monitor critical metrics such as transaction-rates, blocks, and table-scans. Out-of-the-box dashboards allow you to identify outliers and surface performance anomalies quickly.

Historic trends inform capacity-planning and help with optimizing configuration

Use up to two-years of non-aggregated metrics to accurately forecast database capacity and performance. Identify seasonality and trends to stay ahead of bottlenecks and incidents.

Proactively alert on irregular MySQL performance.

LogicMonitor’s advanced machine-learning algorithms will alert you to irregular behavior on your MySQL instances while also reducing alert-noise from recognized norms.

Deploy Anywhere. Visibility Everywhere. Data-Center, Cloud, and Containers.

LogicMonitor provides the same granular performance monitoring to your MySQL databases, regardless of how they’re deployed – whether on virtual-machines in the data-center, PaaS instances in the Cloud, or as containers in your Kubernetes Clusters.

Track any SQL query for performance and business metrics.

LogicMonitor’s flexible LogicModules allow you to input and track any SQL query over time, elevating your monitoring system into a valuable business-intelligence platform.

Setup:

Monitoring MySQL is quck with LogicMonitor’s agentless, Collector based architecture. See our Support guide on how to get up and running.

Similar & Related Integrations

Apache Tomcat

Apache Zookeeper

Apache Hadoop

PostgreSQL

Microsoft SQL Server

Other Resources

Curious about monitoring Apache Web Server on your Cloud Instances? See this 3rd-party White Paper on Monitoring AWS Beyond CloudWatch.

No monitoring system makes it easier to monitor MySQL and the rest of your infrastructure than LogicMonitor. Skip the hours manually configuring and maintaining other MySQL monitoring systems. With no configuration, you will have MySQL performance trending graphs and alerts on:

  • Numbers & types of operations (selects, updates, inserts, rollbacks, etc)
  • Cache hit rates and sizing recommendations
  • Query response times
  • Table scans and index usage
  • Temporary disk tables
  • Abnormal connection events
  • Replication status
  • and more

Just a few of the critical MySQL metrics we monitor:

MySQL Query Cache

One of the more important elements for database tuning, LogicMonitor tracks your query cache hit ratio, as well as trending the activity. LogicMonitor’s intelligent multi-variable alerts can analyze and recommend different tuning options for the query cache – enlarging it, reducing it, or disabling it, in response to your usage.

MySQL Query Cache

MySQL Tablescans

An essential metric to trend over time – watching your table scan rates can tell you whether indexes are being used effectively, or whether the new application your team released is slowing the database due to the spike in table scans.

MySQL Tablescans

MySQL InnoDB statistics

LogicMonitor will detect the storage engines in use and track detailed statistics. Being able to see trends in “InnoDB buffer cache misses over time” is essential for proper MySQL tuning. (LogicMonitor even detects if you are using the Percona builds of InnoDB and adds monitoring for that).

MySQL Health Monitoring

linkedin icon twitter icon facebook icon github icon
  • Platform
    • Integrations
    • Security
    • Platform Demo
  • Pricing
  • Why LogicMonitor
  • Case Studies
  • Support
    • Professional Services
    • Developer Documentation
    • Academy
    • Release Notes
  • About us
    • Leadership
    • Employee Spotlight
    • Press
    • Careers
    • Diversity & Culture
    • Contact / Locations
    • Events
  • Resources
  • Blog
  • Partner Program
  • Community
linkedin icon twitter icon facebook icon github icon
  • Privacy Policy
  • Integrity & Transparency
  • Terms of Use
© Copyright 2022 LogicMonitor Inc.
We use cookies to provide and improve our services. By clicking "Accept all", you consent to use of all cookies.
Cookie settings ACCEPT ALL
Manage consent

Privacy Overview

This website uses cookies to improve your experience while you navigate through the website. Out of these cookies, the cookies that are categorized as necessary are stored on your browser as they are essential for the working of basic functionalities of the website. We also use third-party cookies that help us analyze and understand how you use this website. These cookies will be stored in your browser only with your consent. You also have the option to opt-out of these cookies. But opting out of some of these cookies may have an effect on your browsing experience.
Necessary
Always Enabled
Necessary cookies are absolutely essential for the website to function properly. These cookies ensure basic functionalities and security features of the website, anonymously. These include the Qualified chatbot, the Marketo cookie for loading and submitting forms on the website and page variation testing software tool.
Analytics
Analytical cookies are used to understand how visitors interact with the website. These cookies help provide information on metrics the number of visitors, bounce rate, traffic source, etc.
Save & Accept