
API Metrics: What and Why of API Monitoring
Tracking the right API metrics separates proactive teams from reactive ones. Here are the numbers that actually predict problems before users notice


Denton Chikura

The quick download:
If you are not measuring the right API metrics, you are not monitoring. You are just collecting noise.
-
The foundational API metrics (latency, error rate, throughput, and availability) form the baseline every engineering team needs before adding complexity.
-
Averages hide the outliers that hurt users most; track percentile-based latency (p95, p99) to surface the slowdowns that averages conceal.
-
Error rate and error type distribution together reveal far more than either metric alone: a spike in 5xx errors means something different than a spike in 4xx.
-
Build your metrics strategy around user-impacting signals first, then instrument internally, not the other way around.
As businesses increasingly rely on APIs to power their applications and services, ensuring optimal performance, reliability, and user experience has never been more critical. The key to understanding and optimizing the intricate workings of these digital bridges from both a technical and business perspective lies within the data gathered with API Metrics. Monitoring and deriving information from specific metrics can create leverage that keeps teams ahead of incidents and provides insight into optimization opportunities.
This article delves into which API metrics are most beneficial to monitor and why.
Summary of key API Metrics
| Metric | Benefit |
|---|---|
| Availability / uptime | Ensure minimal service disruptions and maintain a positive user experience |
| Response time / latency | Gain insight into the speed of API interactions potentially impacting user satisfaction and application performance |
| Request rate | Gauge the load on the API and identify patterns |
| Error rate | Quickly identify problems, prevent potential disruptions, and minimize user impact |
| CPU & memory usage | Understand how optimal resources are being used on the underlying infrastructure |
| Unique user count | Understand user engagement and optimize resource allocation |
| Cache hit rate | Optimize caching strategies and improve overall API performance |
The rest of the article discusses these API Metrics and the benefits of monitoring in detail below.
#1 Availability and uptime
Many things can cause downtime, including software updates, cyber-attacks, or a poorly optimized deployment setup. Still, one thing is certain: downtime directly translates to potential losses in user engagement and a negative user experience that damages trust. If users cannot access a website or service they are looking for, they might never return.
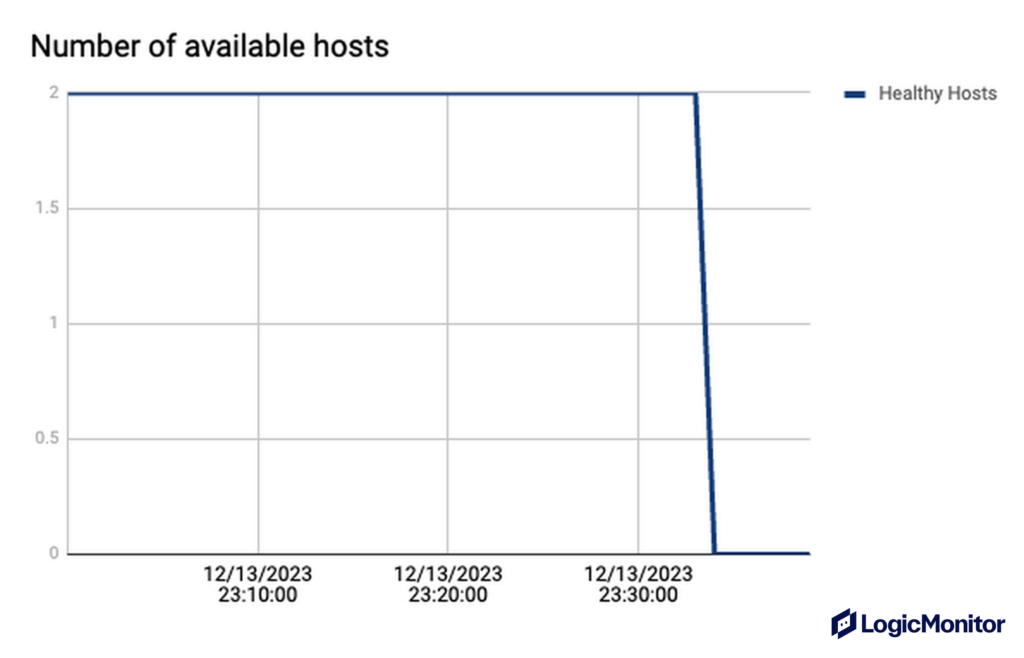
System failures
Tracking the number of available and healthy hosts for a given service while also looking at how many failures the system has in a given period is extremely important to proactively identify and resolve problems that prevent a 99.9% uptime. Mapping statistics to recent changes in code, infrastructure, or optimization attempts provide insight into any disruption’s root causes. In the below chart for example, if a deployment or any of the aforementioned changes were made just before the number of healthy hosts dropped, that is likely related to the cause.
To ensure high availability, one must strategically plan for geographic distribution and set up alert systems for early detection and response. For example, using cloud servers distributed around the globe to achieve redundancy and fault tolerance. In the event of a regional outage, traffic is rerouted to an alternative, operational region with minimal service interruption. Practices such as load balancing are also vital for maintaining optimal performance and resource efficiency.
Dependencies impacting uptime
It’s essential to recognize that an application’s uptime can be significantly affected by dependencies on other independent APIs, where performance issues in any of these external APIs can negatively impact your API’s availability. Therefore, it’s important to assess API reliability even in external networks and services
For example, an good Internet Performance Monitoring tool would enable you to monitor far-reaching network dependencies and set up proactive observability for the Internet’s most critical services, including BGP and third-party services like CDN and DNS.
#2 Response time and latency
The amount of time that passes between a user request and an endpoint responding directly is called latency. It influences the overall user experience, especially in an era where users expect instantaneous software interactions. Lower latencies increase user satisfaction and engagement as they enhance system efficiency and responsiveness.
Endpoint specific performance
Generating a clear picture of where exactly a service is having high latency is important. You should first identify whether a service is having latency as a whole or in just one or two endpoints, as this links directly to both cause and impact.
For example,
- If the latency for every endpoint on a service increases, it might point to a network problem or an issue with an external service like a third-party API.
- If only one of the endpoints responds slowly, a recent code change or change in how the database is queried is the main culprit.
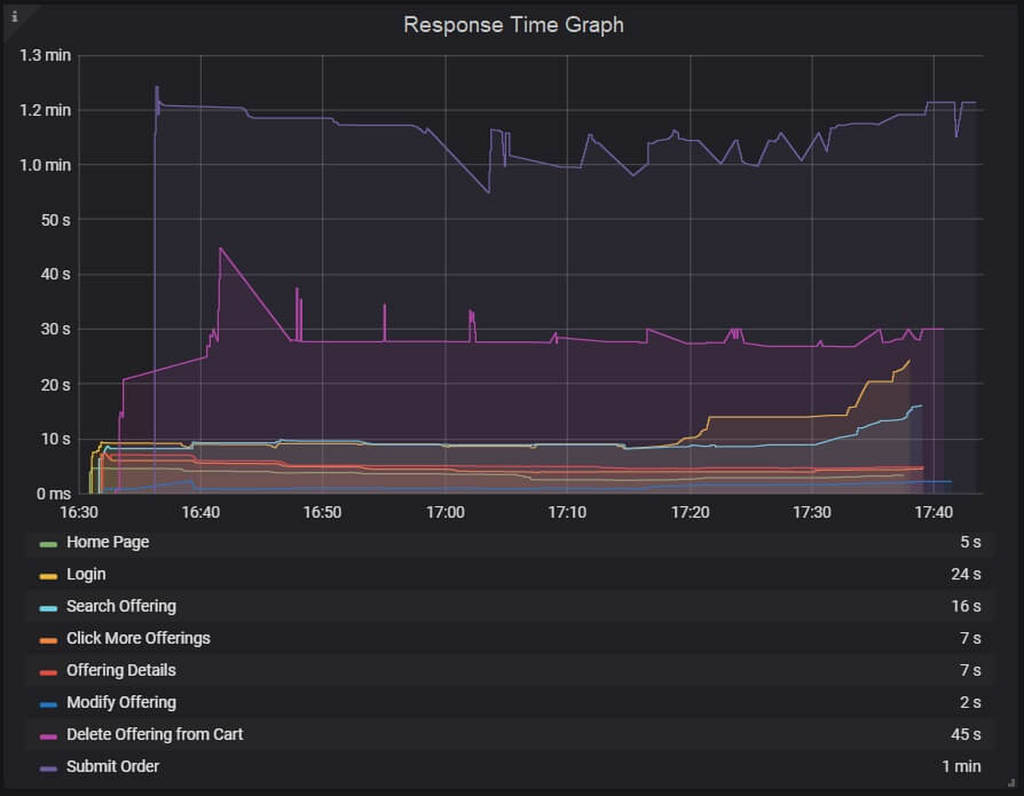
In the image below, only the third type of request has spiked in latency, indicating that the problem is likely isolated to that endpoint and its components alone.
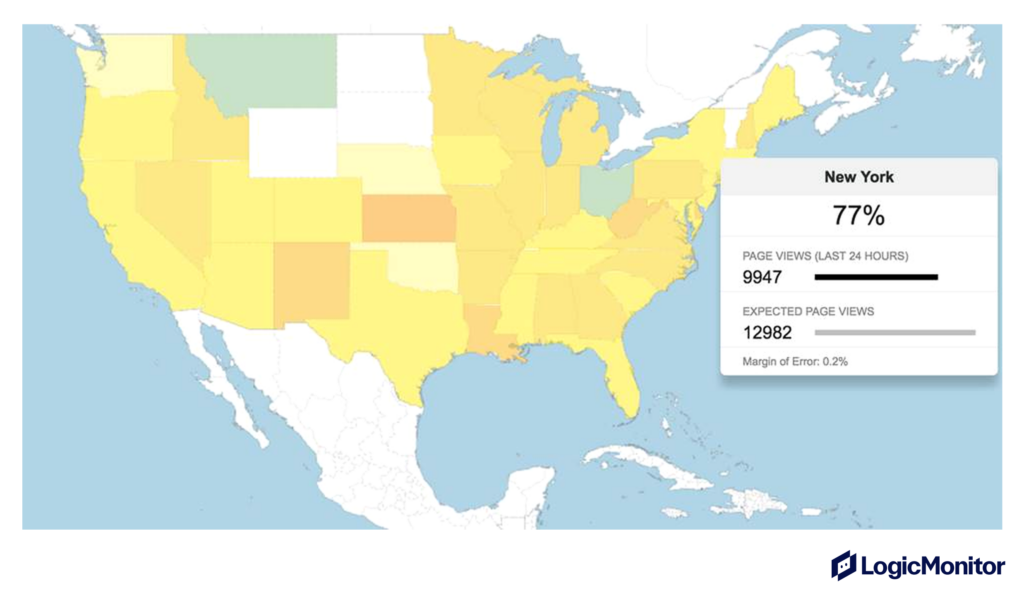
Geographic variances
It is generally good practice to categorize requests not only by the endpoint but also by requesting devices or regions. Analyzing response times in APIs in various locations helps ensure a consistent global user experience. You can quickly identify regions or subregions that may be suffering latency issues. It allows for different types of intermediate solutions, such as setting up pod links to route traffic from a suffering region to a region that is in a healthier state.
#3 Request rate
Request rate in API metrics provides valuable insights into usage patterns, user behavior, and potential issues. By identifying patterns in the number of requests you can tailor services to user needs, optimize resources, and plan for scalability.
Peak hour analysis
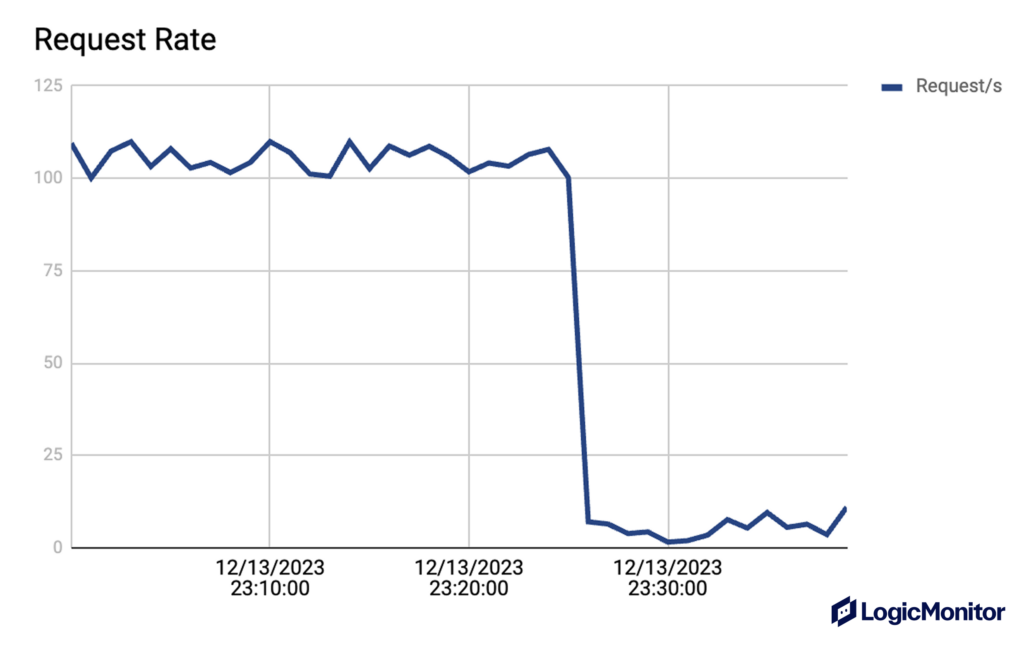
Understanding the ups and downs of request rates allows organizations to discern user behavior and adapt infrastructure accordingly. For instance, recognizing peak usage times, such as a surge in activity on Saturday mornings, allows teams to allocate resources effectively and ensure optimal performance during high-demand periods. Sudden changes in request rates, such as a drastic drop from 100 requests per second to just 3 (as illustrated in the chart below), can be an early warning sign that something might be wrong. This could indicate potential errors, server issues, or even malicious activity, prompting teams to investigate and address the issue promptly.
Cloud management with API metrics
Scaling services in a cloud-based environment programmatically and reactively becomes expensive and, in some cases, too slow. Your system may get overrun by large amounts of unexpected traffic, given certain circumstances. Therefore, it is important to monitor request rates over a longer period to be aware of any patterns or scenarios in which this could happen. An e-commerce store, for example, might notice that request rates spike and stay high only the week before a specific holiday. Having this information means they can allocate cloud resources most cost-effectively for their use case.
#4 Error rate
It might seem like a given to track and monitor errors. However, the error rate API metric goes beyond merely flagging errors individually. It tracks the rate at which errors occur and provides early issue detection, proactive problem-solving, and resource optimization. It can also help with things such as understanding issue severity.
Severity analysis
Distinguishing between, for example, an error that is occurring in 0.01% of all requests and an error occurring in 30% of all requests enables teams to prioritize responses based on the potential impact. While a minimal error rate may not warrant immediate attention, a higher error rate signals a more urgent need for investigation and intervention. This approach ensures that team time and energy are allocated effectively, addressing critical issues promptly without unnecessary distraction for minor glitches.
Error classification
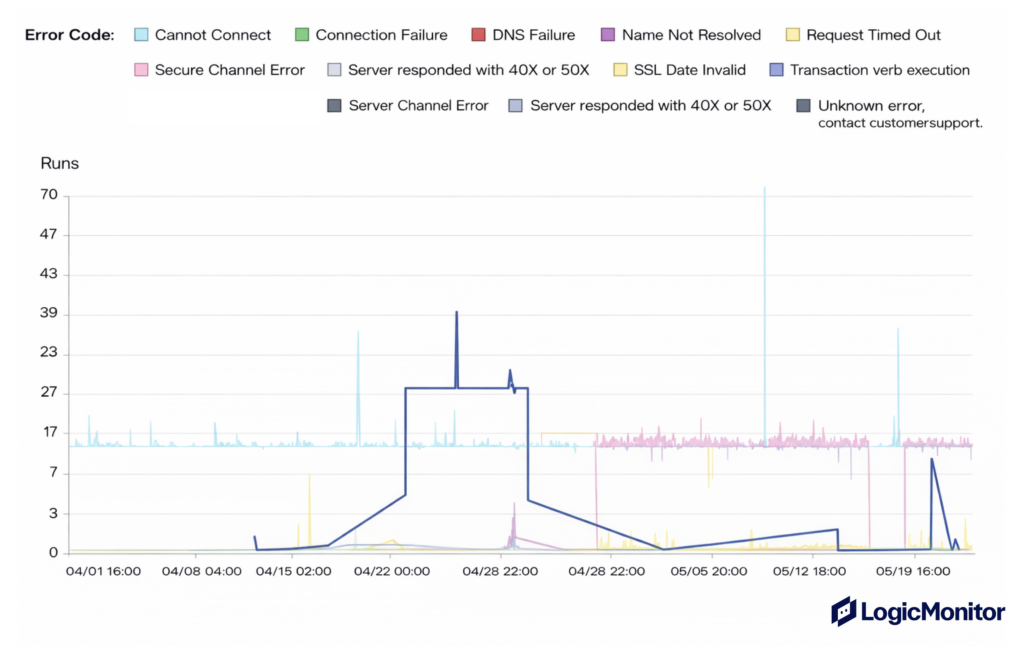
Additionally, monitoring not just the overall error rate but also specific error codes and reasons, such as 4xx or 5xx, offers deeper insights into the nature of problems. For instance, distinguishing between a 401 (Unauthorized) and a 404 (Not Found) helps pinpoint the root cause more accurately. This level of granularity aids in troubleshooting and streamlining the resolution process, contributing to the overall robustness and stability of the API
#5 CPU and memory usage
Monitoring the API metric—CPU and memory usage—is essential for understanding the health and efficiency of the underlying infrastructure supporting an API. These metrics offer insights into the resource utilization of machines and can play a pivotal role in maintaining optimal performance and reliability. Strained or overloaded machines significantly degrade API performance. These metrics help identify instances of resource saturation and can support teams in ensuring that the infrastructure operates within optimal resource thresholds.
Threshold violations
Assuming a thorough analysis has been done to determine how much base CPU and memory each deployed instance should have, it is important to define what is considered “normal” usage for a system. After defining normality, you can determine thresholds both on the high and low ends of usage, which can be used in scaling strategies in a cloud-based environment.
For example, if the CPU usage has reached a certain threshold indicating the container is overloaded, you can scale the service horizontally to help balance the load. Once traffic dies down, instances with extremely low CPU usage can be scaled down automatically. Recognizing these high and low usage patterns helps with resource planning. It influences the decision-making process of scaling pods vertically up or down long term and impacts cloud cost savings.
Resource utilization peaks
It is also important to be aware of when the peaks in resource usage occur for a service. That way, you can identify processes, such as scheduled tasks, that require extra resources and should be optimized. For example, if a newly deployed code or binary causes a spike in CPU usage, it may indicate a memory leak or suboptimal code. Noticing these resource usage peaks can potentially help teams identify and resolve any problems before they appear or affect the user experience.
#6 Unique user count
In the light of scaling and deciding how to allocate resources, the unique user count is another API metric that helps the decision-making process. Monitoring how many unique users reach a system helps identify patterns and provides further transparency on system health. It also provides insight into how users interact with the system.
User engagement analysis
Users can be grouped in various ways from individual users to grouped by country, timezone, or continent. Knowing the user base a bit better helps optimize marketing tactics. It is also another pattern that, when deviated from, could indicate a potential problem or side effect of a recent change. Consider an endpoint that is triggered every home page view, and patterns indicate an expected amount of triggers each day. A lower amount might be a one-off or could indicate something more urgent.
On the surface, an API that receives 1000 requests per second might seem like that is all there is to the story. However, noticing whether or not an API has received 1000 requests from 1 user in a second vs. 1000 individual users can also be the difference between preventing a Denial of Service attack on a system and recognizing fantastic user engagement.
Tracking unique user counts and grouping them into new users vs returning users when relevant can be useful in understanding more about user behavior, experience, and the marketing side of the business.
#7 Cache hit rate
When using a cache or content delivery network, one of the most challenging decisions can be deciding when to invalidate a cache and what to store in the CDN. For this, it is extremely valuable to have a clear understanding of how users interact with each of these important system components. Over time, these usage patterns provide invaluable insights if organizations are aware of them.
Successful hit rate
An important metric in this space is how often a certain cache entry or CDN entry is hit, or in other words, how often a specific piece of information is requested by a user. This API metric validates whether the current caching strategy is optimal or not. Markers that highlight something is wrong include:
- Static data in the cache that is never requested
- Something that is not in the cache is constantly requested
- Something in the cache that was being hit frequently is suddenly being hit only occasionally.
Miss rate
While one or even a few cache misses are by no means a problem, a larger number of them over time can result in a poor user experience. Subsequently, the rate at which an entity is requested and is not in the cache is just as informative. It can expose a potential optimization in the caching strategy. It could reduce latency and even in some cases, cloud and traffic costs.
Conclusion
We’ve reviewed some of the most important API metrics in monitoring. From availability and request rate to CPU usage and unique user count, keeping track of the above metrics can be the difference between having a robust system with high user satisfaction and losing customers due to a poor first impression.
Users in the 21st century expect things to “just work.” Monitoring the correct API metrics and proactively and reactively acting on the insights gained from them is crucial and lies at the foundation of achieving success. Navigating challenges and optimizing performance can become much easier for organizations, resulting in a shorter path to delivering a seamless and reliable digital experience for their users.
CHAPTERS
NEWSLETTER
Subscribe to our newsletter
Get the latest blogs, whitepapers, eGuides, and more straight into your inbox.
SHARE
See the API metrics that actually matter, not just the ones that are easy to collect.
LogicMonitor tracks p95/p99 latency, error distributions, and throughput across every endpoint in your stack, with anomaly detection built in.
FAQs
What is the most important API metric to track?
Error rate and latency percentiles (p95, p99) are typically the most user-impacting metrics. Error rate tells you how often requests are failing; latency percentiles reveal the slowness that averages conceal. Together they give you the clearest picture of what users are actually experiencing, not just what your infrastructure looks like on average.
What is the difference between latency and response time?
Response time is the total duration from when a client sends a request to when it receives the full response. Latency typically refers to the network delay component: the time a request spends in transit. In practice the terms are often used interchangeably, but when diagnosing performance issues, separating network latency from server processing time helps isolate the root cause.
What does p99 latency mean and why does it matter?
p99 latency is the response time that 99% of requests fall at or below; it captures the slowest 1% of requests. For many applications, slow outliers hit your most active or highest-value users disproportionately. Monitoring p99 ensures you are aware of the tail latency that shapes real user experience, which averages reliably hide.
How many metrics should you track for an API?
Start with the four foundational metrics: latency (p95/p99), error rate, throughput, and availability. Add resource utilisation and payload validation metrics as your system matures. Avoid collecting metrics you have no process to act on. Metric sprawl creates dashboards that look busy but do not improve your response time when something actually breaks.

By Denton Chikura
Technical Writer

Denton Chikura is a technical writer and longtime observability advocate focused on helping site reliability engineers and engineering teams discover the tools and capabilities that strengthen internet resilience. He works at the intersection of monitoring, performance, and infrastructure to make complex systems more understandable and usable, bridging the gap between deep technical detail and real‑world operations. His goal is to help teams build faster, detect issues earlier, and recover smarter, ultimately making the internet a better, more reliable place for everyone.
Disclaimer: The views expressed on this blog are those of the author and do not necessarily reflect the views of LogicMonitor or its affiliates.
© LogicMonitor 2026 | All rights reserved. | All trademarks, trade names, service marks, and logos referenced herein belong to their respective companies.
