In this article


If you’re an avid reader of our release notes and press releases (if not, you should check them out), you already know that we just released a big upgrade to our Network Traffic Flow Analysis (formerly known as Netflow) with a beta release of the new LogicMonitor UI.
What you might not know is how the new Network Traffic Flow can help you to determine exactly where your network traffic comes from with the added ability to do things like:
- Easily view flow data from highest use devices
- Access further granularity into busy device metrics
- Drill into the port data based on established filters
- Consume network flow data in beautiful, graphical widgets such as pie charts and time series graphs.
Believe it or not, we really do use LogicMonitor internally to monitor the performance of our own infrastructure (including the equipment running the LogicMonitor platform). Last week our IT Ops team used these capabilities to investigate some network issues on one of our office networks and we thought we’d share it with you.
How it worked:
1) LogicMonitor triggered an alert for latency to an office network and some users complained that the network was slow (Sound familiar?).
2) As a debugging action the engineer opened the Network Traffic Flow dashboard for that office network.
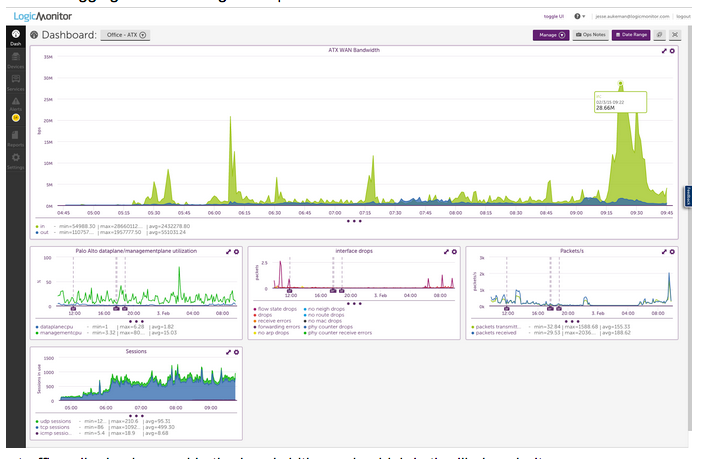
3) The engineer spotted a large traffic spike in the bandwidth graph.
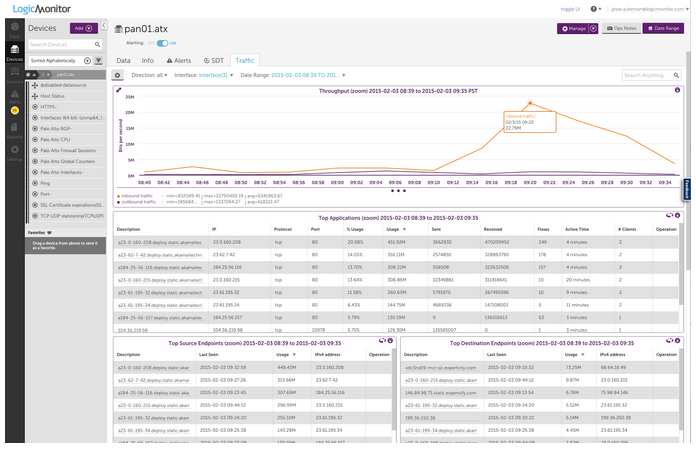
4) The engineer drilled into further detail with traffic data (Netflow) for the office firewall. Here he isolated the time frame of the event and saw the breakdown of the traffic details.
5) Then the engineer viewed details of the top applications and noted that the bandwidth was caused by some simultaneous large downloads through Akamai. Additionally, he isolated the top internal user’s IP.
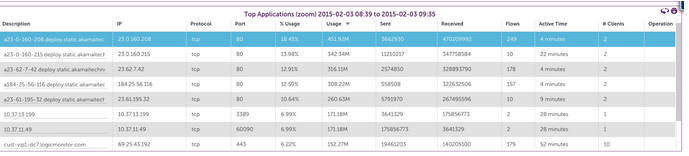
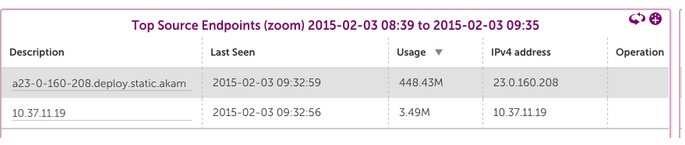
6) From this information he learned that the traffic spike was caused by several large downloads from Adobe to a specific user. To alleviate the immediate issue, the user paused the downloads, and the issue was resolved. (Of course, the underlying bandwidth capacity is still an issue.)
The quick availability of the Network Traffic Flow data through LogicMonitor frequently helps us fix network problems and is the basis of discussions with users on bandwidth utilization policies and controls to help prevent issues in the future.
For more information visit the help docs.


Subscribe to our blog
Get articles like this delivered straight to your inbox