SaaS or Software–as-a-Service is a term that describes many applications on the web today. Whether you’re using TurboTax (tax season is coming up) or Twitter, most people use SaaS platforms on a daily basis without even realizing it. Many businesses rely heavily on SaaSs to support their business via customer relationship management tools (CRMs) like Salesforce, internal systems like Atlassian’s Jira and Confluence, and broad inter-and intra-company communication via platforms such as Office 365 and Zoom. Monitoring all of these separate SaaS applications can be time-consuming and challenging.
The most basic reason is to make sure that your SaaS is not standing in the way of completing your business-required tasks. That could be as simple as adding email or as complex as managing a large-scale marketing campaign. Each of these tasks has a different risk tolerance and impact. It may also be important to understand either the status (is it up or down) or even specific performance values (requests are taking more time than expected).
You may also choose to monitor your usage based on the limits of your SaaS. Whether those be licenses used, space limits, or API calls, all of these could be over-provisioned or hitting thresholds that limit a SaaS’s ability to function well.
Being able to monitor all of your SaaS applications and all of their important metrics and statuses in one place allows you to have clarity on the business impact and availability of your SaaSs.
What Metrics Should You Monitor?
Most SaaS applications offer some level of status metric. The most basic level is whether the entire SaaS is online and functioning properly. While this level provides the least amount of actionable information, it can be a good start.
Diving a level deeper would be monitoring the status of your specific implementation of the SaaS. That ranges from looking at the specific region your SaaS is hosted within the SaaS application to looking at specific interactions on your APIs.
Going even further, metrics monitored should include API call rates, response times, reads and writes of data, user logins, quality of service, and any other metrics that prove a given SaaS is working to its fullest potential and helping improve business performance. You also want to be alerted when any of these metrics fall outside of normal operating realms for your organization.
Last but often not least, you want to monitor usage compared to limits. Storage capacity out of a max limit could require you to pay for more space or stop being able to store new data. This would lead to a major business interruption. Unused licenses could incur monthly costs that could be eliminated so monitoring your consumed licenses verse a limit is also a common metric.
You’ll also want to be alerted of any events that occur within the SaaS that could result in poor user experience, whether that be an internal stakeholder or an external contact. Many SaaS applications can also provide these metrics.
How to Monitor SaaS in LogicMonitor
Adding monitoring for SaaS applications should not be prohibitively hard. Many SaaS applications allow monitoring and metric information via APIs. LogicMonitor allows you to provide a few simple fields that can be added to allow LogicMonitor to call those APIs and gather data.
LogicMonitor utilizes an agentless collection of metrics to allow extreme ease of monitoring and quick implementation. Simply give a couple of fields which are often a combination of Client ID, Authorization Token, API Key, or Secret Key, and be on your way to monitoring.
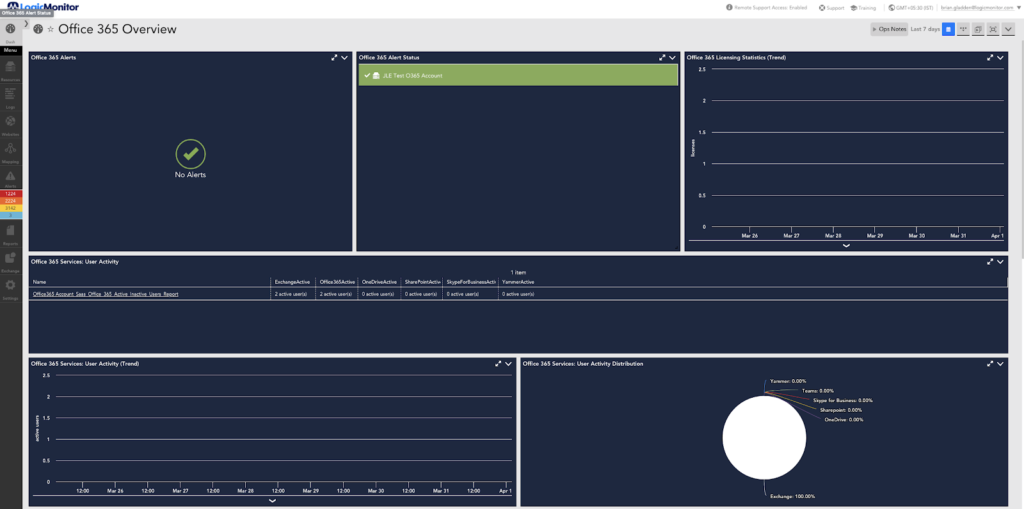
LogicMonitor provides out-of-the-box DataSources and EventSources that pull back metrics to be monitored. These metrics are gathered on dashboards to be viewed and interpreted easily.
Adding O365 Monitoring in LogicMonitor
Disclaimer: The views expressed on this blog are those of the author and do not necessarily reflect the views of LogicMonitor or its affiliates.