In this article


Azure monitoring made simple and effective
With Azure Virtual Machine (VM) Scale Sets you can automatically scale the number of VMs running an application based on the compute resources required. VM Scale Sets make it easier to deploy and manage a large number of Virtual Machines consistently and allow you to use and pay for the minimum resources needed at any given time, but they also introduce a few monitoring challenges. VMs are automatically created and terminated as needed based on pre-configured criteria, which can make it challenging to keep monitoring up to date. Additionally, applications usually run across multiple VMs in a VM Scale Set. Combined with the frequent creation and termination of VMs, this can make it difficult to get a consistent view of application performance over time. To achieve comprehensive visibility, your monitoring tool should include automated resource discovery, meaningful metrics for Azure VMs and any running applications, and the ability to aggregate data across VMs in a VM Scale Set.
Automate resource discovery
You may choose, for example, for the number of VMs in a VM Scale Set to be auto-scaled based on CPU usage. As the CPU usage for the VMs in the set reaches a pre-configured threshold, new VMs are added. Similarly, as CPU usage for the VMs falls below a pre-configured threshold, existing VMs in the set are terminated. To maintain comprehensive visibility into your applications and underlying VMs, it’s important that new VMs are added into monitoring in a timely manner after creation, and that terminated VMs are removed from monitoring to avoid clutter. Without an automated solution, it can be challenging to keep monitoring up to date. You should use a monitoring tool with dynamic discovery that adds and removes these VMs to and from monitoring automatically. LogicMonitor uses the Azure Resource Manager APIs to automatically discover new VMs and add them into monitoring, as well as to identify terminated VMs and remove them from monitoring. Data collection and alerting starts immediately once a VM is added into monitoring, ensuring instant visibility.
Monitor meaningful metrics for VM Scale Sets
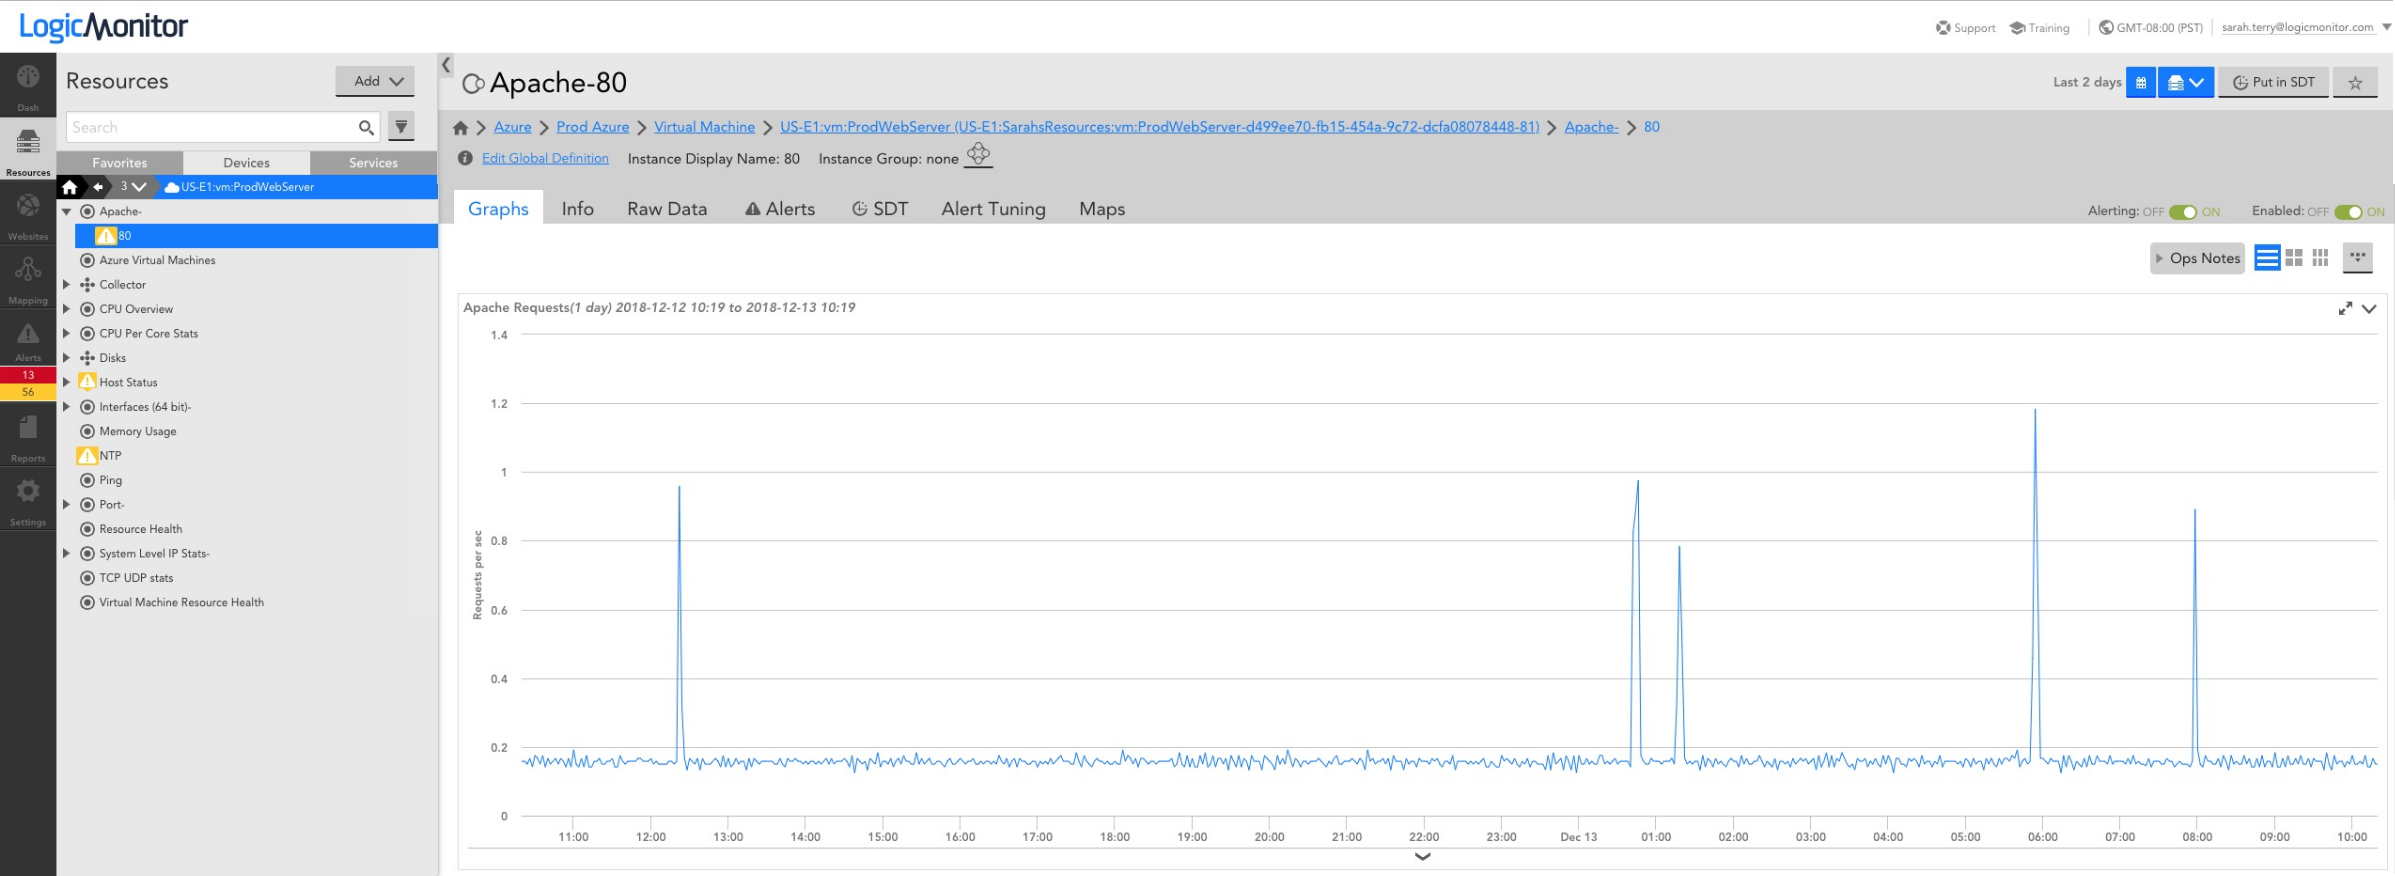
Some VM metrics are available via Azure Monitor – these basic metrics include CPU usage, bytes received and sent on network interfaces, and disk read/write operations. What these metrics don’t include are operating system (OS) level metrics like disk usage and memory usage, as well as application-specific performance metrics. You can extend Azure to collect the OS level metrics by enabling the monitoring diagnostics extension, or you can use a monitoring tool that uses an agent or collector to make queries to the VMs to get OS and application-specific metrics, typically in addition to the basic metrics available via Azure Monitor. An agent-based approach may require custom automation to ensure that an agent is installed on every VM that is created in the VM Scale Set, and that agent versions remain consistent and up to date, while an agentless solution such as the LogicMonitor Collector can be installed anywhere (including outside of the VM Scale Set) and just needs to be able to make requests to the VMs in the set. The LogicMonitor Collector relies on traditional protocols such as SNMP, WMI, HTTP, and JDBC to collect the basic CPU and network interface metrics you’d get from Azure Monitor, as well as the OS level metrics such as disk usage and memory usage, and performance metrics for any running applications. This approach will provide you with more comprehensive monitoring for each of the VMs running in your VM Scale Set.
Aggregate data across VMs
A monitoring solution with automated discovery can help ensure that what’s in monitoring reflects the VMs in your VM Scale Set at any given time, but it’s also important to ensure that you have a consistent view into application performance, regardless of changes to what VMs are running in the VM Scale Set. Terminated VMs may be removed from monitoring when they no longer exist, but retaining the performance data for the applications running on those VMs is critical to understanding how the applications are performing over time. Such an understanding can help you identify how releases and other changes impact application performance. By aggregating data across VMs in a VM Scale Set, you’ll get visibility into overall application performance, and how that performance is changing over time. With LogicMonitor’s LM Service Insight, you can dynamically group together monitored resources, such as VMs in a VM Scale Set, into a logical service. Key performance indicators can be aggregated across grouped resources to obtain insight into the performance of the overall application. For example, you might group together VMs that belong to a common VM Scale Set ‘prodScaleSet’ like so:
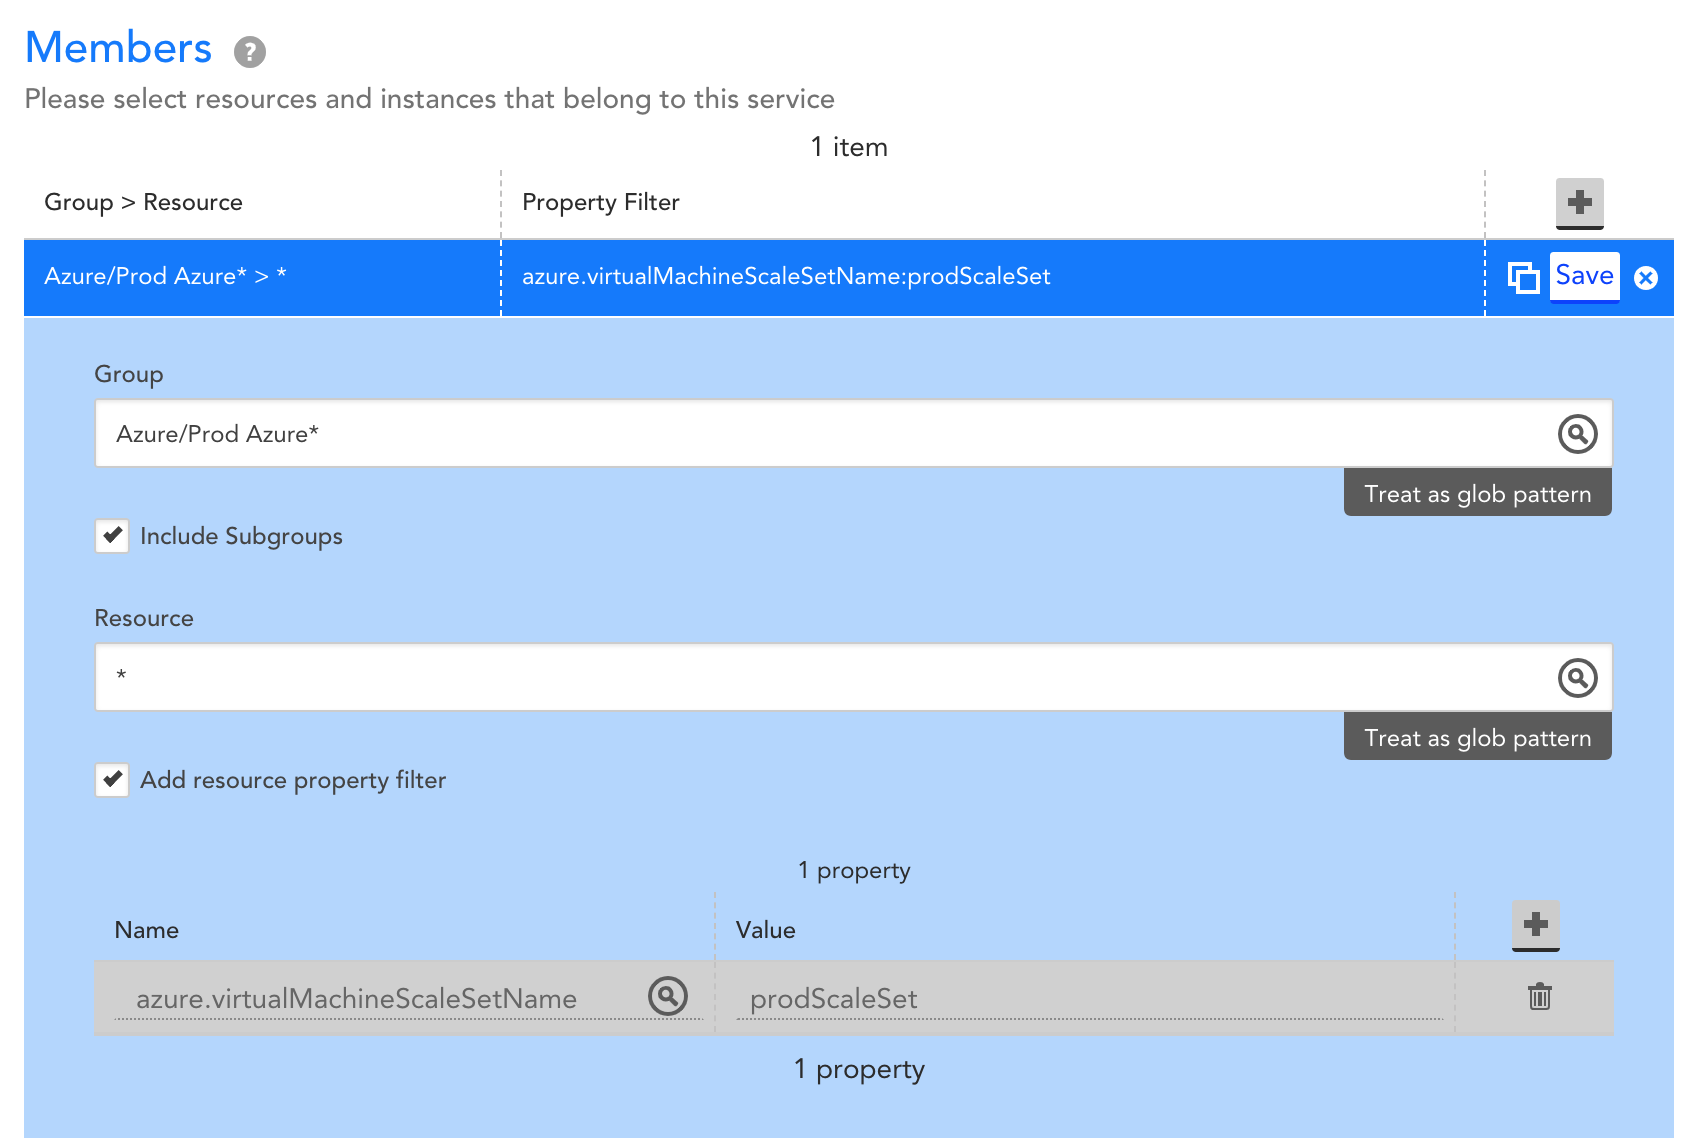
Let’s say the VMs in this Scale Set are supporting a web application, and running Apache web servers and MySQL databases. You may choose to aggregate performance metrics across the VMs like this:
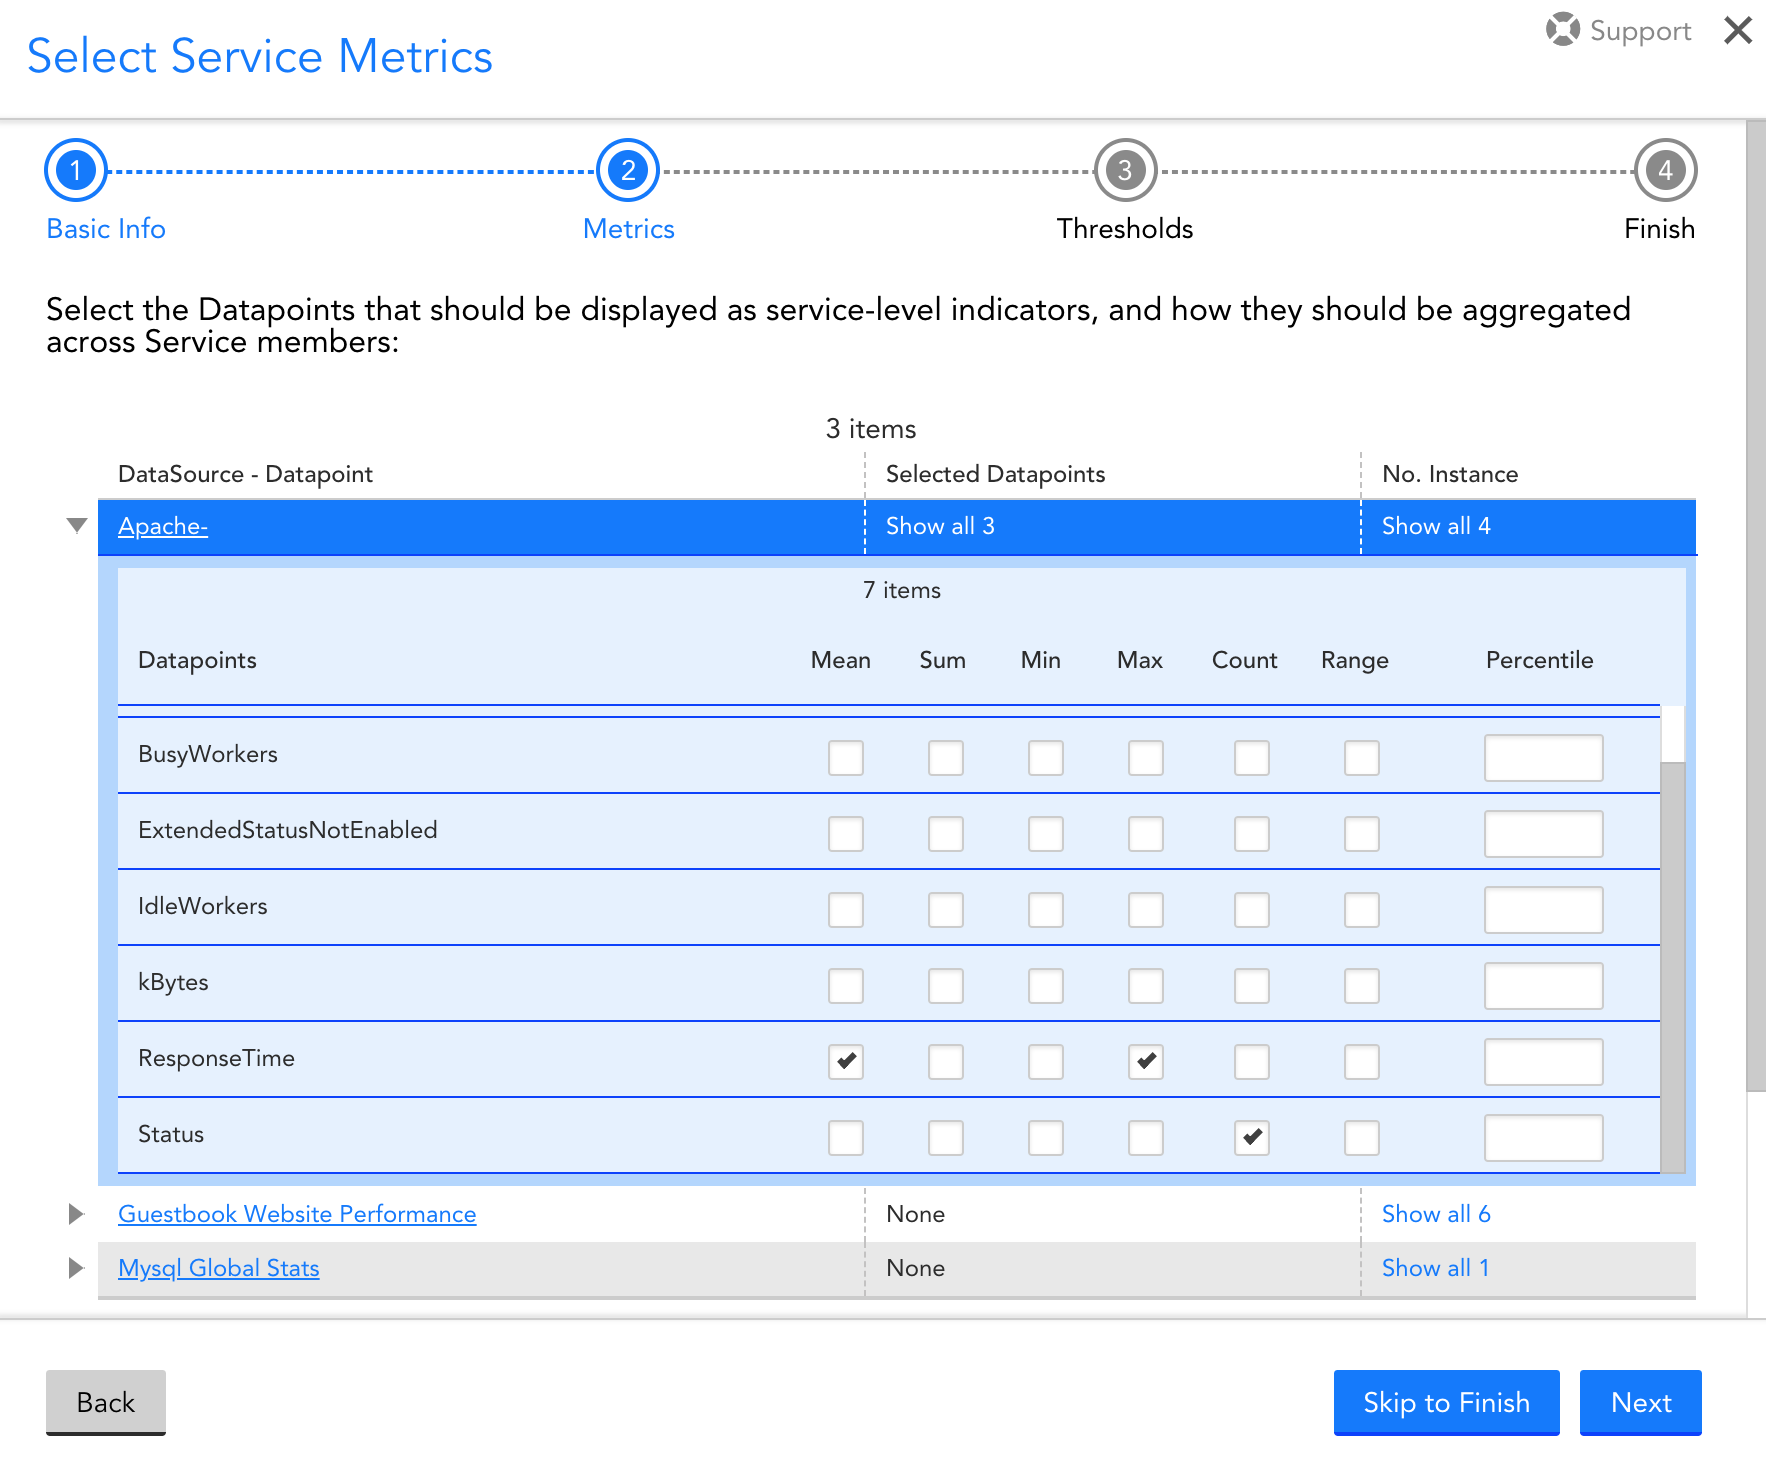
The resulting service will provide you with visibility into the aggregate performance of the web application. As VMs are created and terminated within the VM Scale Set, LogicMonitor will automatically add and remove VMs as needed, the VMs that data is aggregated across will be automatically updated, and you’ll retain this consistent visibility into overall performance:
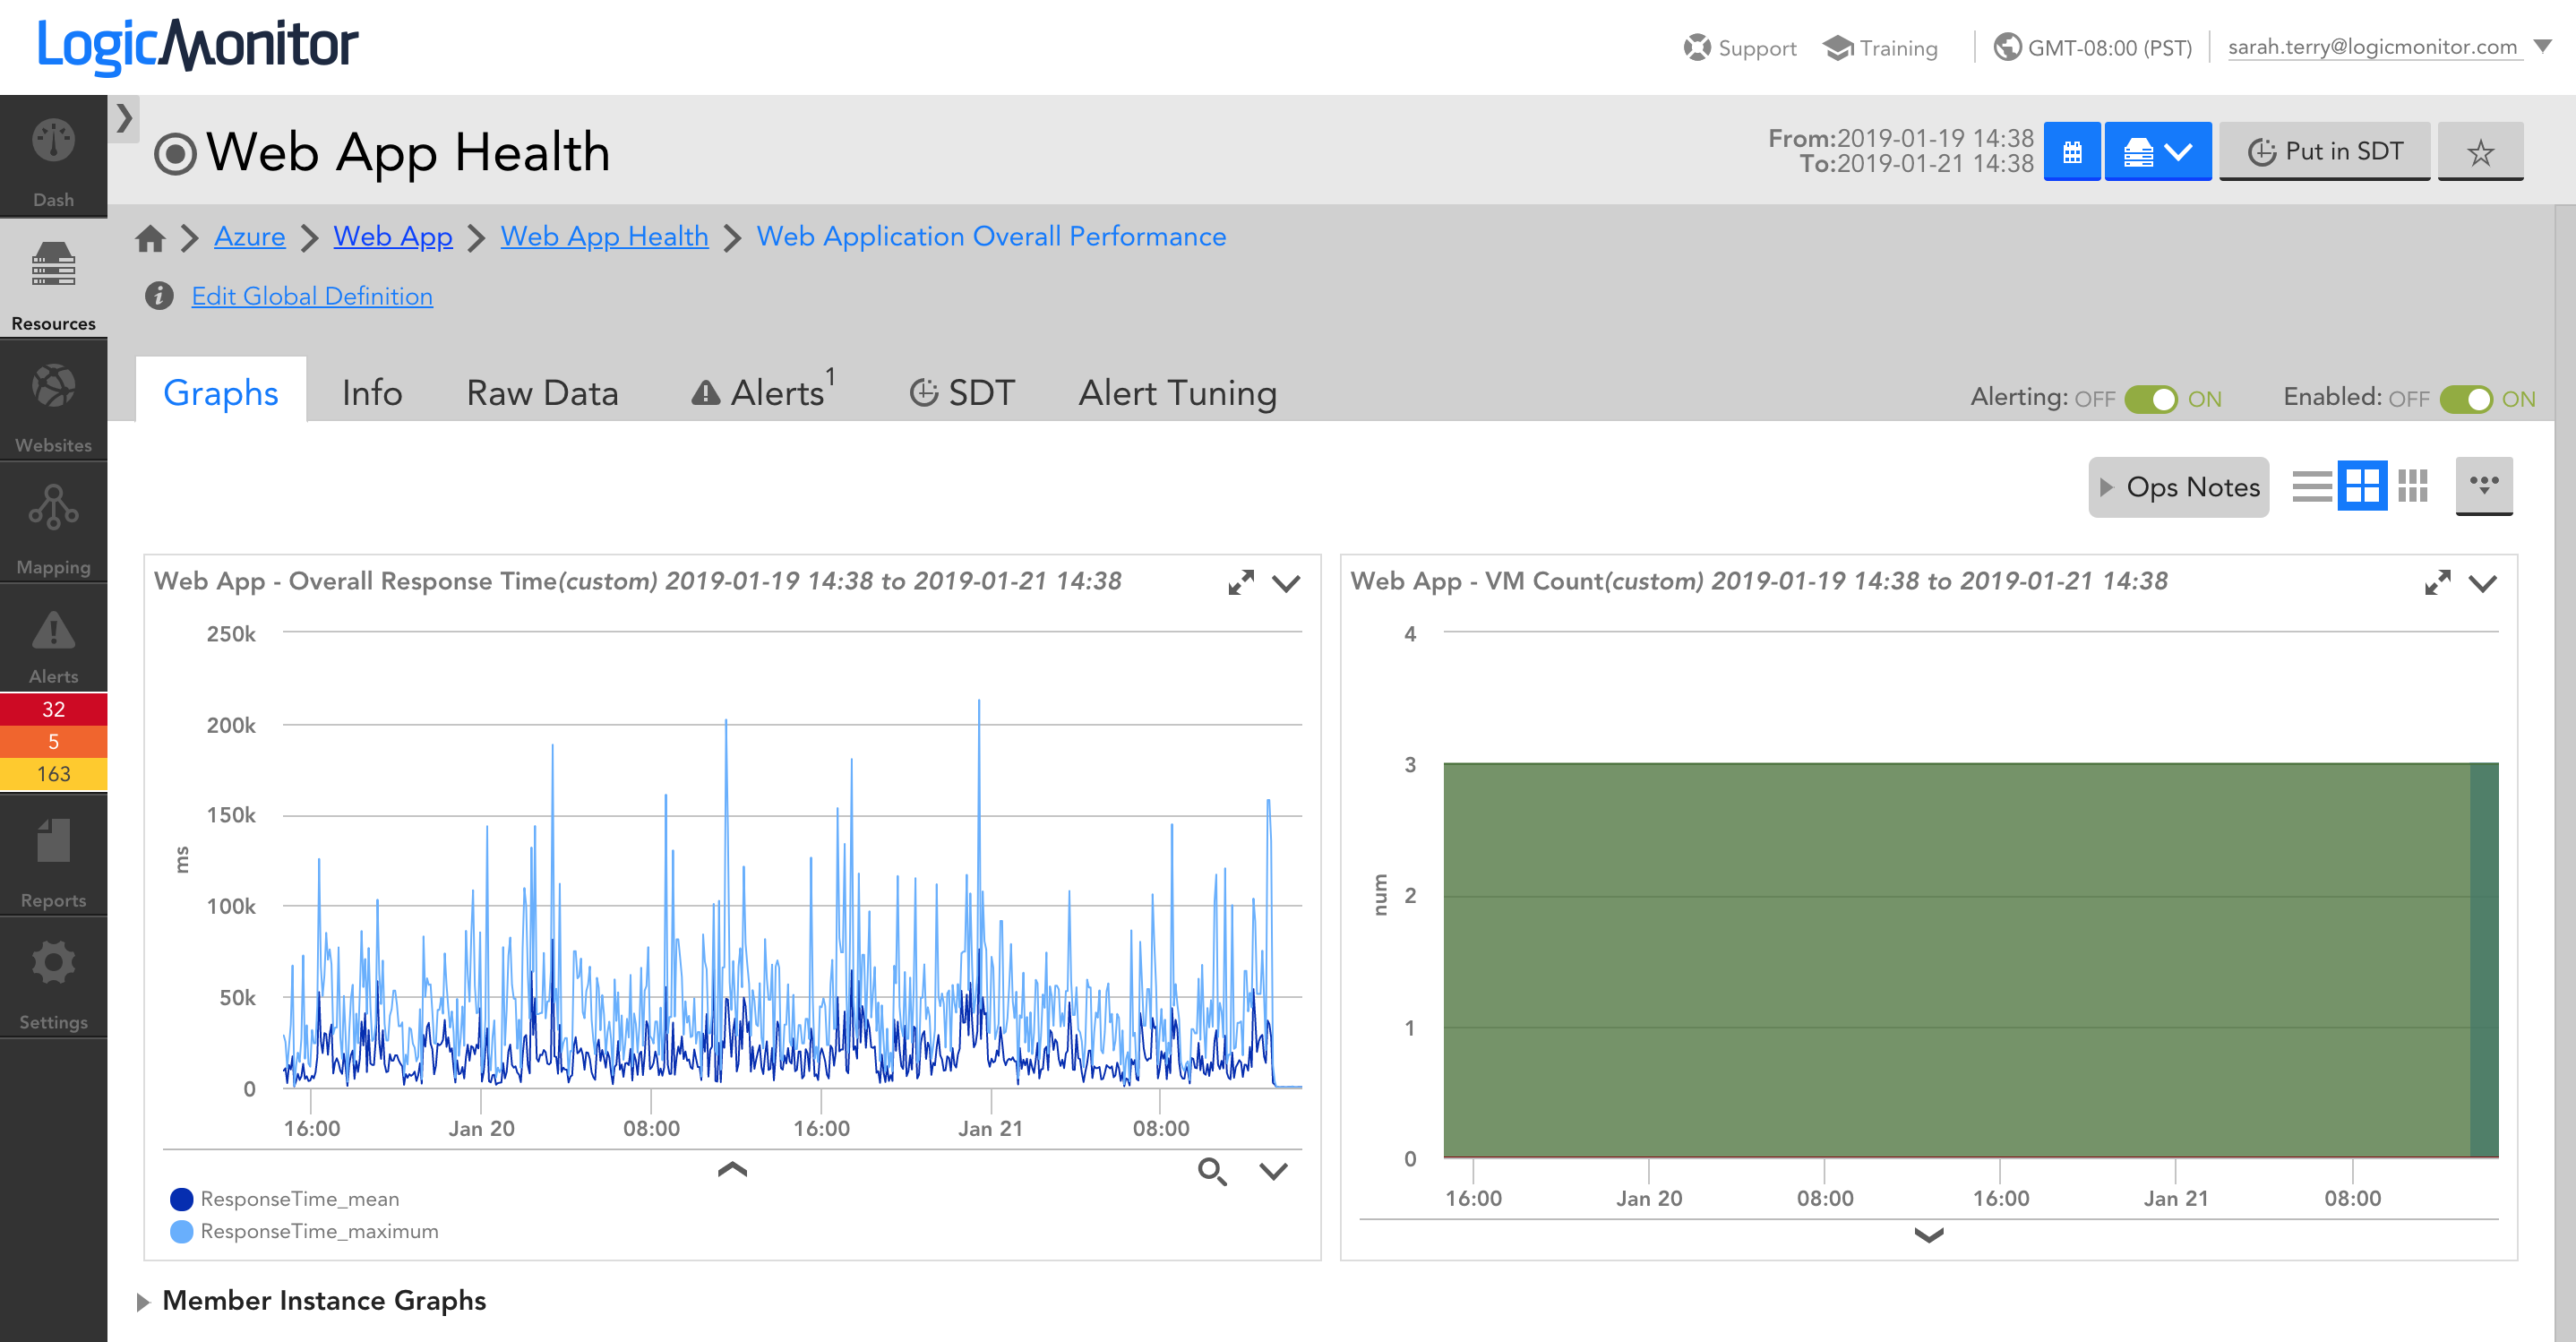
This means that performance data will persist as VMs in the Scale Set change, and you’ll be able to correlate releases and configuration changes with trends in application performance over time.
Additionally, you can configure alerts on this aggregate performance data, such that triggered alerts reflect your overall web application health and performance. This means that an individual VM alert that does not impact the overall web application’s performan
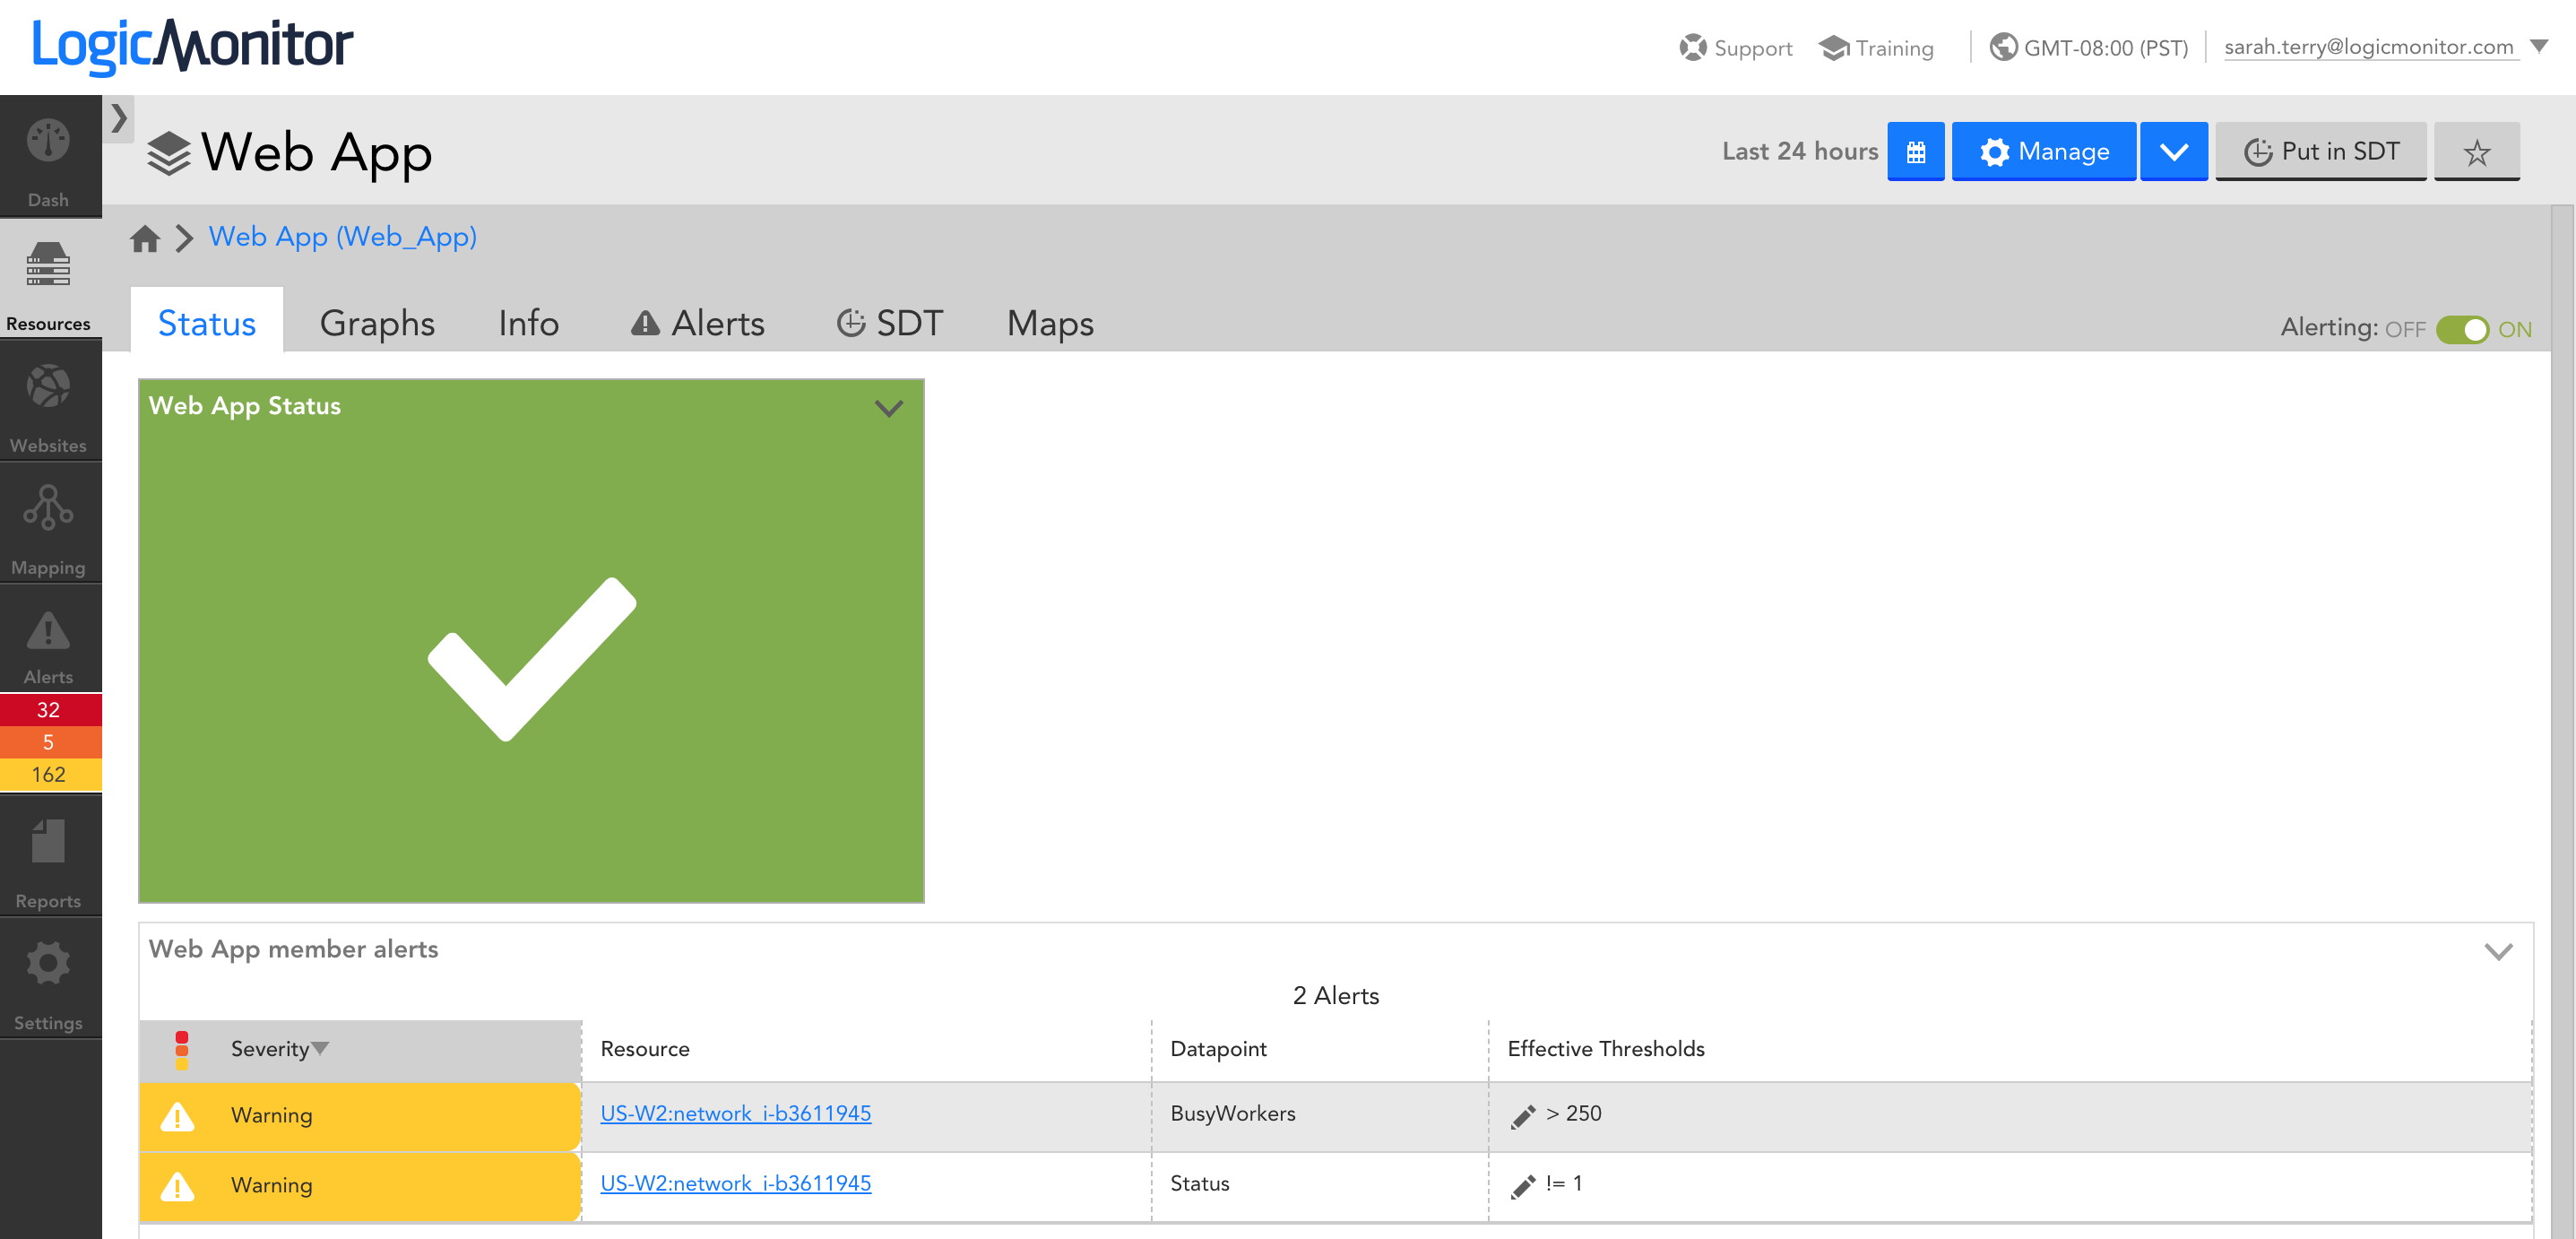
ce can be distinguished from a VM alert that does impact overall application performance. With LM Service Insight, a status page is created based on alert thresholds set for aggregate data, enabling you to see overall application alert status alongside alerts for the underlying VMs:
In summary, to comprehensively monitor Azure VM Scale Sets, you need a monitoring tool that has comprehensive VM monitoring, automated resource discovery that will keep monitoring up to date, and the ability to monitor and alert on data aggregated across your VMs. LogicMonitor does this all out of the box- sign up for a free trial today!

Subscribe to our blog
Get articles like this delivered straight to your inbox