Log data should provide insights, not bury them. But when you’re overwhelmed by a mountain of messages and noise, it feels impossible to find what matters the most.
That’s what LM Logs Query Tracking helps with. Instead of guessing what to look for, or running the same queries over and over, you can now track key log patterns that predict issues before they happen and take action fast. Because when you see clearly, you can lead confidently. This means, you can focus on what’s changing in your environment and act accordingly to reduce the risk.
Query Tracking is now available for all LM Logs customers, making it easier than ever to access the insights that matter most.
TL;DR
Query Tracking in LM Logs turns saved log queries into metrics you can visualize and alert on automatically
Spikes in log frequency often reveal issues before you’d notice them in individual log messages
Stacking tracked queries in dashboards helps you compare patterns across severity levels and spot log anomalies fast
LogicMonitor’s dynamic thresholds and tracked queries give more control over alerting and cut down the noise
What Is Query Tracking in LM Logs?
Query Tracking in LogicMonitor Logs is like adding a spotlight on the signals that matter most in your log data. Instead of sifting through endless log lines manually or re-running the same searches, you can now track key queries automatically. Each tracked query becomes a metric, visible in your dashboards and ready to trigger alerts the moment something changes.
Simply put, it’s a way to shift your team from reactive log analysis (reacting to issues after they appear) to monitoring early change signals, fast and with full confidence.
Why Log Spikes (Not Just Messages) Deserve Your Attention
Most log messages don’t tell you much on their own. What matters is the sudden surge in how often the pattern shows up. Suppose you usually get a handful of “INFO” logs from a server every hour. But after a patch rollout, that number suddenly triples. Even if the message content hasn’t changed, that spike may mean something’s not right. Maybe a service is restarting unexpectedly or a config setting isn’t playing nicely.
That’s where you should use Query Tracking. Rather than scanning every log line, it watches the frequency of the patterns and flags when something starts behaving out of the ordinary.
Let’s understand this with an example:
Track this query:
_resource.group.name = “Windows Servers” AND level = “ERROR”
If this error count suddenly rises from 5 events per hour to 50, you’ll see it immediately in your dashboard before the support tickets start rolling in.
With Query Tracking, you can stop digging through logs and start seeing patterns that actually need your attention.
How Query Tracking Works in LM Logs
Query Tracking lets you save a log-data search query and turn it into a LogicMonitor data point. That means you can now visualize that query on a dashboard, track it over time, and get alerts on unexpected changes. This way, you don’t have to do any manual checks.
Think about some of the queries you may already be running in LM Logs. For example, tracking different severity levels of log events in your Windows servers:
_resource.group.name = “Windows Servers” AND level=“INFORMATION”
_resource.group.name = “Windows Servers” AND level=“ERROR”
_resource.group.name = “Windows Servers” AND level=“WARNING”
Now, instead of running these queries manually, select one and click “Track Query” in the dropdown menu. LM will automatically monitor how often the matching log events show up and turn the query into a metric that updates every five minutes.
Query Tracking within LM Logs
Why does that matter? Because the content of each individual log line isn’t always useful. But the pattern (the frequency) can be. If you suddenly see a spike in “INFORMATION” log events after an OS update, that may be worth your attention. With Query Tracking, you can catch those changes early, visualize them in dashboards, and make proactive decisions based on trends.
No more logging in just to check if something’s changed. LogicMonitor does the watching for you.
Visualize Log Trends with LM Dashboards
LogicMonitor dashboards visualize infrastructure health and help you track trends in your log data. Its Query Tracking feature converts each saved query into a metric you can chart, compare, and alert on.
The message doesn’t always matter. It’s the spike in volume that tells you something’s changed.
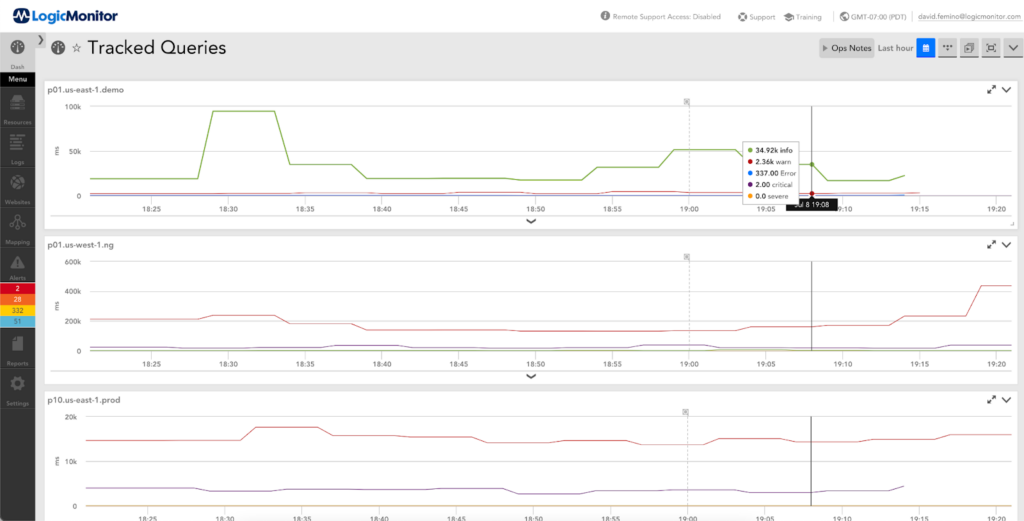
You can even stack multiple tracked queries like “INFO,” “WARNING,” “ERROR,” and “CRITICAL” events into a single custom graph. This gives a clear view of log activity across a resource group without needing to read through each message.
Viewing counts of tracked queries
But that’s the high-level overview of the LM Dashboard. At the backend, LogicMonitor’s machine-learning algorithms learn what “normal” looks like for each query and then detects anomalies, such as unexpected deviations in log volume that could signal a problem.
For example, if you recently pushed out a batch of Windows patches and suddenly see a spike in “ERROR” or “CRITICAL” logs, LogicMonitor’s dynamic thresholds will trigger alerts on those tracked queries. That early signal lets you respond faster and reduce the risk of downtime or degraded performance.
By focusing on patterns instead of individual log lines, LM dashboards help spot early warning signs and turn raw log data into action before users are impacted.
Build Smarter Alerts and Proactive Workflows
Query Tracking gives you a smarter way to automate alerting and build more proactive workflows.
For example, if you’re monitoring Windows Servers, create a custom graph in LM Dashboards where the data source is “LM Logs Tracked Queries.” This way, you can stack and compare log levels like:
“INFO”
“WARNING”
“ERROR”
“CRITICAL”
With that view, you’re no longer reacting to individual log lines; you’re watching the trend. Maybe you notice a slow increase in “WARNING” events or a sudden jump in “ERROR” after a patch. Those are the signs worth investigating.
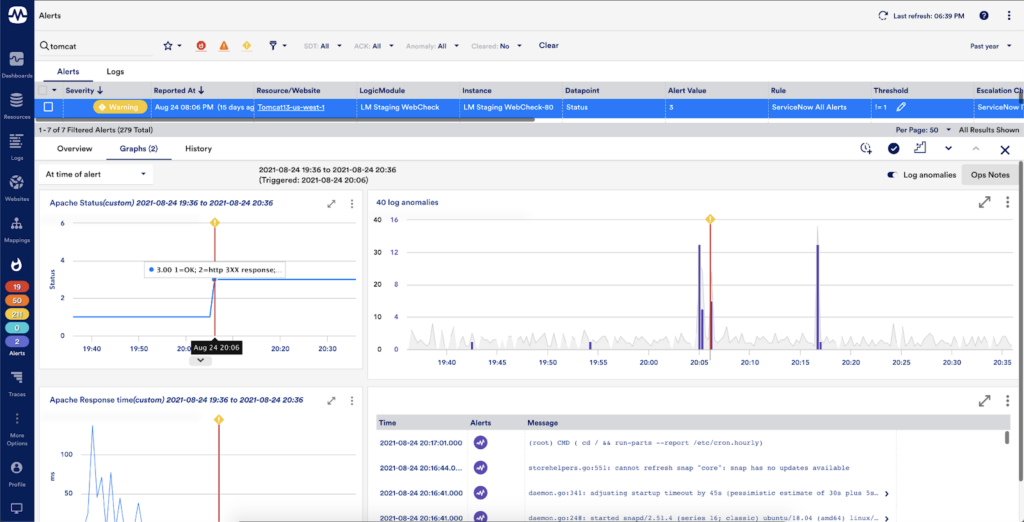
The real value comes when you pair tracked queries with dynamic thresholds. LogicMonitor automatically establishes a baseline for each query and flags anomalies when log volumes deviate from the norm. That means you’re alerted when something changes and not just when a hardcoded threshold is hit.
Metric-based alerting with log data
Tracked Queries also give more control over log alert conditions. You’re not limited to firing alerts when a specific log message appears. You can now alert when the count of log events rises unexpectedly. This allows you to fine-tune alerting conditions based on actual behavior, not just assumptions.
See how LM Logs clarifies K8s environments by unifying metrics and logs.
_resource.group.name = “Windows Servers” AND level = “INFORMATION”
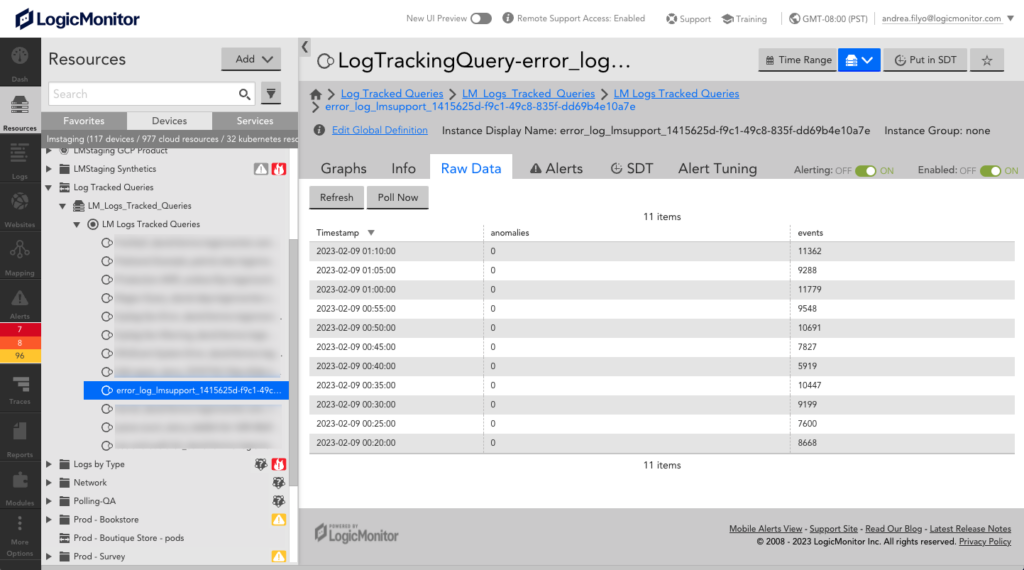
On a typical week, this query may return thousands of low-level logs… lots of noise, not much actionable insight. But once you enable Query Tracking, LogicMonitor starts monitoring how often those logs appear and records their frequency over time. As a result, you get a time-series metric, saved to a special resource group called Log Tracked Queries.
Viewing trends of tracked queries
This makes it easy to:
Spot unexpected spikes (or dips) in log volume
Filter the raw logs for the exact time range that needs investigation
Add tracked queries to dashboards or set up alerts based on trend deviations
Here’s a quick checklist to get started:
Run a log query in LM Logs that you want to track (e.g., by severity, service, or keyword).
Click the dropdown next to the saved query and choose “Track Query.”
Go to your LM Resources and find the Log Tracked Queries group.
View your tracked metric – updated every five minutes.
Add it to a dashboard or configure alert thresholds for smarter monitoring.
Whether you’re tracking ERROR logs across your fleet or watching for unusual bursts of INFO events, Query Tracking gives you a high-level view without losing access to the details.
Surface What Matters in Your Logs
You don’t have to wait for a critical alert, or a user ticket, to realize something’s wrong. With Query Tracking, LogicMonitor helps you stay ahead by showing you what’s changing in your logs before it becomes an issue.
Getting started is easy: Start with the log queries you already rely on. Track them. Visualize them. Set alerts that catch unusual patterns as they emerge.
Ready to turn log noise into early warning signals?
Take one of your Saved Searches and start tracking today.
Or talk to your LM admin about rolling out tracked queries across your environment.
With LogicMonitor, you can clearly see when it’s time to start log analysis.