How to Monitor AWS Direct Connect with LogicMonitor
AWS Direct Connect provides a dedicated network connection between on-premisess and AWS environments. Such a connection can be more reliable and increase the uptime of your services because you’re unlikely to be impacted by an ISP’s availability issues, as is the case with traditional, internet-based connections.
2 min read
January 3, 2018
In this article
NEWSLETTER
Subscribe to our newsletter
Get the latest blogs, whitepapers, eGuides, and more straight into your inbox.
Thank you!
Your video will begin shortly
SHARE
In this article
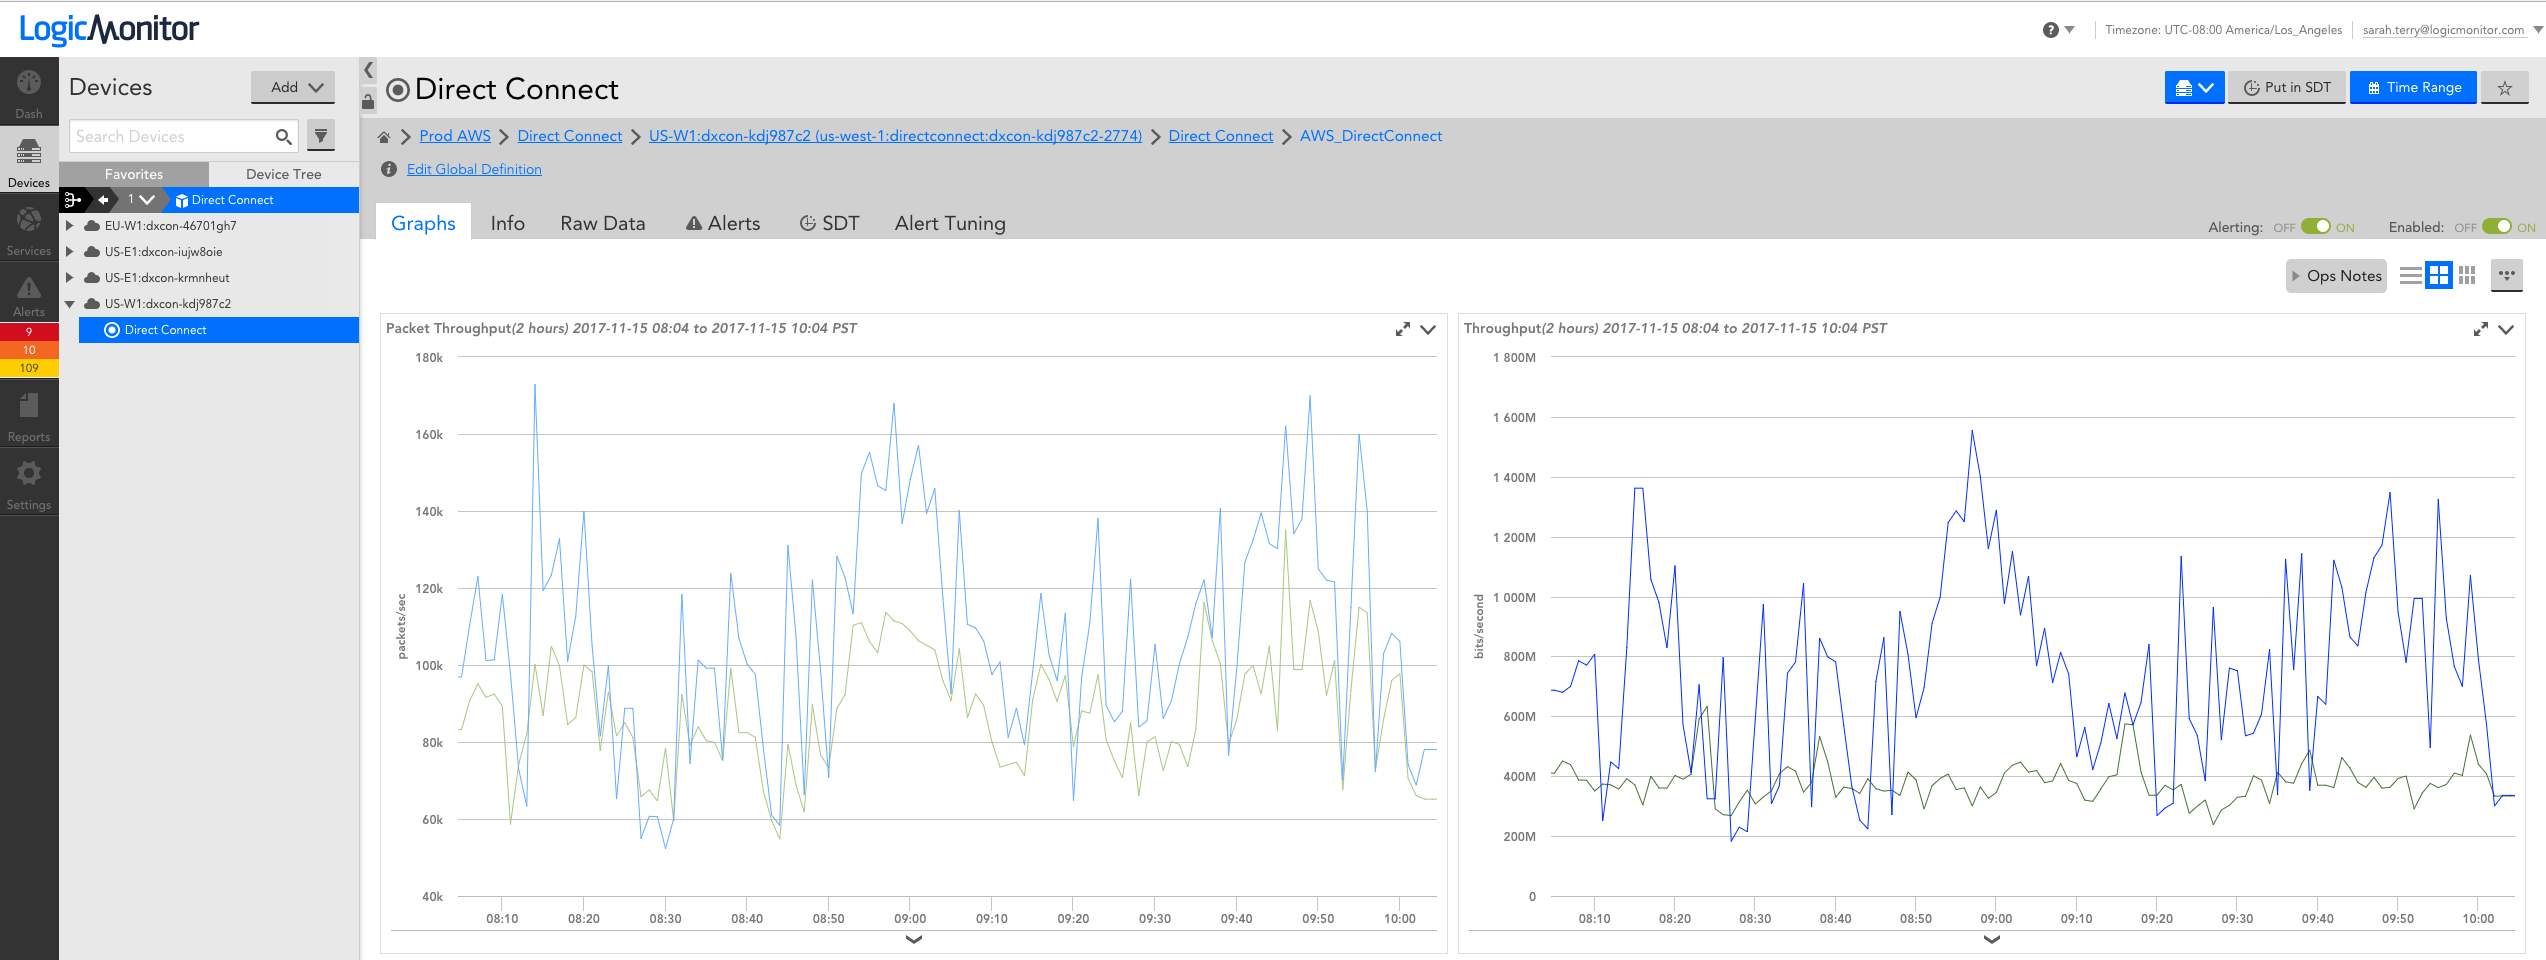
AWS Direct Connect provides a dedicated network connection between on-premisess and AWS environments. Such a connection can be more reliable and increase the uptime of your services because you’re unlikely to be impacted by an ISP’s availability issues, as is the case with traditional, internet-based connections. With our most recent release, Direct Connect connections can be automatically discovered and monitored in LogicMonitor.
Direct Connect throughput performance graphs in LogicMonitor.
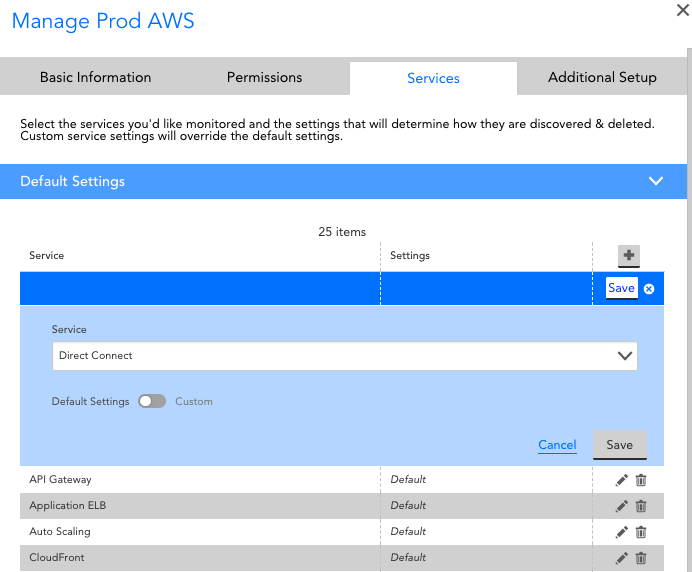
If you’re already using LogicMonitor for AWS monitoring, you just need to select Direct Connect for monitoring via the Manage dialog for your AWS group:
Current users select “Direct Connect” in Manage dialog to start monitoring.
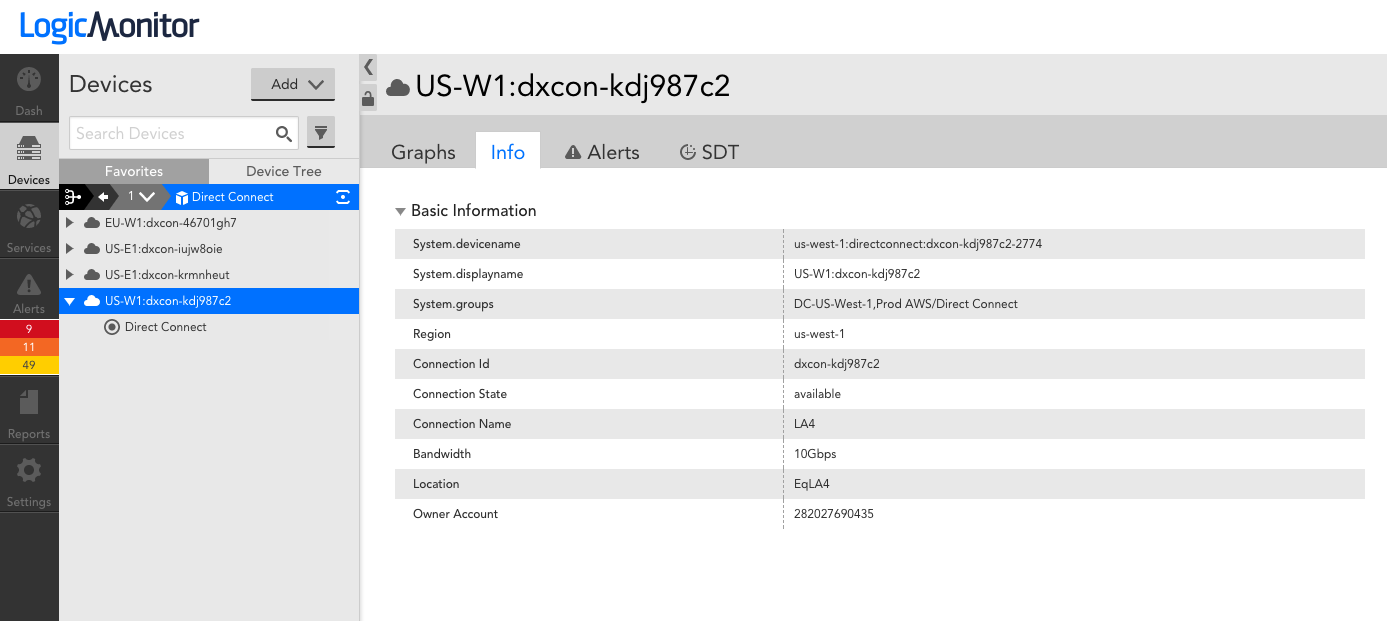
If you’re not yet monitoring your AWS environment, simply provide LogicMonitor with read only access to your AWS environment and Direct Connect will be pre-selected for monitoring, among the other AWS services LogicMonitor supports. From there, connections, metadata such as the bandwidth, id, name and state, as well as CloudWatch data will appear in LogicMonitor after a few minutes:
Connections, metadata and CloudWatch data displayed in LogicMonitor
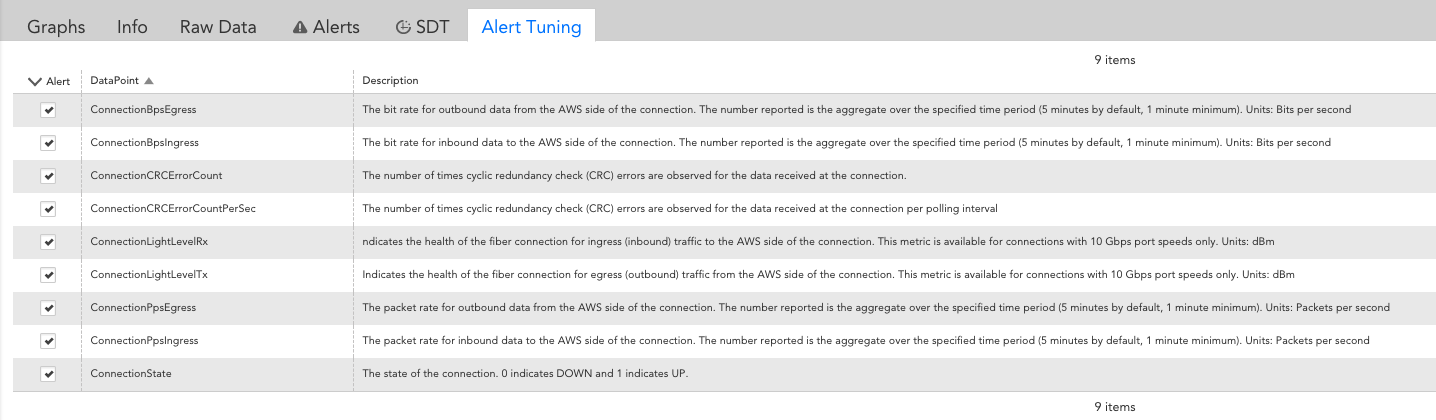
The following connection performance CloudWatch metrics are collected by a LogicMonitor maintained Collector, so there are no installations needed to start monitoring:
CloudWatch connection performance metrics automatically collected and displayed by LogicMonitor
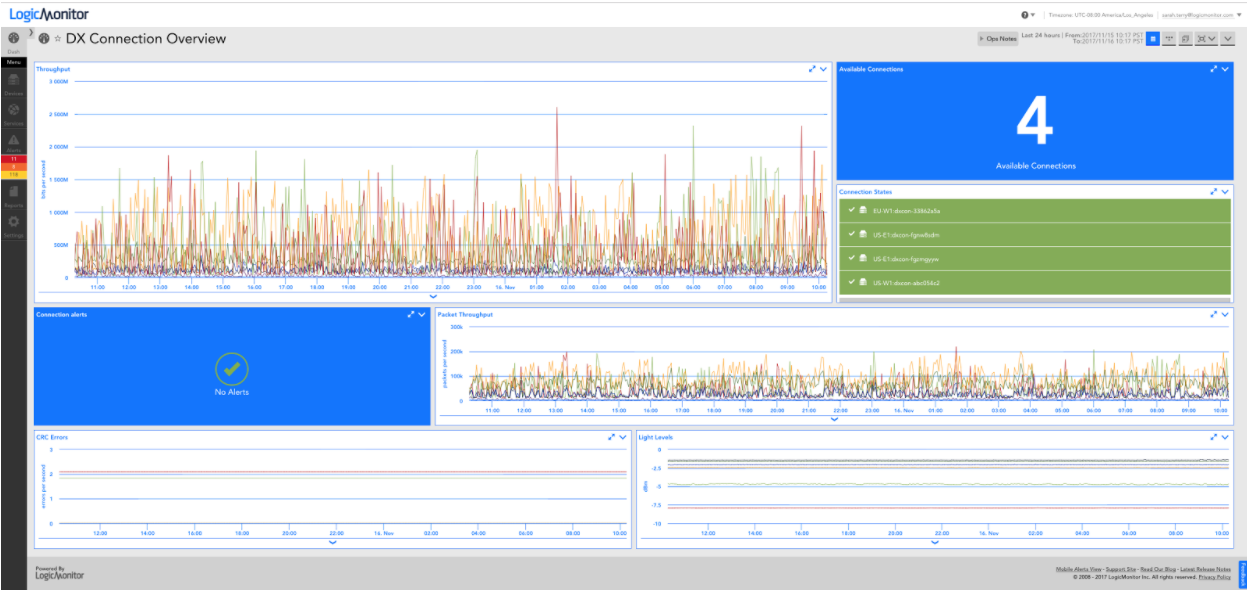
Our Monitoring Team sets alert thresholds on the above metrics and configures default graphs to be displayed, so you get actionable data out of the box. You can additionally configure meaningful dashboards specific to your environment and/or team. Here’s a dashboard we created to visualize the performance across our different connections:
LogicMonitor dashboard showing performance across multiple connections.