In this article


LogicMonitor is proud to announce anomaly visualization as an addition to our growing AIOps capabilities! With this new functionality, users are able to visualize anomalies that occur for a monitored resource and compare that anomaly to key historical signals, such as the past 24hrs, 7 days, or 30 days. Anomaly visualization complements LogicMonitor’s existing forecasting functionality and provides another layer of intelligence to better understand resource health. With the ability to quickly identify anomalies, LogicMonitor users will be able to troubleshoot faster and more effectively.
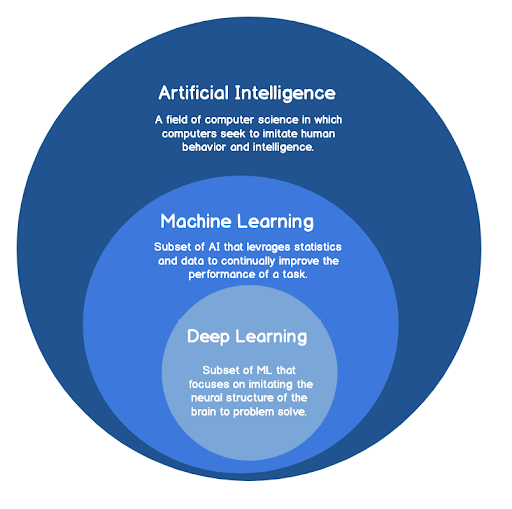
It is important to first understand where anomaly detection fits into artificial intelligence (AI) for IT Operations or AIOps. AI is often depicted as some abstract concept in which computers possess immense knowledge and a prerogative to harm human beings. While part of this depiction is true, it makes for a better Hollywood film (iRobot anyone?) than the reality in which AI operates. AI is a broad field of computer science that aims to mimic humanistic behaviors with machines. The relationships between artificial intelligence, machine learning, and deep learning can be seen in figure 1, where machine learning is a subset of AI, and deep learning is a subset of machine learning. AI, as it relates to IT operations, generally takes the form of machine learning. Features such as anomaly detection, alert clustering, and pattern analysis are all examples of machine learning. More generally, they are features, or tasks, where performance improves as the amount of data increases.
Anomaly detection identifies the deviations or abnormalities within a dataset. In IT this generally translates into the ability to understand anomalous spikes for a given metric (e.g. CPU utilization, network throughput, latency, etc.). By identifying anomalies that occur within the limits set by traditional static thresholds, teams can catch potentially critical events before they occur and prevent downtime. LogicMonitor’s site reliability engineering (SRE) team used anomaly detection to do just this! One day, a task queue had a dramatic drop in sent messages, which, if left unresolved, has the potential to impact the accessibility of certain features in the LogicMonitor application (which is not good!):
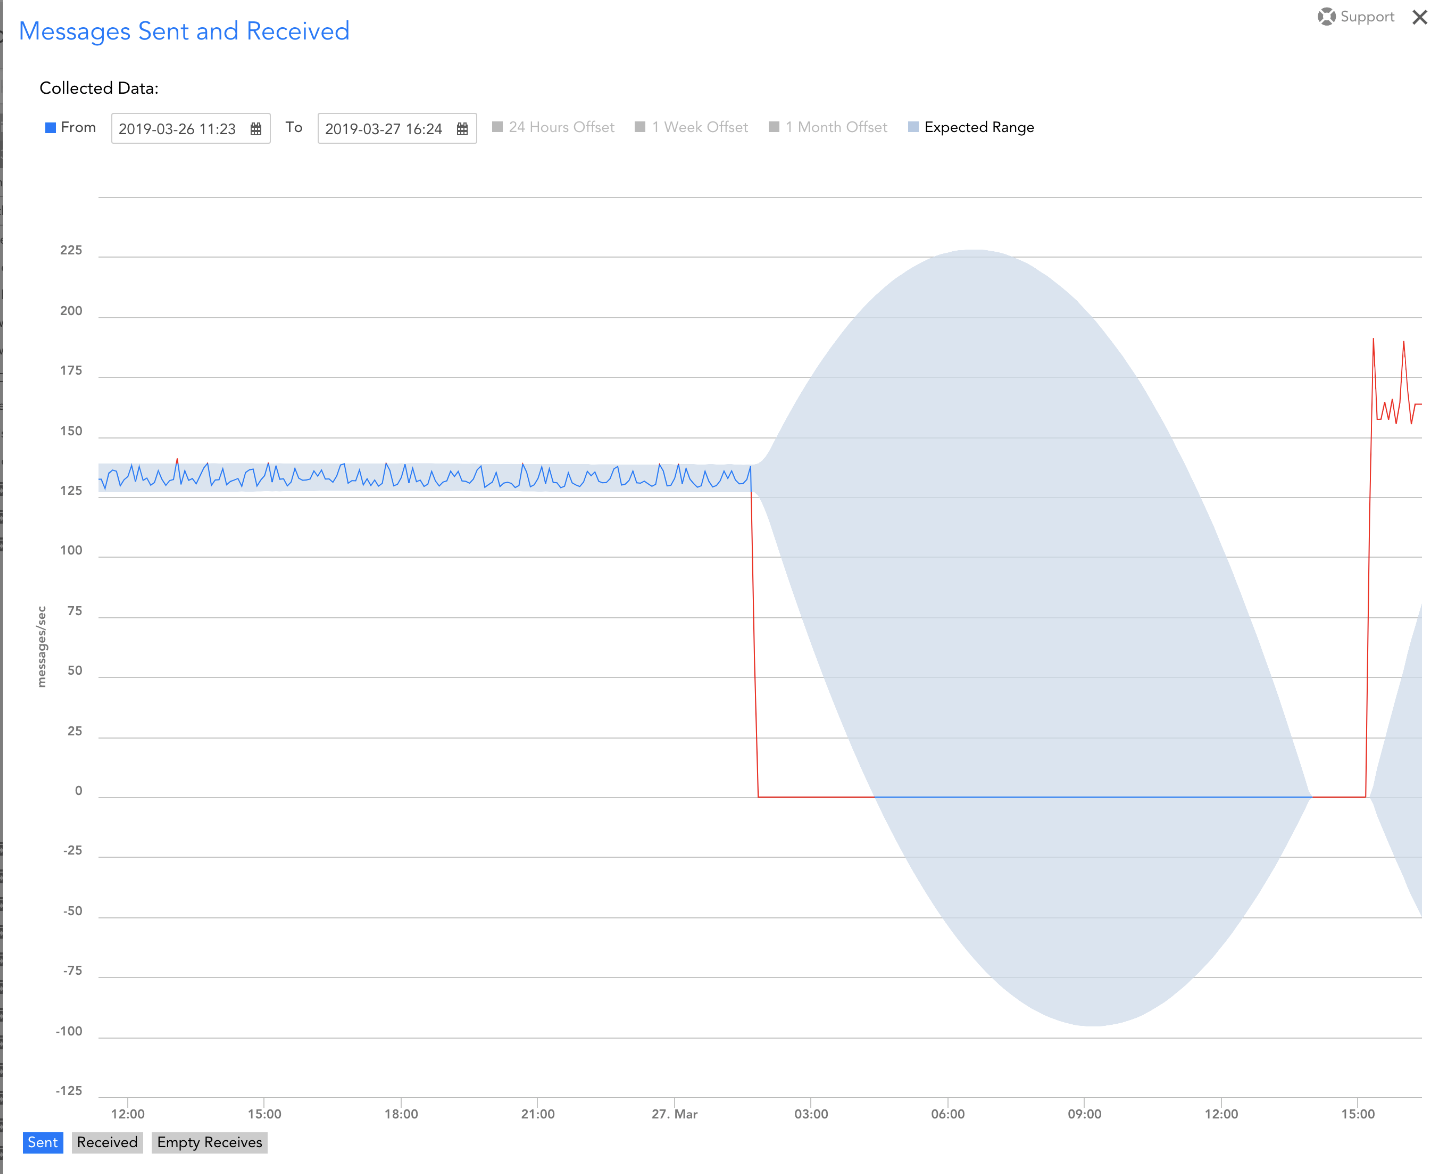
Because of an infrastructure change, the messages sent dramatically decreased from about 125 messages to zero. This dramatic decrease did not trigger an alert because it was not caught by standard alert thresholds (to catch this, we could have had an alert threshold set to catch when the sent messages are at zero, but that may not always be an alertable condition).
With LogicMonitor’s new anomaly detection functionality, the LogicMonitor SRE team was able to identify the drop and tag it with an OpsNote. The ability to visually identify this anomaly expedited their troubleshooting workflow and enabled them to maximize the LogicMonitor application uptime and availability.
Anomaly visualization provides another layer of intelligence that can help in troubleshooting scenarios. Understanding how a resource has performed over time allows users to understand the baseline health of a resource, which aids in capacity planning and determining long term seasonal trends. Both these tenants combine to enable our users to make more informed decisions when troubleshooting, which ultimately leads to less downtime for the end users and better adherence to service SLAs.
To access this feature in portal, please see this support guide for documentation on how to get started. If you would like to see it in action, please reach out to your customer success manager or a sales representative for more info.

Subscribe to our blog
Get articles like this delivered straight to your inbox