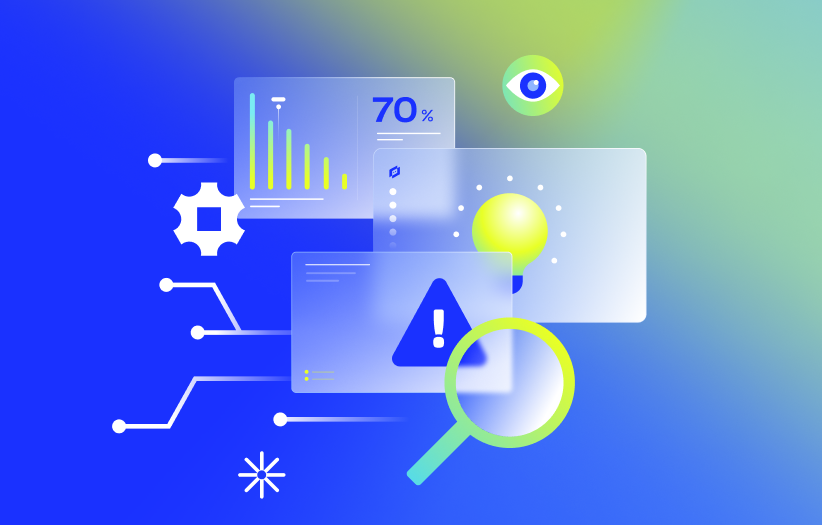
What is Observability (o11y)? And Why Ops Teams Need It Now
Turn 2 a.m. fire drills into fast fixes. Observability (correlating logs, metrics, traces, and events) cuts MTTR and reveals root cause for your team quickly.
Observability turns 2 A.M. mystery outages into fast, confident fixes
Monitoring asks “what broke?” while observability answers “why,” so you can debug unknown-unknowns fast
Correlate metrics, logs, traces, and events with OpenTelemetry to jump from a spike to root cause
Service-aware LM Envision + Edwin AI groups signals by change and impact, surfaces likely cause, and slashes MTTR and downtime
Recommendation: Start with your most paged services, turn on OpenTelemetry auto-instrumentation, ingest into LM Envision, then expand with SLOs, playbooks, and automation
It’s 2 a.m. Your phone buzzes with an alert. Latency just spiked across your entire production environment, and you’re staring at five different observability tools, each showing a different piece of the puzzle. Your metrics say CPU is fine. Logs show errors, but which ones matter? Nobody can tell you what caused this.
This is why observability matters.
We’ll cover what observability actually means, how it differs from monitoring, and why Ops teams are making the shift. You’ll know whether it’s right for your team and how to start.
What Observability Means
Observability (o11y for short, pronounced “Ollie“) is the ability to understand a system’s internal state by analyzing external data like logs, metrics, and traces. It helps IT teams monitor systems, diagnose issues, and ensure reliability. In modern tech environments, observability prevents downtime and optimizes user experiences. So, if your systems could talk, observability is how well you can hear and understand what it’s saying.
The term comes from control theory, which is an engineering discipline focused on controlling dynamic systems. In that context, a system is “observable” when you can determine its internal state from external measurements. This concept migrated to software in the 2010s as cloud-native applications grew too complex for traditional monitoring. Industry analysts now recognize observability as essential for managing modern distributed systems, with organizations reporting dramatic improvements in incident response times.
The more observable your system is, the easier it is to debug and understand what’s going on when something breaks.
Observability isn’t a tool you buy. It’s a property you build into your systems. You need to design your infrastructure to expose its internal state through telemetry data. Without proper instrumentation (both automatic and custom hooks that generate telemetry), you’ve got no visibility, no matter how fancy your observability platforms look.
Why does this matter for you? Observability democratizes expertise. When your systems are truly observable, you don’t need the one senior engineer who “just knows” everything to troubleshoot performance issues. Junior team members can investigate and solve problems they’ve never seen before.
How Observability Differs from Monitoring
“Observability” might sound like rebranded monitoring, but there’s a fundamental difference that changes how Ops teams work.
Monitoring asks: “Is something wrong?” It watches predefined metrics, waits for thresholds to be breached, and triggers alerts. You set up dashboards for known issues, wait for alerts, react, and escalate to the senior engineer.
Observability asks: “Why is it wrong?” It lets you explore system behavior in real time and investigate issues you never predicted. You explore the behavior as issues arise, ask questions in real time, and let any team member discover root causes.
Case in point: Monitoring tells you application performance is degraded at 2:14 p.m. Observability shows you the deployment at 2:14 p.m., the specific service affected, and the config change that triggered it.
This matters because cloud-native applications throw mostly “unknown unknowns” (the problems you didn’t see coming because you didn’t know they existed) at you. You can’t predict every failure mode in distributed systems with hundreds of microservices. Monitoring handles what you expected might break. Observability helps you debug what you never saw coming.
So when should you use monitoring vs. observability? If your environment is stable with predictable failure modes, monitoring might suffice. But if your systems change daily with new deploys, scaling events, and infrastructure shifts, you need observability.
Observability also changes what skills your team needs. You’re moving from configuring static dashboards to querying data as you go. This democratizes troubleshooting. You’re not waiting for the one person who “just knows” everything.
The Three Pillars of Observability
There are three pillars of observability: logs, metrics, and traces.
Logs are your system’s diary. They’re granular, timestamped records of what happened. When something breaks, logs are usually where you start. They tell the detailed story of what failed and why.
Metrics are your system’s pulse: numeric measurements over time, like CPU usage, latency, and error rates. They’re great for spotting trends and setting alerts.
Traces show the journey of a request through your system. In distributed systems, one user request might touch a dozen services. Traces follow that path, showing which service handled what and how long each step took. Each step is called a “span,” and together they reveal the complete picture of how requests flow through your architecture.
But having these three pillars of observability doesn’t guarantee full visibility if you’re working with them separately. The power comes from correlation. You need to link metrics, logs, and traces together to tell one cohesive story.
How Correlation Works in Practice
Modern observability platforms use context propagation to connect the dots. When a request enters your system, it gets a unique trace ID that follows it through every service. The same trace/context IDs flow through traces and logs; metrics typically link to traces via labels/exemplars so you can jump from a spike to a representative trace. This is where standards like OpenTelemetry shine. They provide vendor-neutral instrumentation that makes sure your telemetry data is consistently tagged and correlated, regardless of which observability platform you use.
Good correlation looks like this: You spot a metric anomaly (latency spike at 2:16 p.m.), use traces to follow the request path and see which service slowed down, then pivot to logs to find the error that caused it. Finally, you pin events on the timeline to see what triggered the issue.
That’s where LogicMonitor’s observability platform, LM Envision, stands out. We normalize and correlate events with your telemetry data (metrics, logs, and traces) so you see what changed, when it changed, and why it matters in one timeline. When you roll a config change at 2:14 p.m. and latency climbs at 2:16 p.m., we group these signals and pin the deployment right there. Our artificial intelligence engine, Edwin AI, highlights the change as the likely cause (e.g., a 2:14 p.m. config change) and recommends next steps; rollbacks execute via your deployment tool/integration. You fix it in minutes.
Common Pitfalls and How to Avoid Them
Even with the right approach, teams run into predictable obstacles. Here’s what to watch out for:
Data silos across teams. Different teams use different tools that don’t talk to each other. Fix: Standardize on a unified platform.
Telemetry overload. Too much data overwhelms teams. Fix: Use machine learning to filter noise and surface only meaningful anomalies.
Manual instrumentation drain. Engineers spend more time setting up than using observability. Fix: Start with automatic instrumentation, and add custom instrumentation only where it matters.
Alert fatigue. Too many alerts desensitize teams. Fix: Consolidate related alerts, tune thresholds based on real incidents, and suppress expected noise during maintenance.
Missing pre-production observability. Teams only instrument production. Fix: Instrument all environments the same way to catch issues before they reach customers.
Why Ops Teams Adopt Observability
You find and fix issues faster. Real-time visibility means you shift from identifying an issue to pinpointing root cause in minutes instead of hours. Lower MTTR, less downtime, fewer angry end-users.
Real scenario: A fintech company migrating to cloud saw intermittent API timeouts that traditional monitoring couldn’t explain. With observability, they traced the issue to a misconfigured load balancer rule that only triggered under specific traffic patterns. Fixed in 20 minutes instead of days.
You see across your whole stack. Modern architectures are mazes of microservices, containers, and clouds. Observability platforms give you a holistic view with no blind spots.
Real scenario: During a Black Friday surge, an e-commerce team used distributed tracing to spot a single slow database query cascading through 12 microservices. They optimized the query and prevented a site-wide outage that would’ve cost millions.
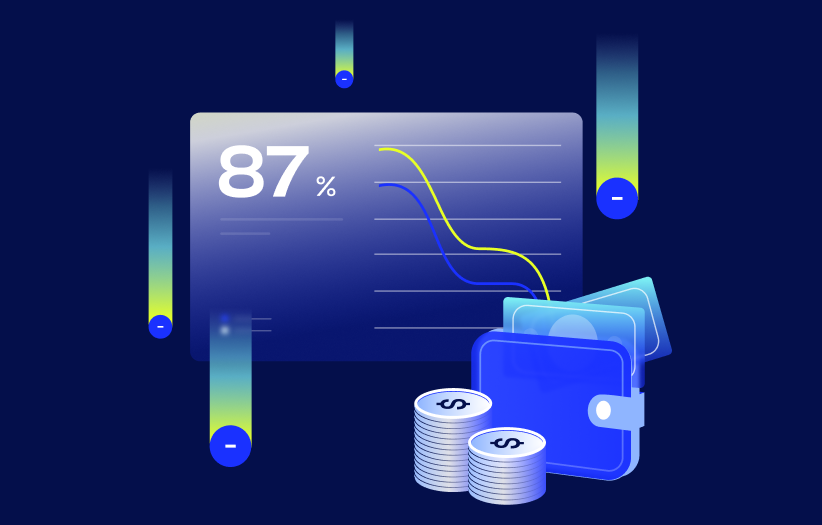
Your business notices the difference. Less downtime and faster fixes keep customers happy. Optimize application performance based on real data to drive conversions and revenue. When you can prove you prevented a $50K outage, you’re speaking the language business leaders understand.
DevOps and SRE teams ship faster with confidence. Observability provides the feedback loop DevOps needs to validate changes immediately after deployment. SRE teams can track service level indicator (SLI) metrics aligned to your service level objectives (SLOs) in real time., ensuring reliability targets are met without manual toil.
Real scenario: A SaaS company implemented observability-driven SLOs that automatically alert when user-facing latency exceeds thresholds. Their DevOps team now deploys 5x per day with confidence, knowing they’ll catch regressions immediately.
Security-focused teams can spot operational anomalies that may indicate risk. With full visibility into system behavior, teams can spot anomalies that indicate security issues—unusual API calls, unexpected data access patterns, or suspicious resource consumption—before they become breaches.
Your team collaborates instead of fighting. Observability provides a single view for Dev, Ops, and SRE. It stops the “works on my machine” debates and creates data-driven post-incident reviews. Less time in war rooms means better work-life balance and reduced burnout.
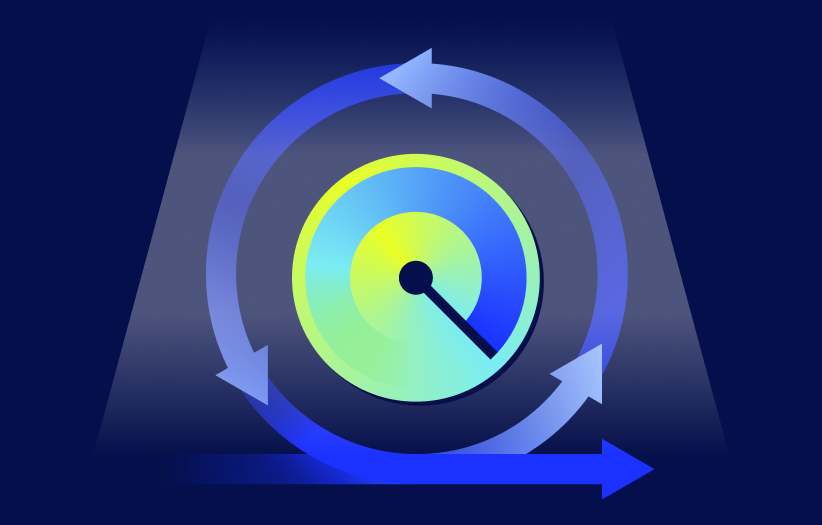
You move from reactive to proactive. Stop firefighting and start preventing fires. Spot performance issues before they impact end-users or violate SLAs.
You free up time for real work. Automate routine diagnostics so your team focuses on software development and innovation instead of endless troubleshooting.
The Challenges of Observability
Beyond the common pitfalls, deeper organizational challenges persist: skill shortages, resistance to change, and silos between Dev and Ops teams. The fix isn’t just technical. Leaders must foster shared responsibility, invest in training, and break down silos through shared on-call rotations and unified dashboards.
Also, burnout is real. Alert fatigue and too much data without context lead to cognitive overload. Implement alert suppression, consolidate alerts, and use machine learning to filter noise. Track pages per week and overtime hours.
Let’s not forget that tool proliferation has hidden costs. You’re paying for multiple observability tools while engineers spend hours correlating data manually. Do the math on the total cost of ownership, not just licensing fees.
How to Actually Get Started
Ready to implement observability? Here’s a practical roadmap that won’t make you boil the ocean.
Start small and focused. Pick your most critical services, like the ones that page you at night. Instrument those first. Validate what you learn, then expand on it. Don’t try to instrument everything at once.
Understand your instrumentation options.
Automatic instrumentation: Agents or SDKs that capture telemetry data without code changes. Great for getting started quickly.
Custom instrumentation: Code you add to capture business-specific metrics. Necessary for unique workflows or domain-specific insights.
Pro tip: Most teams start with automatic instrumentation for baseline visibility, then add custom instrumentation for critical business logic.
Follow a phased approach:
Phase 1: Get basic metrics and logs for critical services
Phase 2: Add distributed tracing and start correlating telemetry data
Phase 3: Integrate events and topology mapping
Phase 4: Enable machine learning-driven insights and automation
Pro tip: Set success metrics at each phase so you can prove value before expanding. That makes it easier to get buy-in for the next phase.
Face integration realities head-on. Your observability platform needs to work with your existing stack, including legacy systems you can’t retire yet. Expect to handle API rate limits, data format mismatches, and authentication complexities. These integration challenges are universal, regardless of which platform you choose.
Embrace OpenTelemetry for vendor neutrality. OpenTelemetry provides vendor-neutral APIs, SDKs, and instrumentation for generating and managing telemetry data. It’s backed by the Cloud Native Computing Foundation (CNCF) and supported by major vendors. You can avoid vendor lock-in, standardize instrumentation across teams, and easily switch observability platforms if needed. But there are trade-offs: managing OpenTelemetry yourself means handling more operational overhead.
Pro tip: That’s why LogicMonitor offers documented OTel Collector configs and OTLP ingestion endpoints (HTTP and gRPC) to simplify rollout. Use our vetted examples for common scenarios—Kubernetes, VMs, and cloud services—and manage the Collector with your existing tooling (Helm, Terraform, Ansible). You keep the flexibility of OpenTelemetry while LM Envision delivers the correlation, context, and dashboards.
Get specific about containers and microservices. Ephemeral containers that live for seconds need different approaches. You need automatic service discovery, trace context propagation across services, and persistent log storage.
Pro tip: Watch out for gotchas like container restarts losing data, sidecar injection adding latency, and tracing adding overhead.
7. Build toward maturity over time. Level 1 is reactive (basic logging and metrics, manual correlation). Level 2 is proactive (integrated telemetry, distributed tracing). Level 3 is predictive (machine learning-driven insights, anomaly detection). Level 4 is autonomous (full-stack observability, self-healing).
Pro tip: You don’t need Level 4 everywhere, so prioritize based on business criticality.
Making It Scale Without Breaking Your Team
Once you’ve got observability running, you need to scale it without overburdening your already-stretched team.
Invest in topology mapping
Auto-discovery and cloud/service graphs build the map; trace relationships enrich service dependencies so you can see cascading impacts in near real time. When a service degrades or goes down, the dependency map highlights downstream services (B, C, and D) so you’re not guessing about blast radius.
Build operational playbooks
After each incident, review the timeline with all stakeholders within 48 hours. Use observability data to reconstruct exactly what happened. Identify 2-3 actionable improvements, document them, and update runbooks. Do weekly automated health checks, monthly reviews of alert thresholds and false positive rates, and quarterly assessments of coverage gaps. That’s how you turn observability from a tool into an operational practice.
Create a single source of truth
Set up shared dashboards accessible to Dev, Ops, SRE, and Business stakeholders. Implement shared tagging conventions that everyone follows. Set up cross-team notifications when incidents occur. When teams stop saying “let me check my tool” and start working from the same data, troubleshooting accelerates dramatically.
Protect your team from burnout
Automate routine diagnostics so not every blip generates a page. Route alerts based on business impact: page for revenue-impacting issues, create tickets for everything else. Use maintenance windows to suppress expected alerts. Tune thresholds based on actual incident data with dynamic thresholds. Group related alerts into single incidents. And respect on-call time by making sure incidents that wake people up are genuinely urgent. Track burnout indicators and act on them.
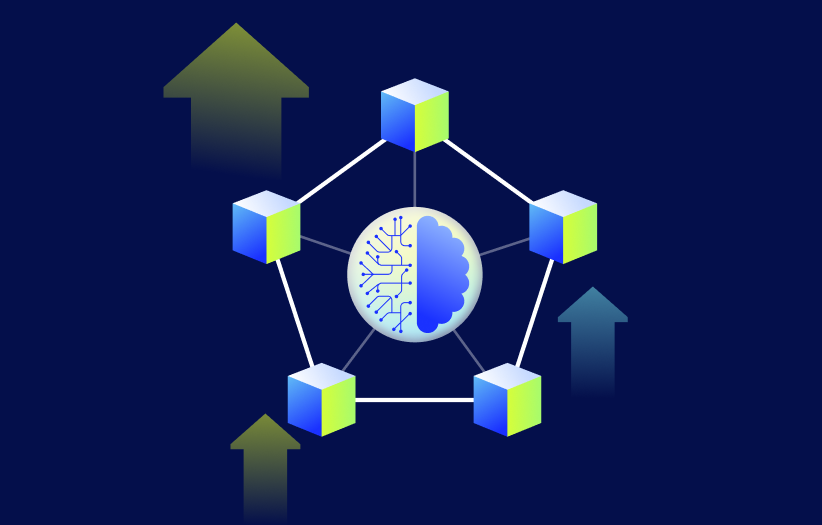
Advanced Observability: AI, Automation, and What’s Next
Once your observability foundation is solid, machine learning and automation can take you to the next level.
AI-powered anomaly detection
AI-powered anomaly detection goes beyond simple thresholds. Instead of manually setting alert thresholds for every metric, machine learning models learn normal behavior patterns and automatically flag deviations. This catches issues you wouldn’t have thought to monitor, like subtle performance degradation across services or unusual request patterns that signal attacks.
Predictive analytics
Predictive analytics prevent problems before they happen. Machine learning analyzes historical telemetry data to forecast capacity needs (“Database will reach capacity in 18 days”), predict deployment risk based on similar past changes, and identify patterns that precede outages. You stop asking “what broke?” and start asking “what’s about to break?”
Automated root cause analysis
Automated root cause analysis saves hours. Modern observability platforms use AI to automatically correlate metrics, traces, and logs, building fault trees that point directly to the root cause. Instead of manually digging through data, you get a ranked list of probable causes with supporting evidence. Some platforms even use causal AI to understand relationships between system components and predict cascading failures.
Self-healing infrastructure
Self-healing infrastructure reduces toil. When observability detects known issues, it can trigger automated remediation: scaling resources, restarting services, rolling back deployments, or quarantining problematic containers.
The key is integration with tools your team already uses. When observability detects an issue, it can automatically create a ServiceNow ticket with full context, update Jira backlog items with incident data, or send real-time Slack notifications.
The workflow: Observability platform detects issue → creates ticket → notifies team → triggers automation → updates necessary systems.
You can also build custom automation tailored to your needs. One team auto-rolls back deployments when error rates spike. Another quarantines suspicious containers based on security signals. Start with manual runbooks, document common fixes, script them, then trigger automatically. That’s the maturity progression from reactive to autonomous operations.
Why Service-Aware Observability Matters
Here’s where LogicMonitor’s perspective differs from the pack. Traditional observability focuses on technical visibility. Can you see what’s happening in your systems? We think that’s only half the picture.
Service-aware observability connects your technical telemetry directly to business services and outcomes. Instead of just knowing that a server is down, you know which customer-facing services are affected and what the business impact is. You prioritize based on what matters to users and the business, not just which alert fired first.
We automatically map technical signals to service health and business impact. When something breaks, you immediately see which business services are affected, who’s impacted, and the revenue risk. That context changes everything about how you respond and how you communicate with stakeholders.
This is the next evolution of observability, and it’s where smart Ops teams are headed.
Where to Go from Here
Observability isn’t just another trend. It’s a fundamental shift in how Ops manages modern systems. When done right, it moves you from reactive firefighting to proactive, strategic operations. It reduces burnout, accelerates incident response, and drives real business value.
The business case is clear: organizations with mature observability practices report 80% reductions in MTTR, improved SLA compliance, and measurably better customer satisfaction scores. More importantly, your team spends less time on repetitive troubleshooting and more time on strategic initiatives that move the business forward.
See LM Envision turn outages into answers fast.
See a walkthrough that correlates metrics, logs, traces, and events to pinpoint root cause and impact.
Sofia leads content strategy and production at the intersection of complex tech and real people. With 10+ years of experience across observability, AI, digital operations, and intelligent infrastructure, she's all about turning dense topics into content that's clear, useful, and actually fun to read. She's proudly known as AI's hype woman with a healthy dose of skepticism and a sharp eye for what's real, what's useful, and what's just noise.
Disclaimer: The views expressed on this blog are those of the author and do not necessarily reflect the views of LogicMonitor or its affiliates.