Linux Monitoring Support
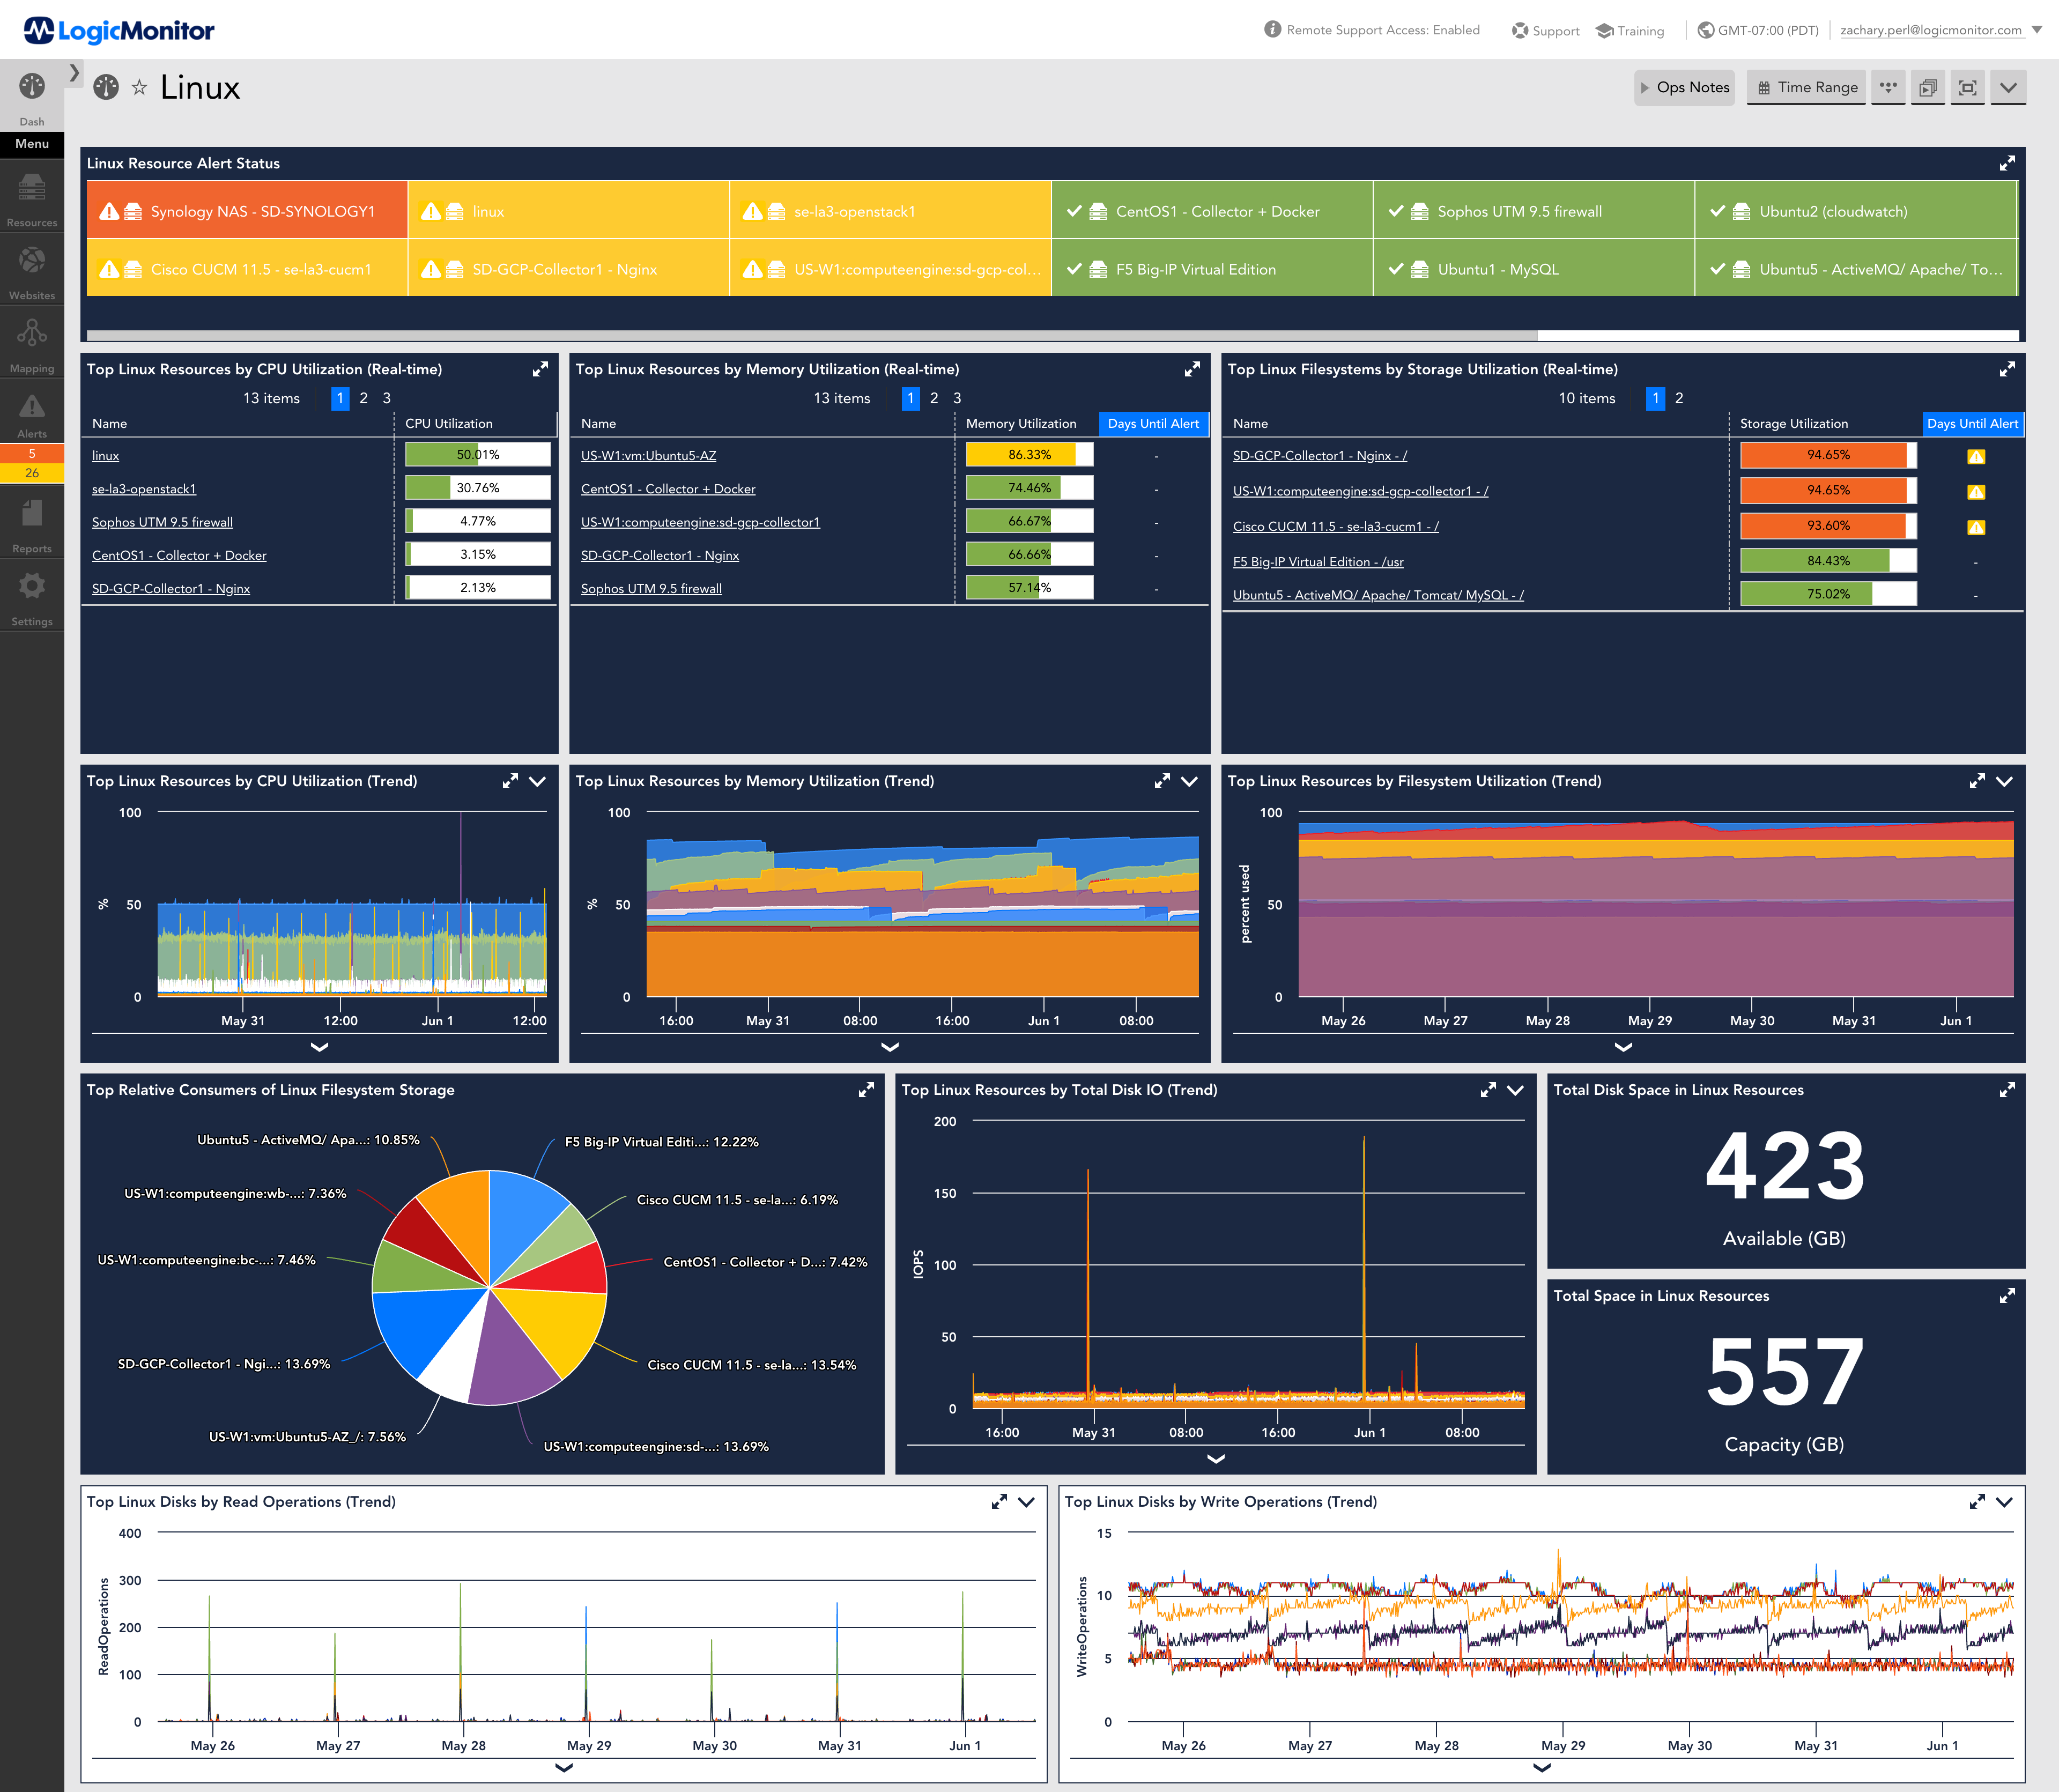
LogicMonitor includes support for monitoring technologies for Linux. We include LogicModules out-of-the-box that monitor critical Linux performance metrics to build out dashboards that show the data critical to your IT Operations. Deliver uptime that gives you downtime with LogicMonitor’s AI-powered hybrid observability and monitoring platform.