Container Monitoring
Scalable, dynamic monitoring for ephemeral containerized resources alongside your hybrid cloud infrastructure. Get visibility into your Kubernetes and Docker applications in a single monitoring platform that scales with you. LogicMonitor keeps up with your container resource changes automatically so you can focus on innovation.
Rapidly deploy dynamic container monitoring
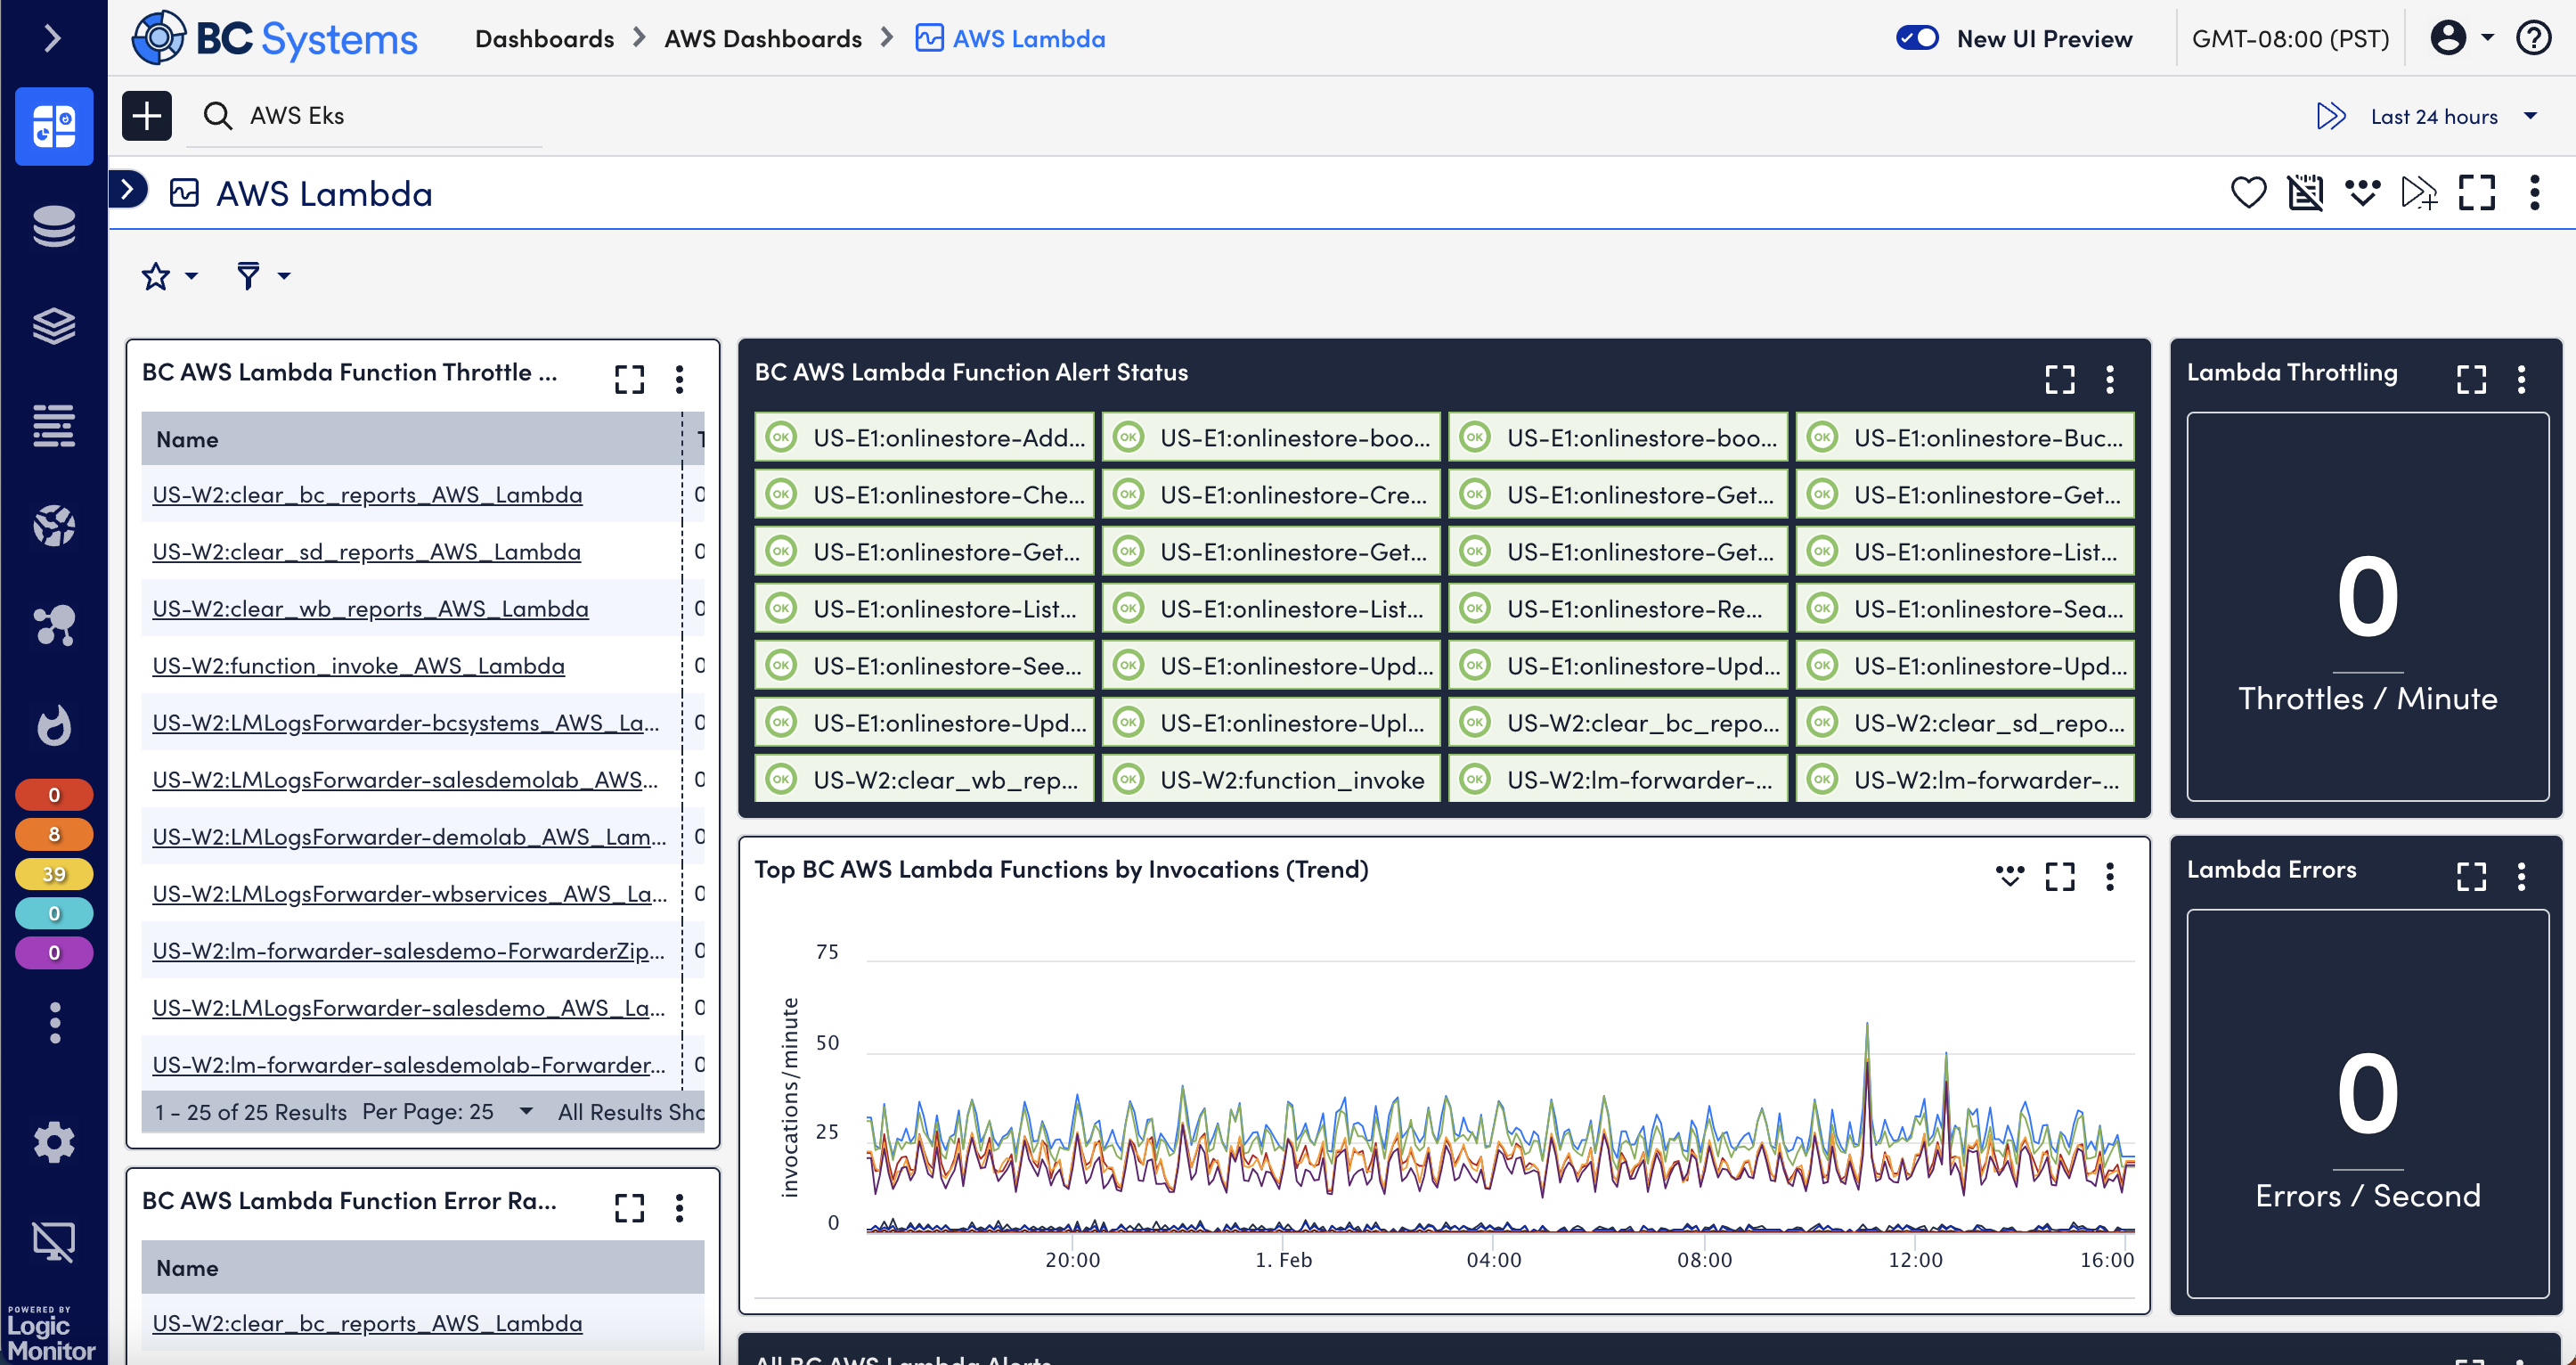
LogicMonitor automatically discovers containers, microservices, and underlying resources. Identify and solve issues quickly and precisely as Kubernetes container loads scale up and down. LogicMonitor’s container monitoring provides insight into application performance and health, understands when containers disappear, and retains performance data about the nature of the container.

Kubernetes
Docker

Amazon ECS
Hybrid monitoring to correlate containers with on-premise infrastructure
As businesses modernize and refactor workloads in the cloud, containers become valuable to scaling applications.
- LogicMonitor presents container insights alongside your organization’s existing monitored hybrid infrastructure in a single unified monitoring platform for visibility across operations teams.
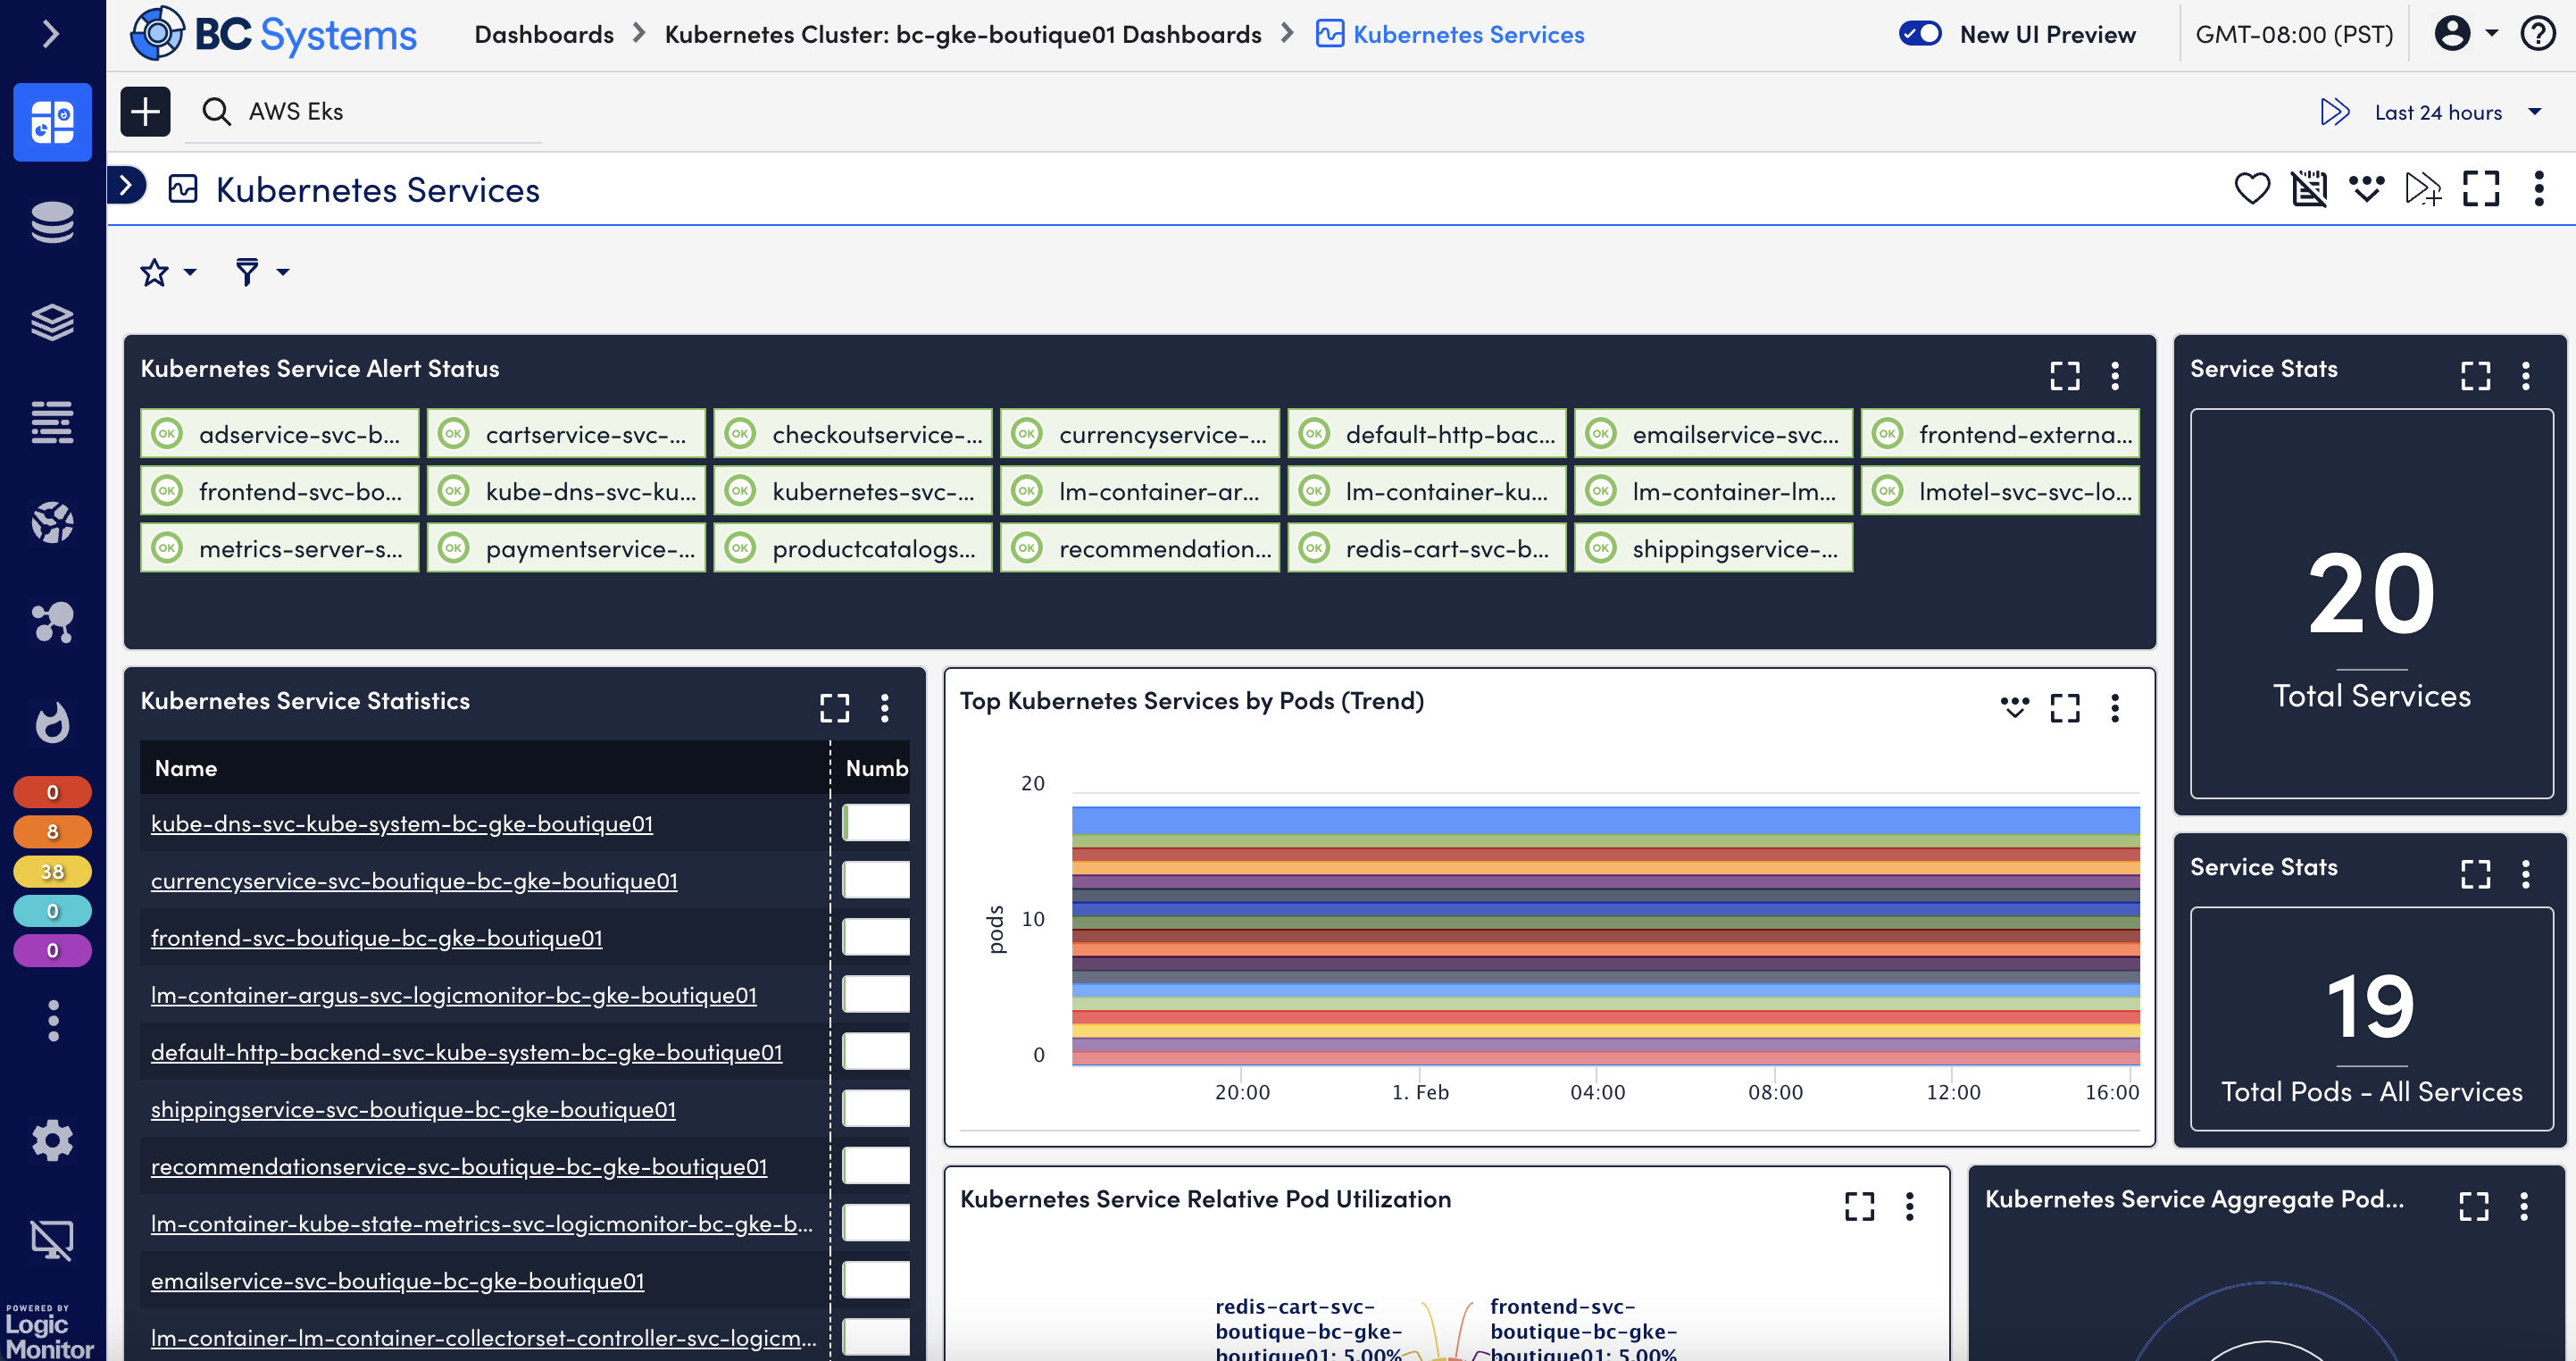
- Gain insights at the service level over containers to monitor, visualize, and alert on aggregate service level data for holistic business information.
Keep your containerized applications healthy
Organizations need insights into the performance of applications that are running in containers, as well as the health of the underlying container resources and orchestration components.
- LogicMonitor presents insights alongside your organization’s existing monitored hybrid infrastructure in a single, unified monitoring platform.
- Focus on the health and performance of the overall service, regardless of changes in underlying resource at both the cluster and application levels
- LogicMonitor retains data about the performance of the service or application that runs in the container for historical knowledge about container health.
Monitor and track dynamic services and ephemeral resources
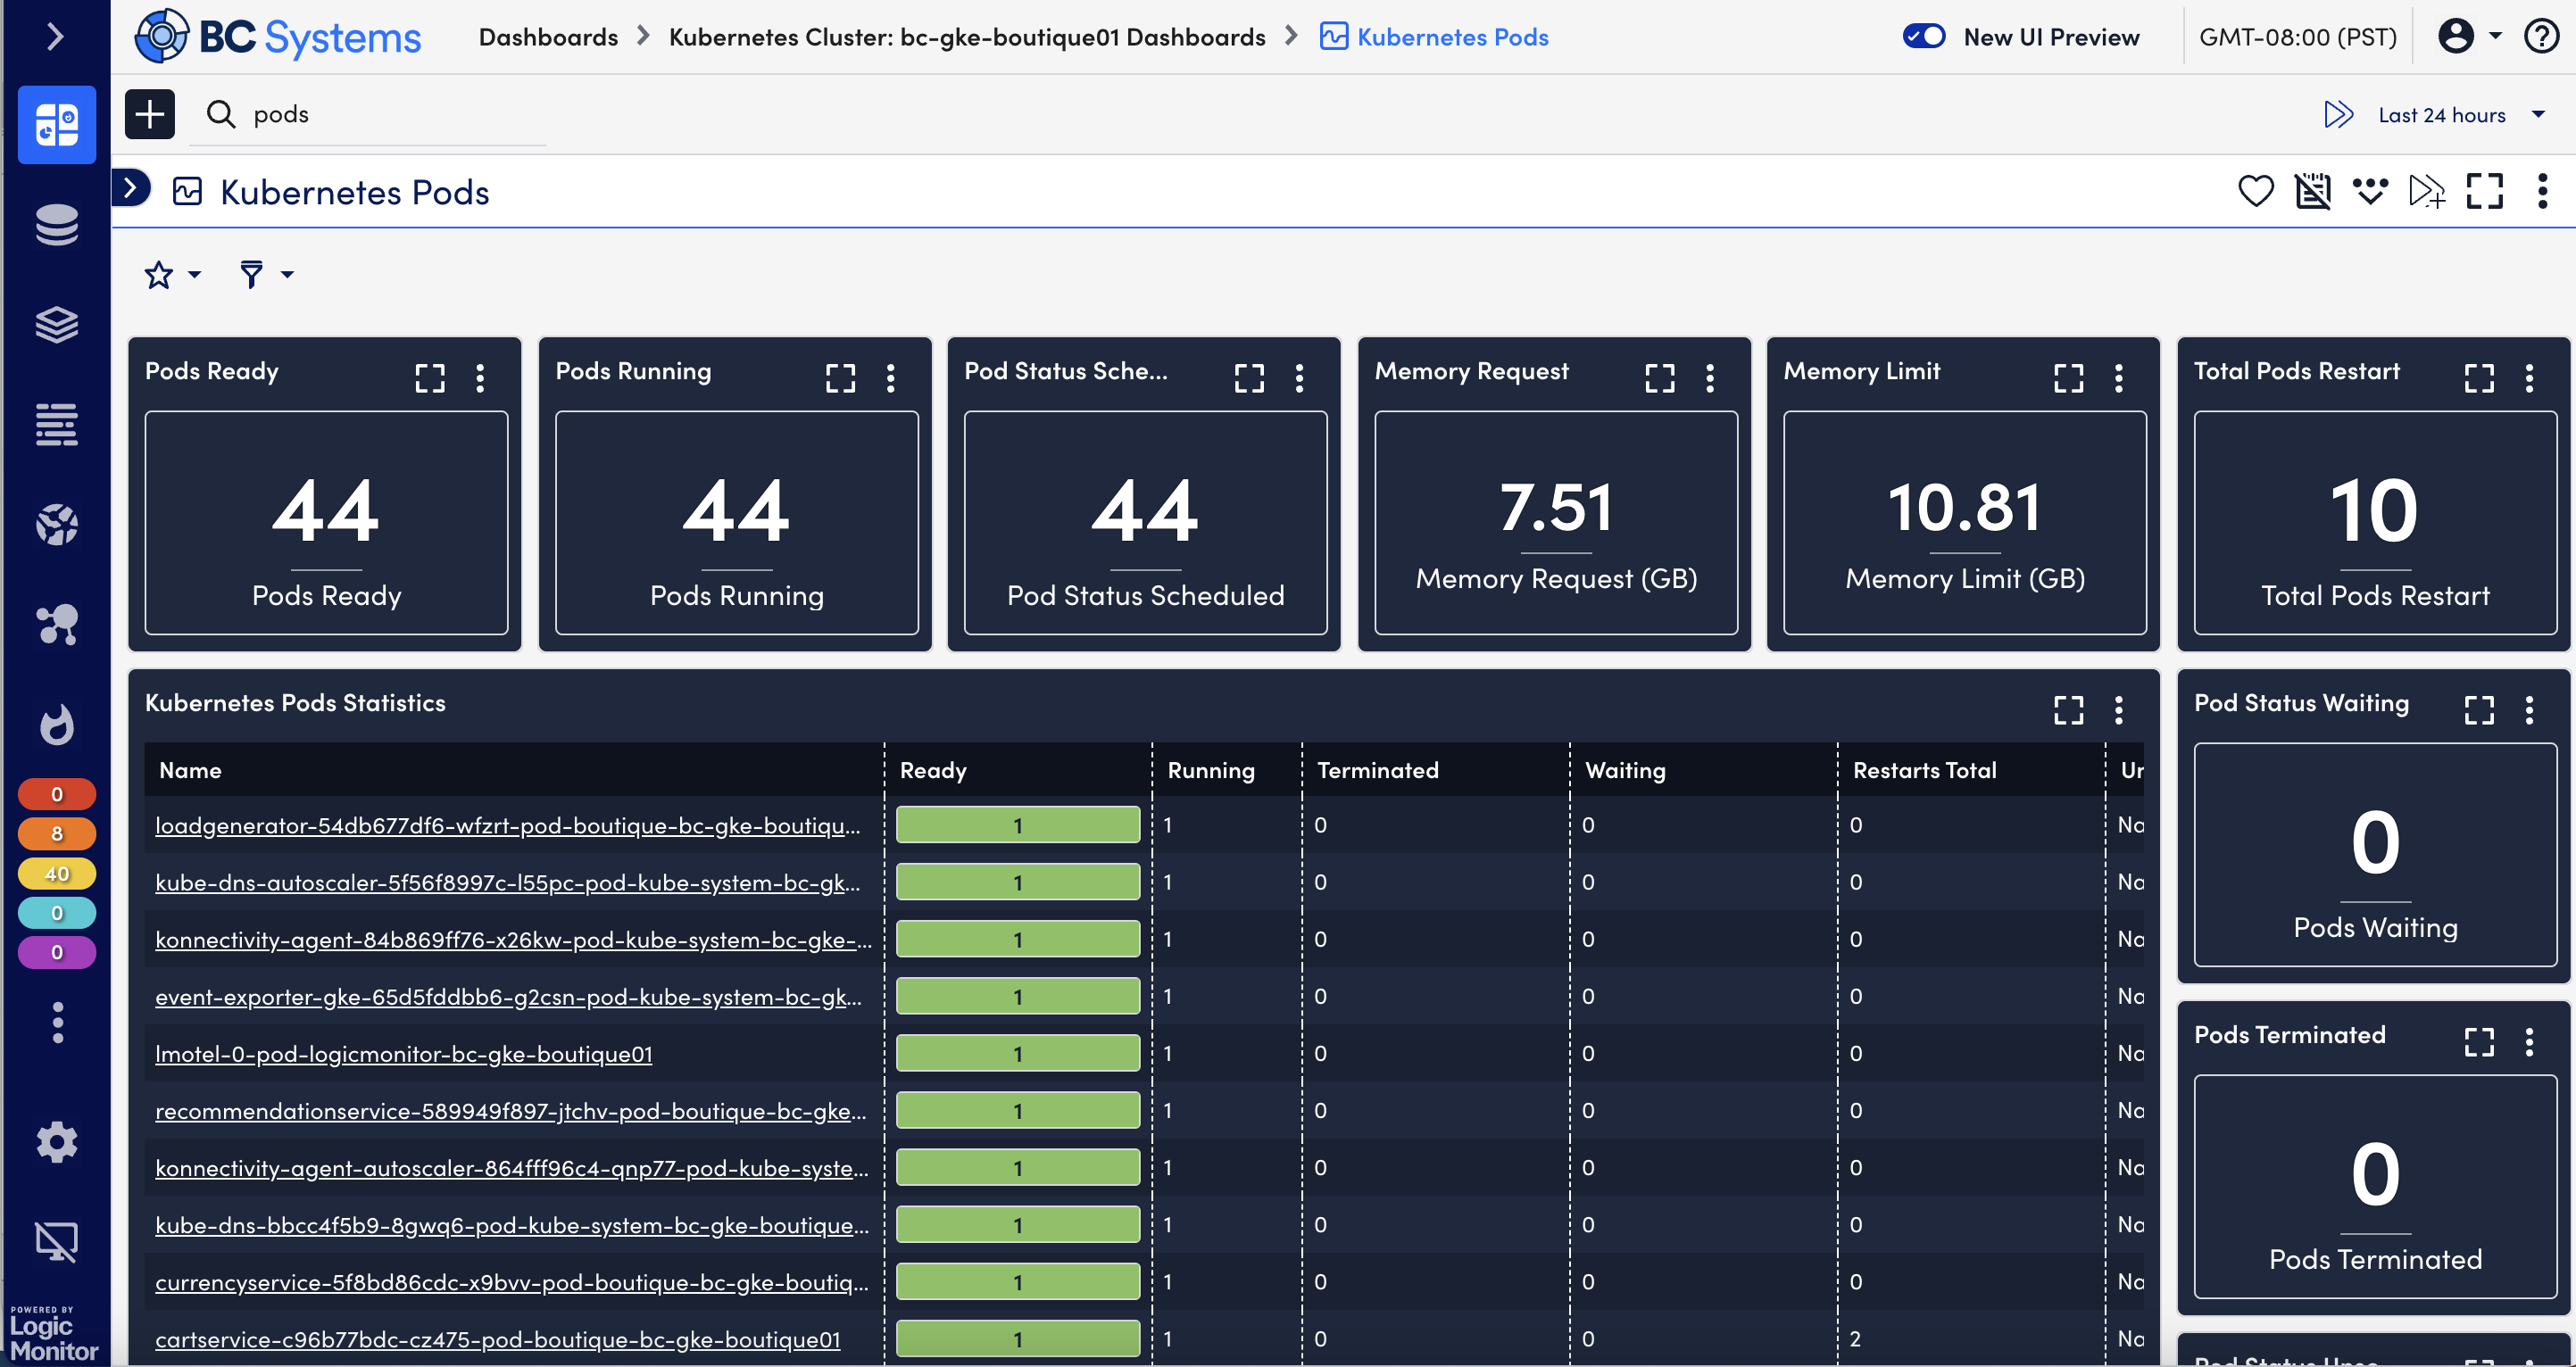
Containers and pods are ephemeral resources. It’s difficult to monitor components that may appear (and disappear) quickly and unpredictably. To accurately track ephemeral resources, LogicMonitor employs event-based discovery.
- Cluster resources are automatically added and removed from monitoring based on Kubernetes events or changes in microservices.
- Dynamically group together containers and other ephemeral resources supporting common microservices.
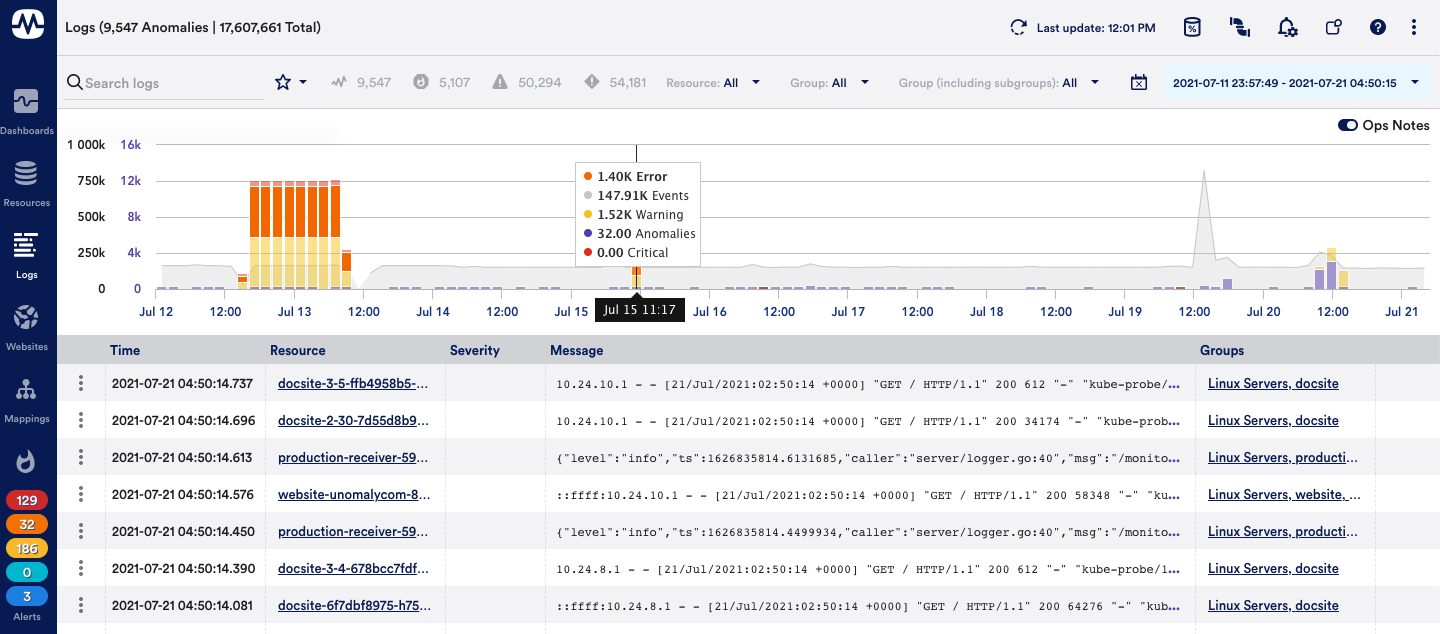
Event-based Kubernetes monitoring: a new level of clarity
Event-based Kubernetes monitoring eliminates the most common challenges of monitoring ephemeral resources by:
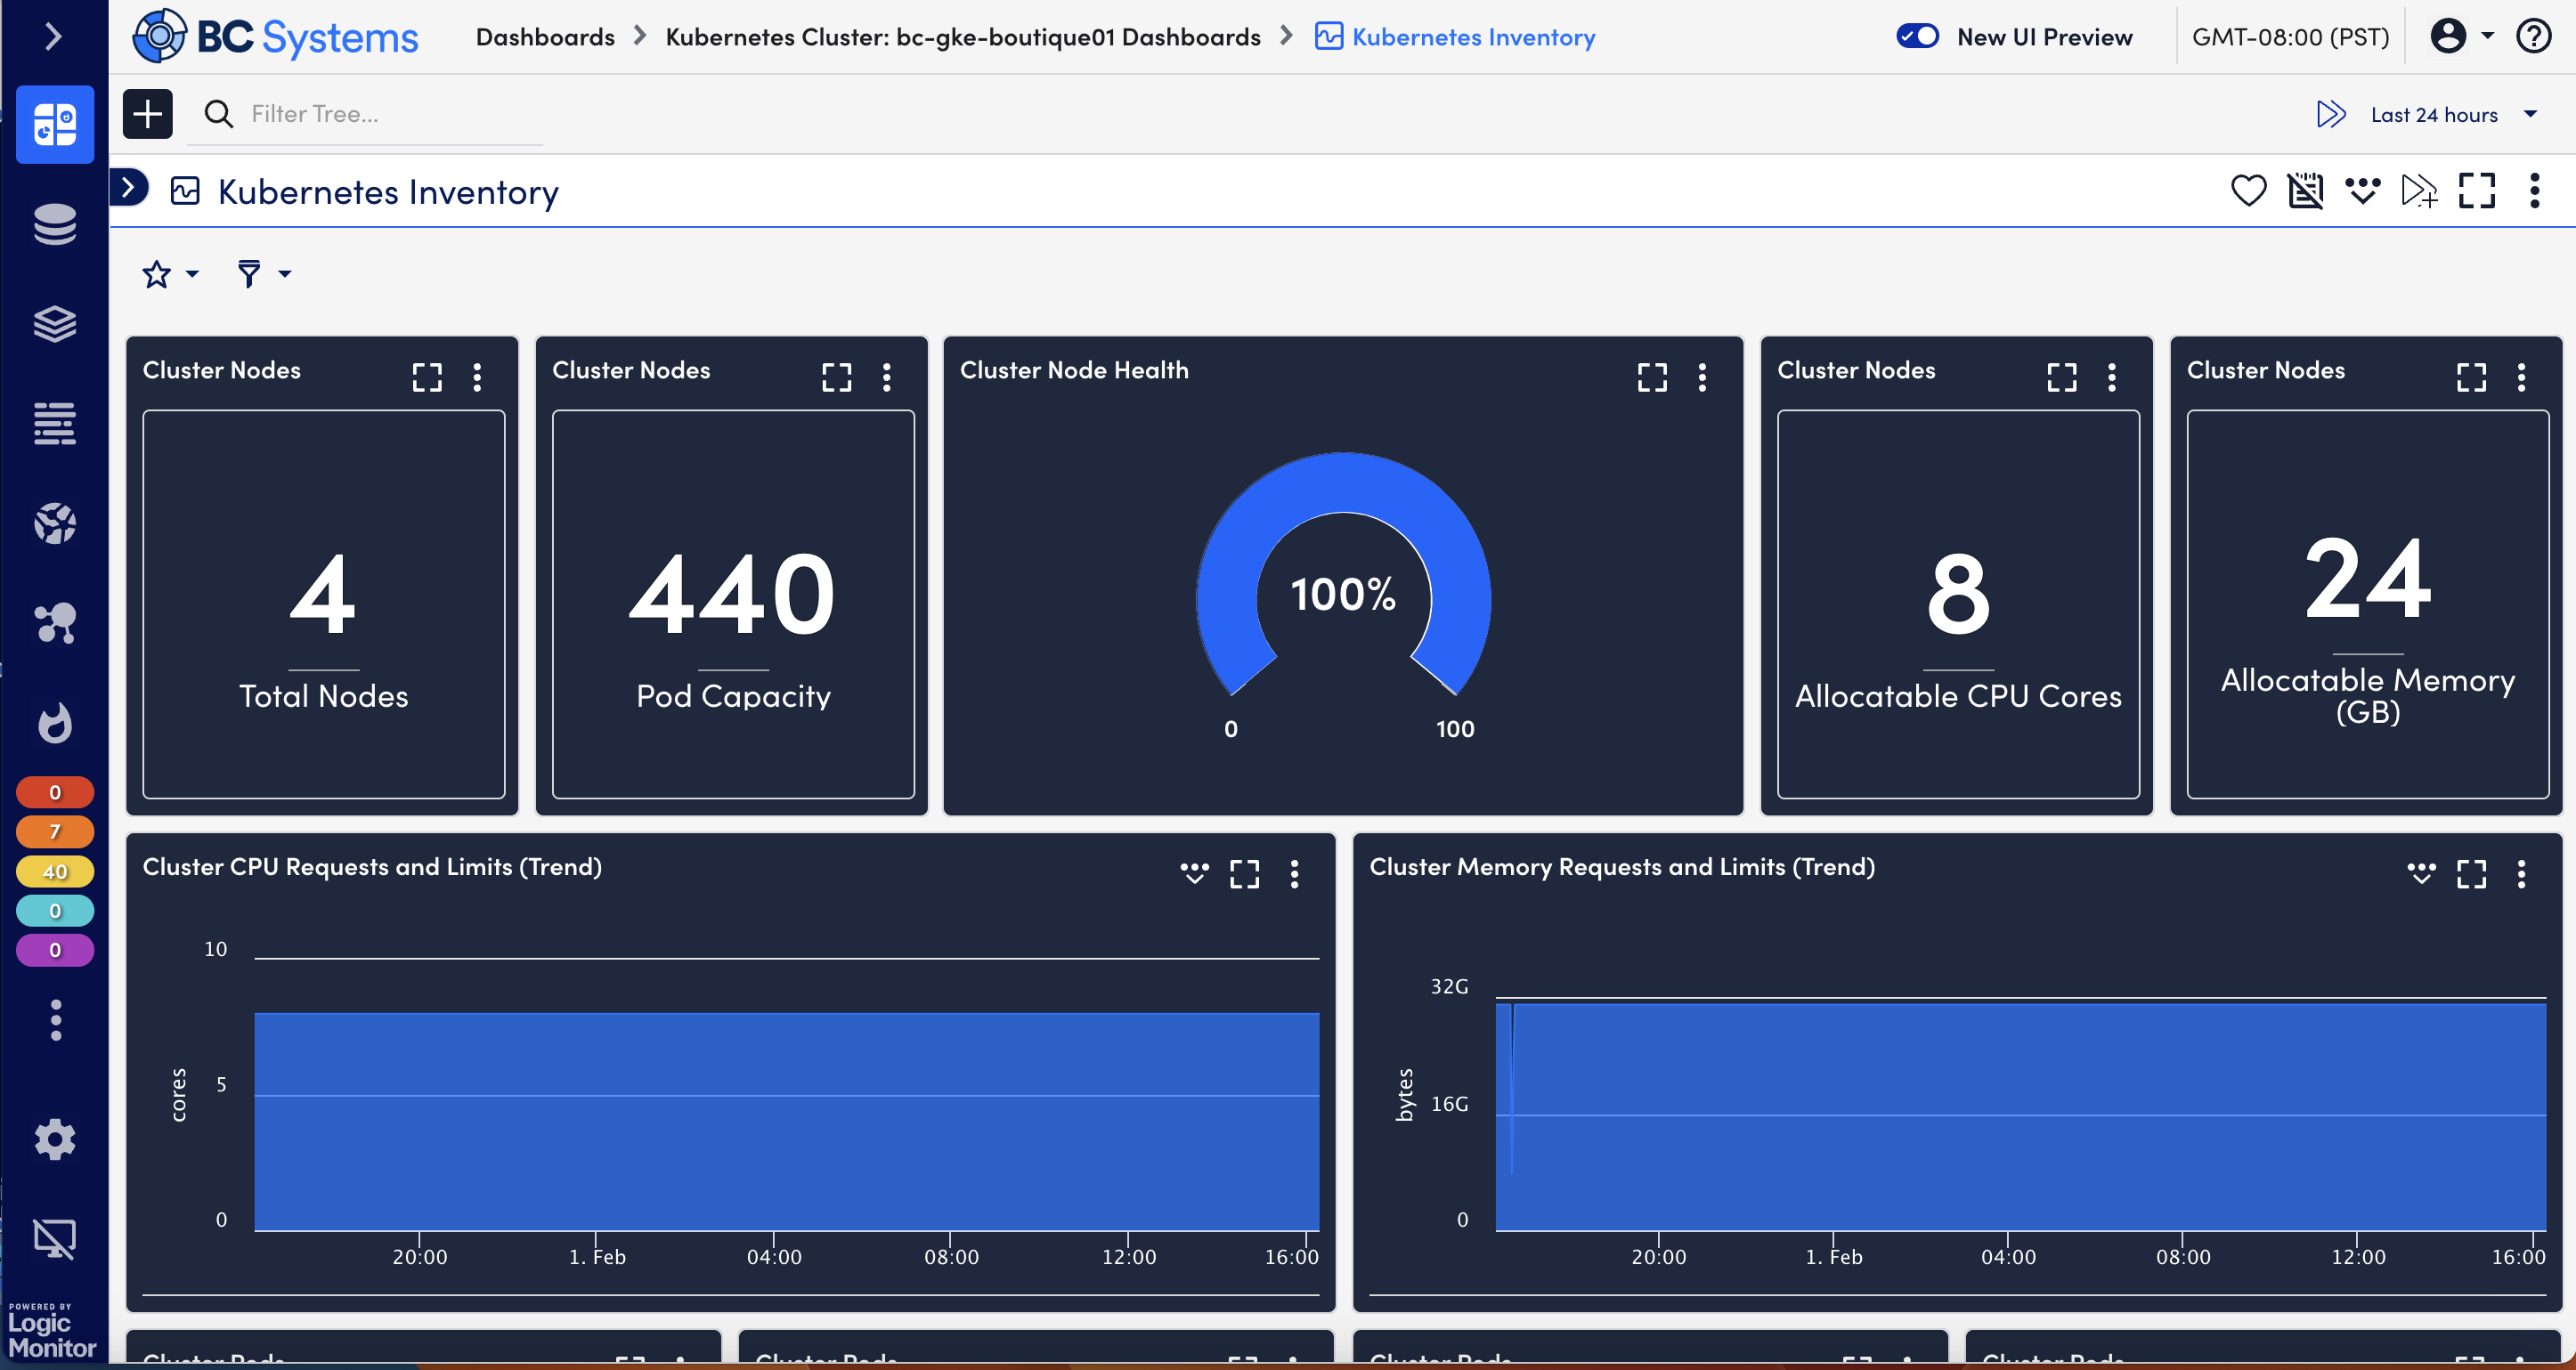
- Automatically adding and removing cluster resources including nodes, pods, and services
- Eliminating the need to deploy an agent on every node
- Providing insights on underutilized resources to optimize CPU, memory, and more
- Storing data for up to two years
Identify performance trends
Maintaining data continuity with the complexity of modern applications is challenging.
LogicMonitor uses data across resources supporting a common application to provide long-term views into how that application performs over time.
- Key performance indicators are aggregated across grouped resources to provide monitoring for the health and performance of the service as a whole.
- LogicMonitor offers intelligent contextual alerting so you can see what matters, solve problems quickly, and remove alert storm distractions.
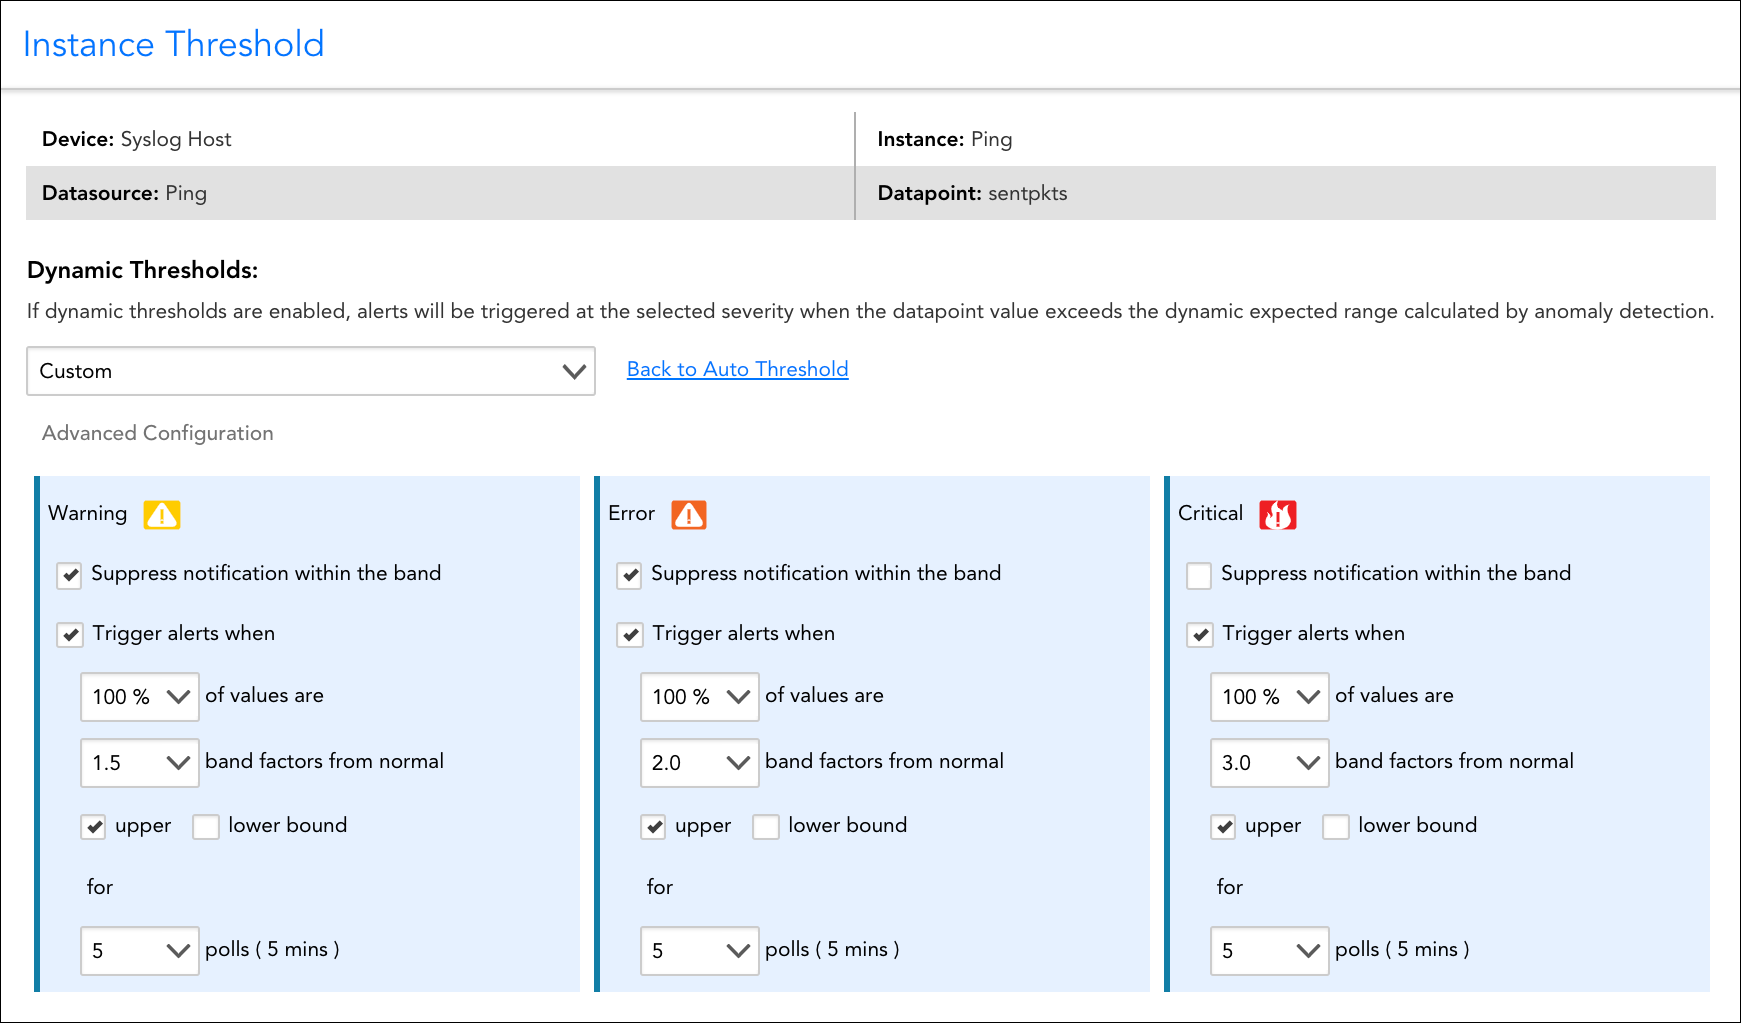
- LogicMonitor proactively alerts you when a container isn’t performing optimally through pre-built or dynamic thresholds.
See our reviews
One of the best monitoring platform that I have used
The entire health and performance of our website can be easily monitored with the help of LogicMonitor. Also, we use it to seamlessly monitor our end user application performance. There is 100% transparency and the troubleshooting is very much simplified which helps us achieve more efficiency in our day to day process.
Jun 27, 2024
Cloud based monitoring tool that excells
It presents to our company an intuitive and helpful interface, we can monitor with the help of tools integrated in this product the servers and other resources, the configuration of the devices does not require more expertise, we can generate several reports that are really helpful to avoid or detect problems into our resources and find the best solution for it
Jun 05, 2024

Track your company’s network and devices with LogicMonitor.
It’s great since we don’t have to install bothersome agents on the devices or hardware that we want to monitor. I didn’t even need to consult the instructions or contact customer support when I wanted to add a device; the process is simple and easy to follow.
Feb 12, 2024
LogicMonitor makes container monitoring easy
Benefits of monitoring your containers with LogicMonitor include:
Automated discovery
Frequent and recurring discovery attempts ensure that your monitoring is always up to date. Metadata is automatically populated during discovery, to give you the contextual information you need when viewing and managing monitored resources.
Performance Health
Get long-term views into how a group of resources supporting a common application are performing and correlate performance trends with events.
Downtime prevention
Pre-configured alert thresholds ensure that you receive meaningful alerts right away to help proactively prevent downtime.
Dynamic grouping
Dynamic grouping for resources supporting a common service makes it simpler to manage and schedule downtime for those resources. LM Container Helm charts allow you to install all the services necessary to monitor your Kubernetes cluster.
Service health
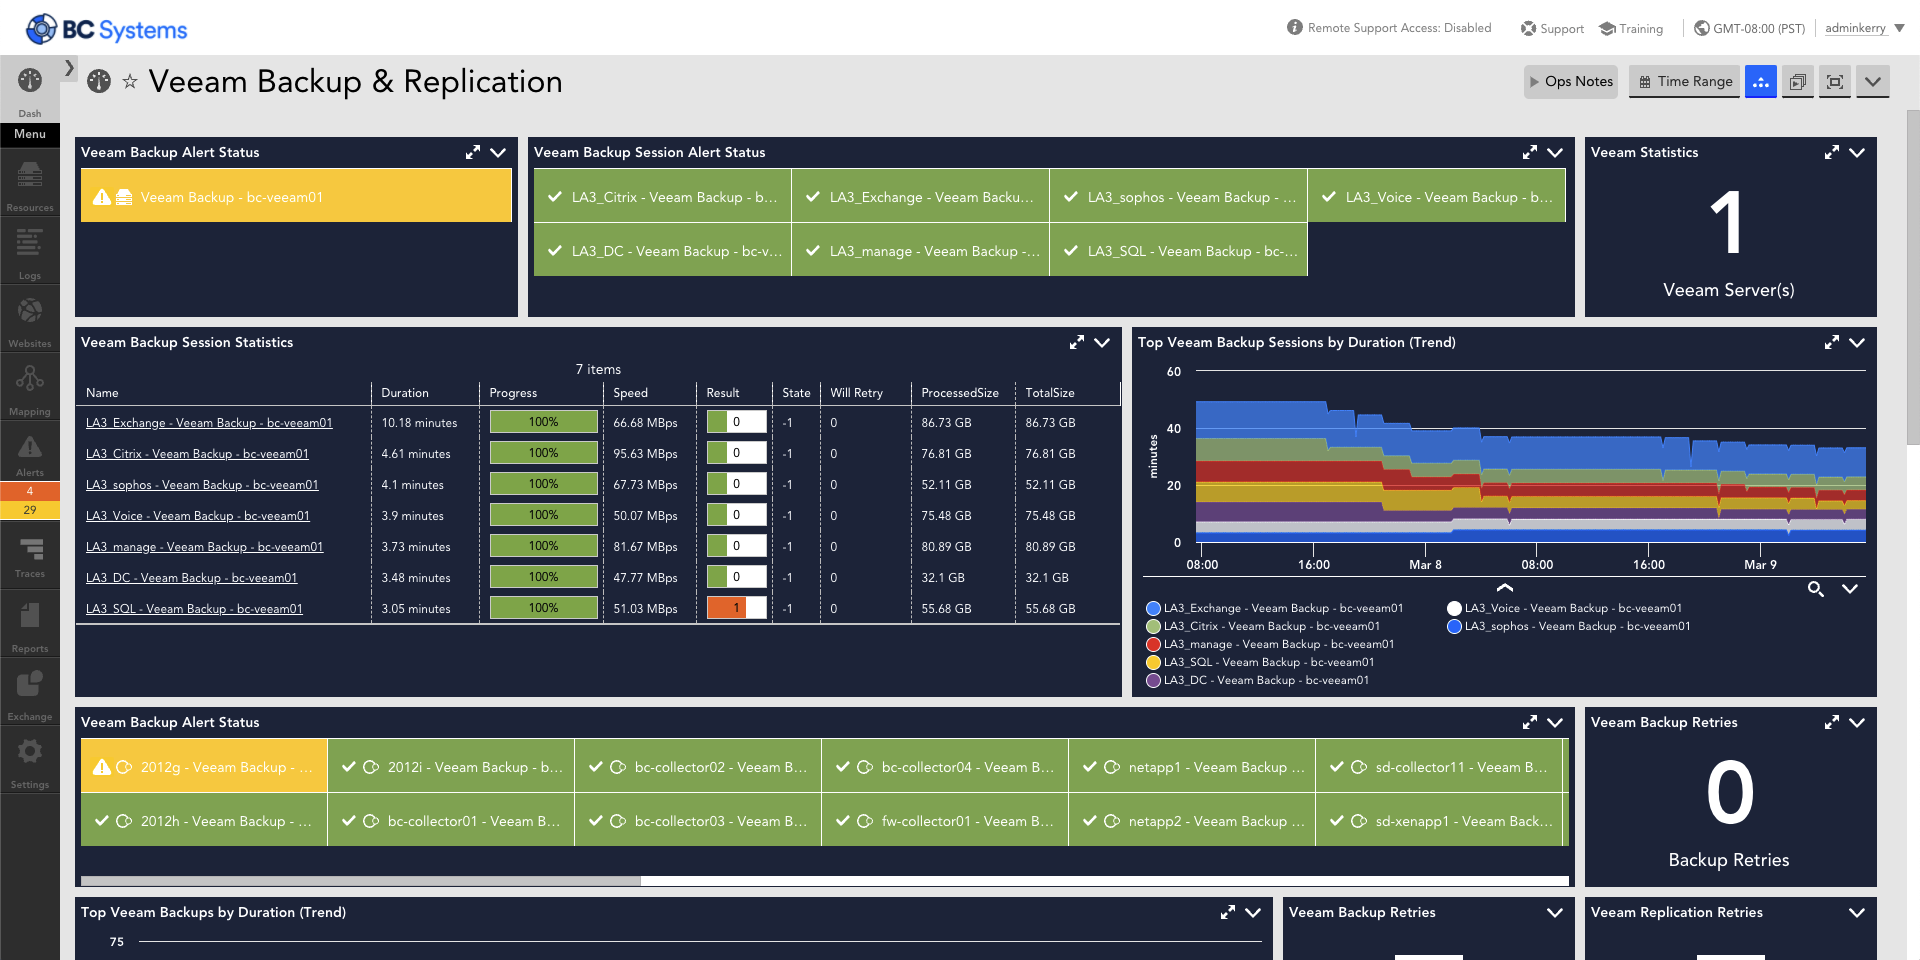
Out-of-the-box dashboards provide immediate insights to help you identify how you can optimize your cluster.
Data retention
Identify trends and forecast utilization over time. LogicMonitor tracks, monitors, and alerts on containers and microservices, and retains data for up to two years.

Related solutions
We have integrated LM into our everyday work. The app is the first thing we look at in the morning, all our team members keep at least one of the customizable dashboards on their desktops at all times.
Sean F., Infrastructure Manager CDK Global
Microservice and Container Monitoring FAQs
- What are microservices
Microservices are an architectural approach to development that is composed of small, individual services that can be built and work on their own, but can be added together for faster development. Microservices are autonomous, allowing each service to work functionally on it’s own.
- What are containers
Containers are bundled packages of software that contain all of the necessary elements to function. A container can house one microservice and the libraries and tools needed for it to function, as well as house multiple microservices together for an entire application to run.
- What are ephemeral containers?
Ephemeral containers a kind of Kubernetes container that temporarily runs in a pod, and can spin up as necessary, which are used primarily for troubleshooting workloads.