With the growing popularity of Kubernetes, the need for effective monitoring solutions has become crucial. LogicMonitor, a leading cloud-based monitoring and observability platform, has rolled out a new set of DataSources in its Kubernetes monitoring solution, LM Container, that uses data from the kube-state-metrics service to provide enhanced visibility into the state of Kubernetes objects. In this article, we will discuss what kube-state-metrics is, why LogicMonitor uses it, the use cases that our new integration can address, and how to get started.
What is kube-state-metrics?
Kube-state-metrics (KSM), a project under the Kubernetes organization, is a lightweight service that runs on Kubernetes and provides information about the state of Kubernetes objects such as nodes, pods, and services. It collects data from the Kubernetes API server and exposes it in a Prometheus-compatible format, which makes it easy to integrate with services that are compatible with the OpenMetrics standard such as LogicMonitor. Kube-state-metrics is an essential tool for monitoring Kubernetes environments as it provides granular visibility into the state of Kubernetes objects and allows for comprehensive monitoring of these objects.
The LM Container‘s KSM integration leverages the data provided by the service to monitor Kubernetes objects and provide deep insights into their state and health. This allows organizations to quickly identify issues and take corrective actions before they impact the performance of their applications.
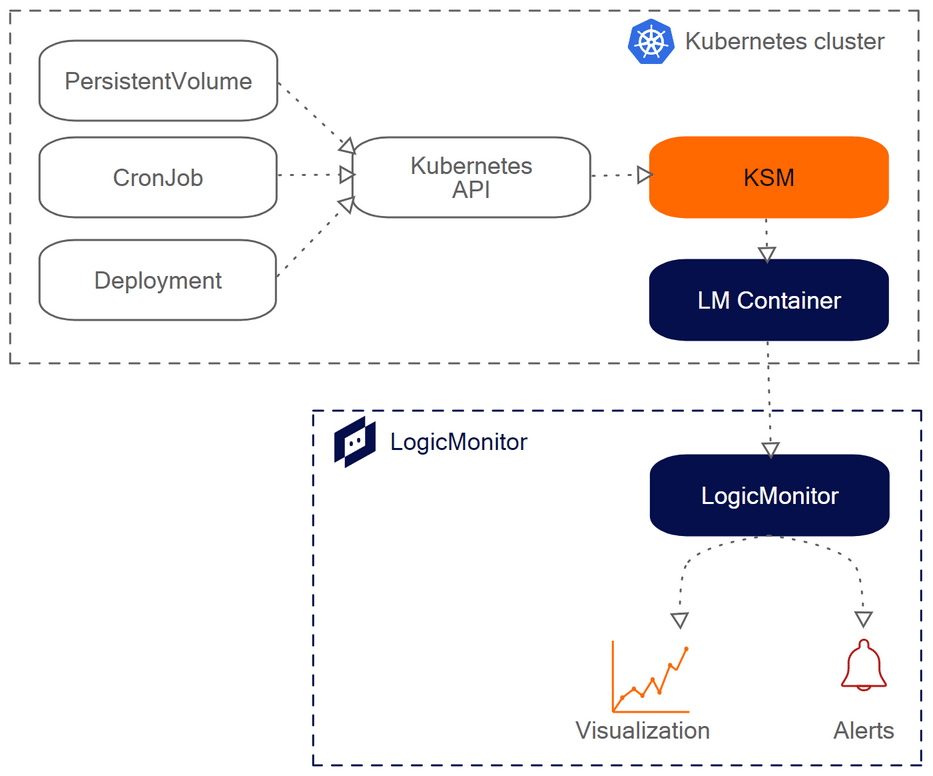
The following diagram illustrates LM Container’s architecture including KSM:
LM Container integration with KSM
KSM and LM Container components run on the customer’s Kubernetes cluster. The LM Container service transports all telemetry including the metrics telemetry data from the KSM service to the LogicMonitor API which is hosted by LogicMonitor. Finally, customers can interact with the telemetry and view alerts on LogicMonitor’s customer portal.
The advantages of using kube-state-metrics for Kubernetes monitoring
LogicMonitor uses kube-state-metrics for monitoring Kubernetes objects for several reasons:
It provides granular visibility into the state of Kubernetes objects, enabling LogicMonitor to detect and alert on issues at the object level. This is crucial for identifying issues that could impact the availability of an application.
It allows for comprehensive monitoring of Kubernetes objects, giving users a holistic view of their Kubernetes environment.
KSM is a lightweight service that is easy to integrate with monitoring solutions that are compatible with OpenMetrics like LogicMonitor, making it an ideal choice for monitoring Kubernetes environments.
Kube-state-metrics has many optimizations built to collect data from Kubernetes objects at a fast rate and at scale, making it an efficient tool for monitoring large Kubernetes environments. LM Container’s integration with KSM allows users to collect and analyze this data in a centralized, easy-to-use platform.
KSM is compatible with multiple Kubernetes distributions, including those from major cloud providers like Amazon Web Services, Google Cloud, and Microsoft Azure. This compatibility means that organizations can use LM Container’s integration with kube-state-metrics to monitor their Kubernetes environments regardless of the cloud provider or distribution they use.
LM Container and KSM integration use cases
Our goal at LogicMonitor is to offer our customers total visibility across platforms. In order to achieve this goal, LogicMonitor integrates with more than 2,000 telemetry sources, including KSM. There are many use cases supported by KSM integration. Here are a few:
Ensuring application availability: LM Container can be used to monitor the health of pods and services, ensuring that applications are available and performing as expected.
Optimizing resource utilization: LM Container allows organizations to monitor resource utilization across Kubernetes environments, identifying areas where resources are underutilized or overprovisioned.
Capacity planning: By analyzing the data collected from LM Container, organizations can identify patterns and trends in their Kubernetes environments. This information can be used to make informed decisions about capacity planning, ensuring that resources are allocated appropriately.
Troubleshooting issues: By providing granular visibility into the state of Kubernetes objects, LM Container can be used to troubleshoot issues quickly and efficiently, reducing downtime and improving the user experience.
Service Level Agreement (SLA) monitoring: LM Container data can be used to monitor and report on SLA compliance for Kubernetes-based services. By tracking key metrics like resource usage, latency, and error rates with our APM solution, organizations can ensure that their services meet the requirements of their SLAs. This can help organizations avoid costly penalties and maintain customer trust.
Monitoring custom metrics: LM Container’s integration with KSM allows organizations to create custom metrics defined and computed within LogicMonitor in addition to the standard Kubernetes metrics. This flexibility enables organizations to track specific metrics that are important to their business, allowing them to gain more insights into their Kubernetes environments.
Getting started
The integration of KSM with LM Container introduces a compatibility challenge, requiring customers to install a compatible version of KSM with LM Container. To address this challenge, LM Container’s new unified Helm chart automatically installs the required version of KSM service during setup. Customers can also use the new Helm chart to update all LM Container components including KSM without worrying about compatibility between components.
Please use the LM Container installation guide with the default settings to install all the components of the monitoring suite including KSM to your Kubernetes cluster. If you use the LM Container user interface to generate the installation scripts, LM Container will also create a new dashboard group and install several out-of-the-box monitoring dashboards for your convenience.
Examples
Here are some of the many visualizations we added to LM Container.
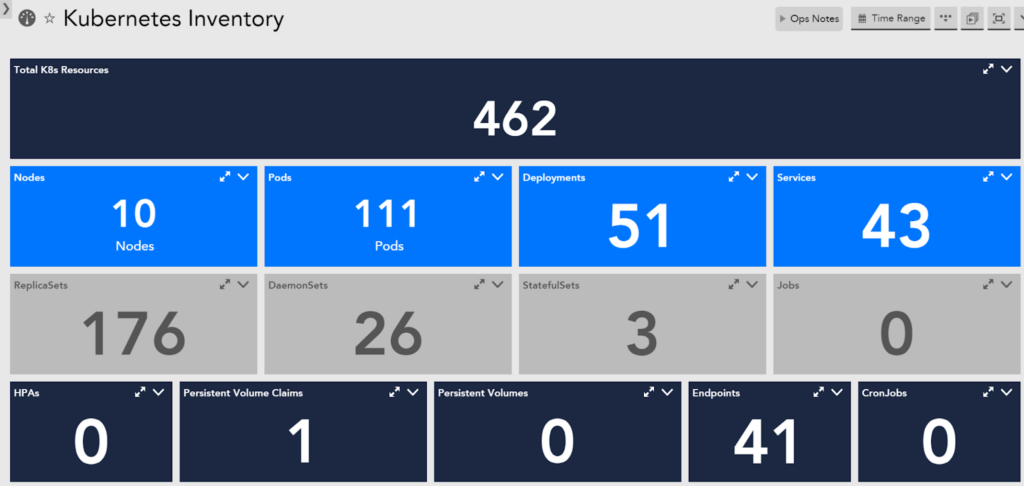
The Kubernetes Inventory dashboard displays the number of Kubernetes objects detected in the cluster by LM Container. It assists customers in planning capacity and estimating costs associated with running clusters.
Partial view of the Kubernetes Inventory dashboard
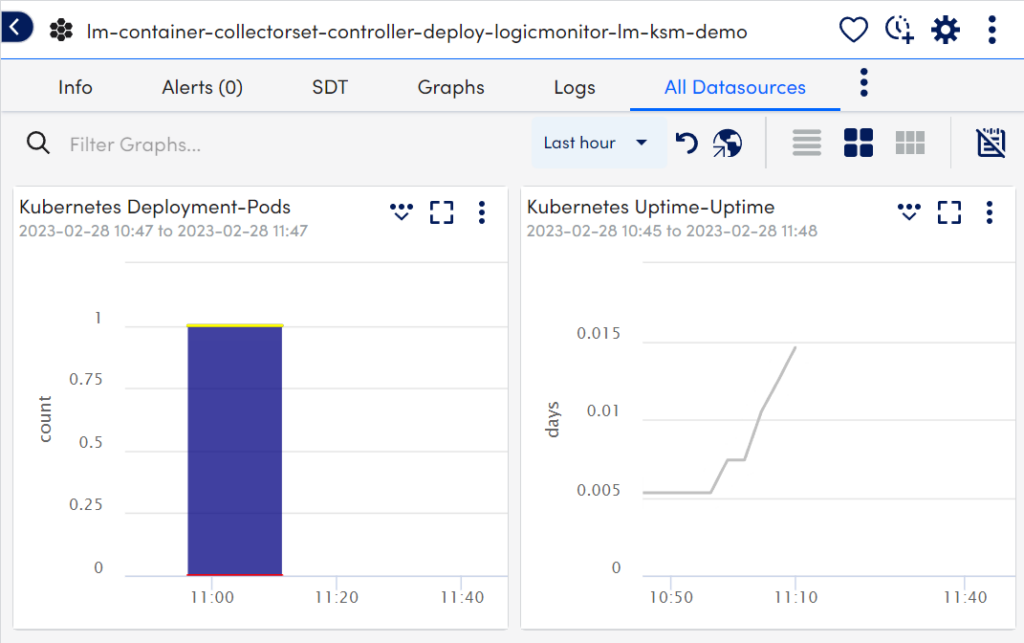
We also built dashboards unique to each object type, such as Kubernetes deployment, that displays important information about each object. Furthermore, many datasources now track temporal changes in critical state information, such as pods (or replicas), in a deployment. The following screenshot shows the current state of a Kubernetes deployment in terms of the number of pods defined in its specification and the length of time the deployment has been running. From this section, you can copy the widgets to an existing or new dashboard.
Graphs depicting temporal state information of a Kubernetes deployment
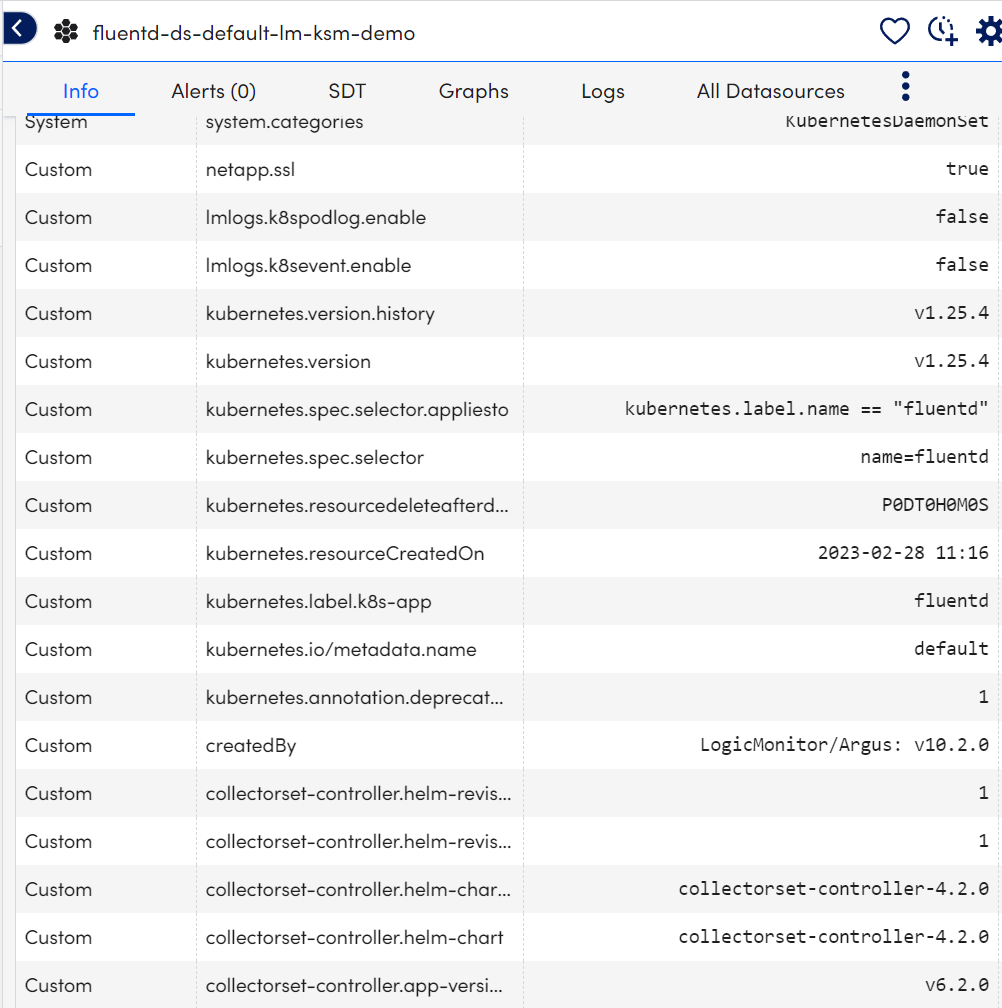
The Info section of the Object Details panel displays the current metadata information for each tracked Kubernetes object. By using this information, you can inspect object metadata such as selectors, namespace, etc., without having to switch tools and execute commands on the Kubernetes cluster. Additionally, this information can be used to write custom alert rules, dashboard filters, and widgets. An example of the metadata LM Container captured from a daemonset running on a cluster can be seen in the screenshot below.
Partial view of the metadata captured from a Kubernetes daemonset
LogicMonitor’s LM Container offers a comprehensive solution for organizations seeking to gain insights into the state of their Kubernetes infrastructure. This article only provides a glimpse of the wealth of telemetry collected by LM Container and made available to the users via the LM platform.
With its automated alerting capabilities, LM Container can promptly identify issues and alert the relevant teams to take corrective actions. Moreover, LM Container’s built-in Artificial Intelligence capabilities can analyze usage trends to help customers identify opportunities for resource optimization, such as resizing nodes or adjusting resource limits. This allows organizations to optimize their infrastructure, minimize downtime, and ensure smooth operations.
By leveraging LM Container’s capabilities, organizations can gain a deeper understanding of their Kubernetes infrastructure and take proactive measures to prevent potential issues.
Conclusion
LM Container’s integration with kube-state-metrics provides organizations with a powerful tool for monitoring their Kubernetes environments. With the ability to collect and analyze data from Kubernetes objects in real-time, IT teams can ensure the performance, reliability, and security of their Kubernetes applications. Additionally, the integration with alerting, dashboarding, and automation capabilities allows IT teams to proactively identify and address issues before they impact the end-users. Overall, LogicMonitor’s KSM integration streamlines the monitoring process for Kubernetes environments, enabling organizations to maximize their Kubernetes visibility, improve their operational efficiency, and deliver a better end-user experience.